DMI + HMA - No Risk ManagementDMI (Directional Movement Index) and HMA (Hull Moving Average)
The DMI and HMA make a great combination, The DMI will gauge the market direction, while the HMA will add confirmation to the trend strength.
What is the DMI?
The DMI is an indicator that was developed by J. Welles Wilder in 1978. The Indicator was designed to identify in which direction the price is moving. This is done by comparing previous highs and lows and drawing 2 lines.
1. A Positive movement line
2. A Negative movement line
A third line can be added, which would be known as the ADX line or Average Directional Index. This can also be used to gauge the strength in which direction the market is moving.
When the Positive movement line (DI+) is above the Negative movement line (DI-) there is more upward pressure. Ofcourse visa versa, when the DI- is above the DI+ that would indicate more downwards pressure.
Want to know more about HMA? Check out one of our other published scripts
What is this strategy doing?
We are first waiting for the DMI to cross in our favoured direction, after that, we wait for the HMA to signal the entry. Without both conditions being true, no trade will be made.
Long Entries
1. DI+ crosses above DI-
2. HMA line 1 is above HMA line 2
Short Entries
1. DI- Crosses above DI+
2. HMA line 1 is below HMA lilne 2
Its as simple as that.
Conclusion
While this strategy does have its downsides, that can be reduced by adding some risk manegment into the script. In general the trade profitability is above average, And the max drawdown is at a minimum.
The settings have been optimised to suite BTCUSDT PERP markets. Though with small adjustments it can be used on many assets!
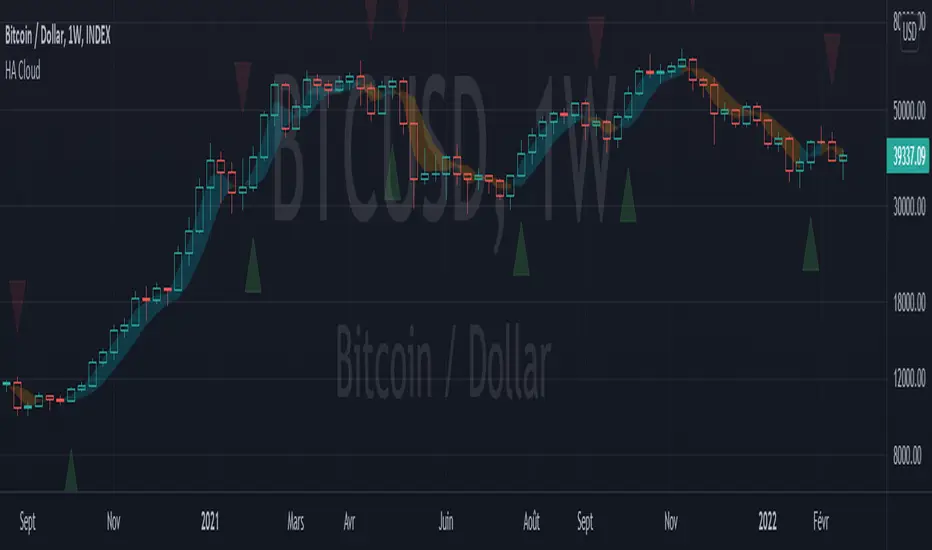
A-trend

Heikin Ashi Cloud overlayThis script displays a cloud representing the bodies of Heikin Ashi candles, which allows to have all the information of the HA technique without losing focus on the classical candles.
Also has arrows to indicate a trend reversal (counterproductive in a range !)
[SCL] Bias Add-On for Counter-Strike ProThis script comes as a pair with Counter-Strike Pro (also pictured above). This bias add-on is designed to be set to retrieve bias from a higher timeframe, allowing you to trade using information from multiple timeframes in one chart. The two scripts do not have to be used together.
Counter-Strike Pro is a trend/counter-trend indicator. It combines Momentum Failure Patterns and Moving Average flow into one to give a continuous long/short bias. Momentum Failure Patterns are breaks of relevant market structure, where the structure that’s relevant is updated dynamically according to momentum alignment.
The limitations of Counter-Trend Pro are the same as for most trend indicators: it can get chopped up if price starts trending and then reverses, ranges, or is generally choppy. It needs a certain level of history in order to work properly, and it works better the more cleanly an asset trends.
Advantages of Counter-Trend Pro versus other trend indicators are that it can, depending on conditions, enter trends earlier and get shaken out less, precisely because it uses a combination of price levels and trend – but you would need to test it against your particular trend indicators for your favourite assets and timeframes to verify this.
This indicator includes alerts for all signals. It does not repaint.
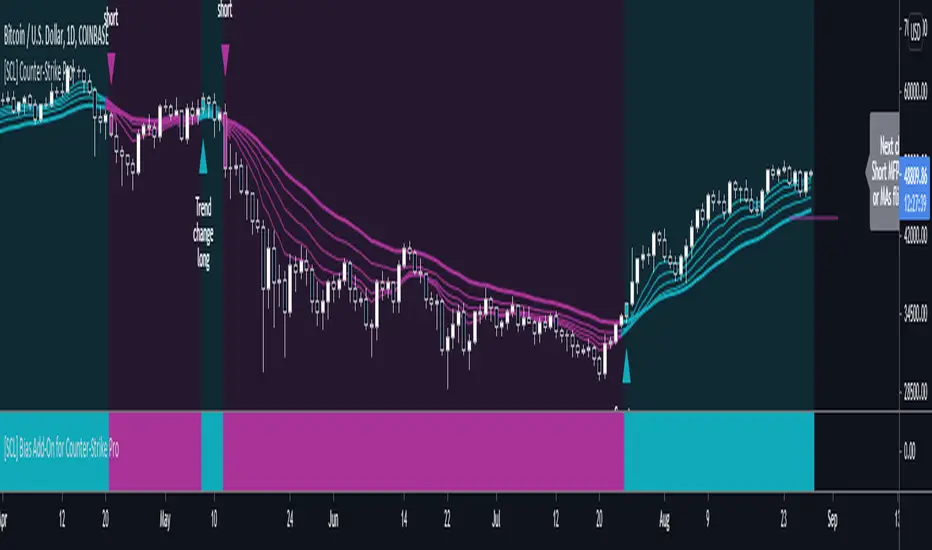
[SCL] Counter-Strike ProCounter-Strike Pro is a trend/counter-trend indicator. It combines Momentum Failure Patterns and Moving Average flow into one to give a continuous long/short bias. Momentum Failure Patterns are breaks of relevant market structure, where the structure that’s relevant is updated dynamically according to momentum alignment.
Counter-Strike Pro comes as a pair with “Bias Add-On for Counter-Strike Pro” (also pictured above), which is designed to be set to retrieve bias from a higher timeframe, allowing you to trade using information from multiple timeframes in one chart. They do not have to be used together.
Counter-Strike Pro doesn’t only tell you when the trend has changed; it tells you the price level that has to be broken (on-close) in order for the trend to change.
The limitations of Counter-Trend Pro are the same as for most trend indicators: it can get chopped up if price starts trending and then reverses, ranges, or is generally choppy. It needs a certain level of history in order to work properly, and it works better the more cleanly an asset trends.
Advantages of Counter-Trend Pro versus other trend indicators are that it can, depending on conditions, enter trends earlier and get shaken out less, precisely because it uses a combination of price levels and trend – but you would need to test it against your particular trend indicators for your favourite assets and timeframes to verify this.
This indicator includes alerts for all signals. It does not repaint.

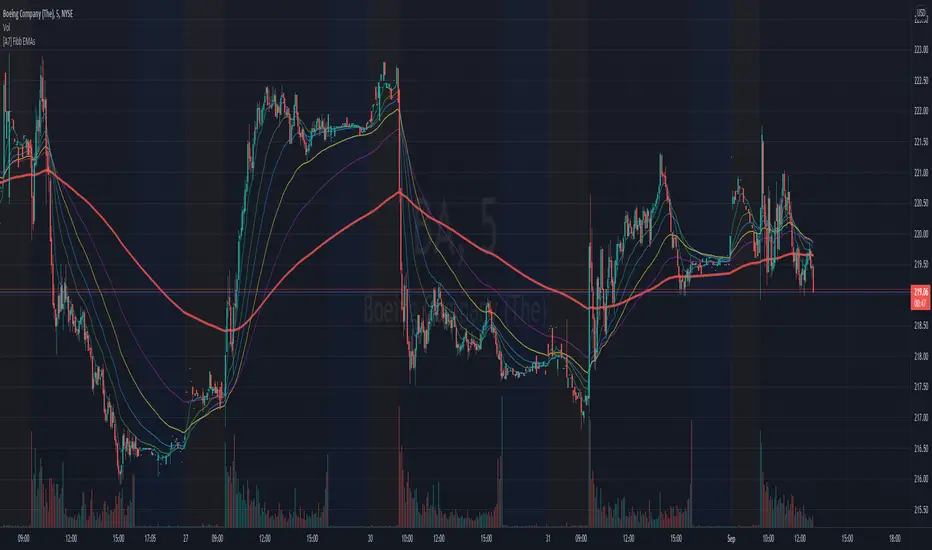
[A7] Fibonacci EMAs (8,21,34,55,89,233) Fibonacci EMAs (8,21,34,55,89,233)
Fibonacci Exponential Moving Averages
8 - aqua
21 - green
34 - blue
55 - yellow
89 - purple
233 - red
trend_vol_stopThe description below is copied from the script's comments. Because TradingView does not allow me to edit this description, please refer to the script's comments section, as well as the release notes, for the most up-to-date information.
----------
Usage:
The inputs define the trend and the volatility stop.
Trend:
The trend is defined by a moving average crossover. When the short
(or fast) moving average is above the long (slow) moving average, the
trend is up. Otherwise, the trend is down. The inputs are:
long: the number of periods in the long/slow moving average.
short: the number of periods in the short/fast moving average.
The slow moving average is shown in various colors (see explanation
below. The fast moving average is a faint blue.
Volatility stop:
The volatility stop has two modes, percentage and rank. The percentage
stop is given in terms of annualized volatility. The rank stop is given
in terms of percentile.
stop_pct and stop_rank are initialized with "-1". You need to set one of
these to the values you want after adding the indicator to your chart.
This is the only setting that requires your input.
mode: choose "rank" for a rank stop, "percentage" for a percentage stop.
vol_window: the number of periods in the historical volatility
calculation. e.g. "30" means the volatility will be a weighted
average of the previous 30 periods. applies to both types of stop.
stop_pct: the volatility limit, annualized. for example, "50" means
that the trend will not be followed when historical volatility rises
above 50%.
stop_rank: the trend will not be followed when the volatility is in the
N-th percentile. for example, "75" means the trend will not be
followed when the current historical volatility is greater than 75%
of previous volatilities.
rank_window: the number of periods in the rank percentile calculation.
for example, if rank_window is "252" and "stop_rank" is "80", the
trend will not be followed when current historical volatility is
greater than 80% of the previous 252 historical volatilities.
Outputs:
The outputs include moving averages, to visually identify the trend,
a volatility table, and a performance table.
Moving averages:
The slow moving average is colored green in an uptrend, red in a
downtrend, and black when the volatility stop is in place.
Volatility table:
The volatility table gives the current historical volatility, annualized
and expressed as a whole number percentage. E.g. "65" means the
instrument's one standard deviation annual move is 65% of its price.
The current rank is expressed, also as a whole number percentage. E.g.
"15" means the current volatility is greater than 15% of previous
volatilities. For convenience, the volatilities corresponding to the
0, 25, 50, 75, and 100th percentiles are also shown.
Performance table:
The performance table shows the current strategy's performance versus
buy-and-hold. If the trend is up, the instrument's return for that
period is added to the strategy's return, because the strategy is long.
If the trend is down, the negative return is added, because the strategy
is short. If the volatility stop is in (the slow moving average is
black), that period's return is excluded from the strategy returns.
Every period's return is added to the buy-and-hold returns.
The table shows the average return, the standard deviation of returns,
and the sharpe ratio (average return / standard deviation of returns).
All figures are expressed as per-period, whole number percentages.
For exmaple, "0.1" in the mean column on a daily chart means a
0.1% daily return.
The number of periods (samples) for each strategy is also shown.

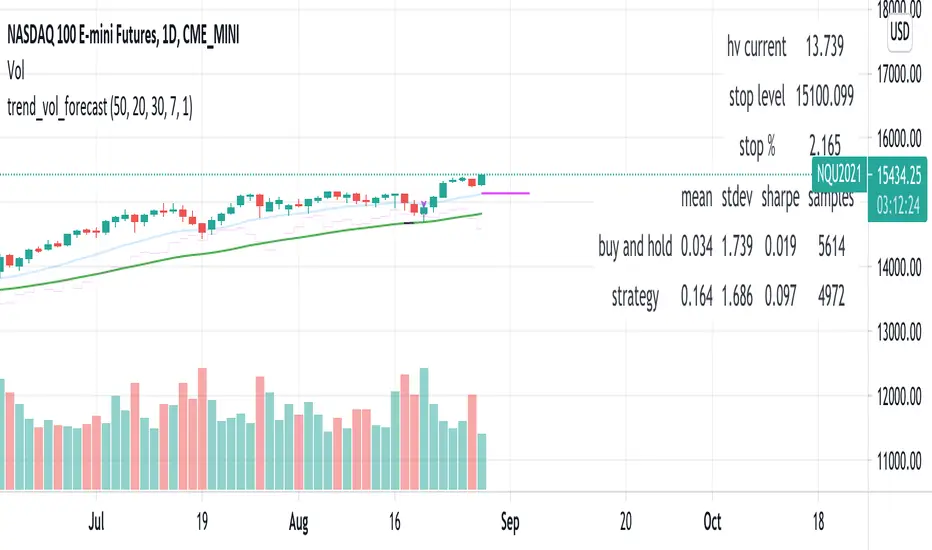
trend_vol_forecastNote: The following description is copied from the script's comments. Since TradingView does not allow me to edit this description, please refer to the comments and release notes for the most up-to-date information.
-----------
USAGE
This script compares trend trading with a volatility stop to "buy and hold".
Trades are taken with the trend, except when price exceeds a volatility
forecast. The trend is defined by a moving average crossover. The forecast
is based on projecting future volatility from historical volatility.
The trend is defined by two parameters:
- long: the length of a long ("slow") moving average.
- short: the length of a short ("fast") moving average.
The trend is up when the short moving average is above the long. Otherwise
it is down.
The volatility stop is defined by three parameters:
- volatility window: determines the number of periods in the historical
volatility calculation. More periods means a slower (smoother)
estimate of historical volatility.
- stop forecast periods: the number of periods in the volatility
forecast. For example, "7" on a daily chart means that the volatility
will be forecasted with a one week lag.
- stop forecast stdev: the number of standard deviations in the stop
forecast. For example, "2" means two standard deviations.
EXAMPLE
The default parameters are:
- long: 50
- short: 20
- volatility window: 30
- stop forecast periods: 7
- stop forecast standard deviations: 1
The trend will be up when the 20 period moving average is above the 50
period moving average. On each bar, the historical volatility will be
calculated from the previous 30 bars. If the historical volatility is 0.65
(65%), then a forecast will be drawn as a fuchsia line, subtracting
0.65 * sqrt(7 / 365) from the closing price. If price at any point falls
below the forecast, the volatility stop is in place, and the trend is
negated.
OUTPUTS
Plots:
- The trend is shown by painting the slow moving average green (up), red
(down), or black (none; volatility stop).
- The fast moving average is shown in faint blue
- The previous volatility forecasts are shown in faint fuchsia
- The current volatility forecast is shown as a fuchsia line, projecting
into the future as far as it is valid.
Tables:
- The current historical volatility is given in the top right corner, as a
whole number percentage.
- The performance table shows the mean, standard deviation, and sharpe
ratio of the volatility stop trend strategy, as well as buy and hold.
If the trend is up, each period's return is added to the sample (the
strategy is long). If the trend is down, the inverse of each period's
return is added to the sample (the strategy is short). If there is no
trend (the volatility stop is active), the period's return is excluded
from the sample. Every period is added to the buy-and-hold strategy's
sample. The total number of periods in each sample is also shown.
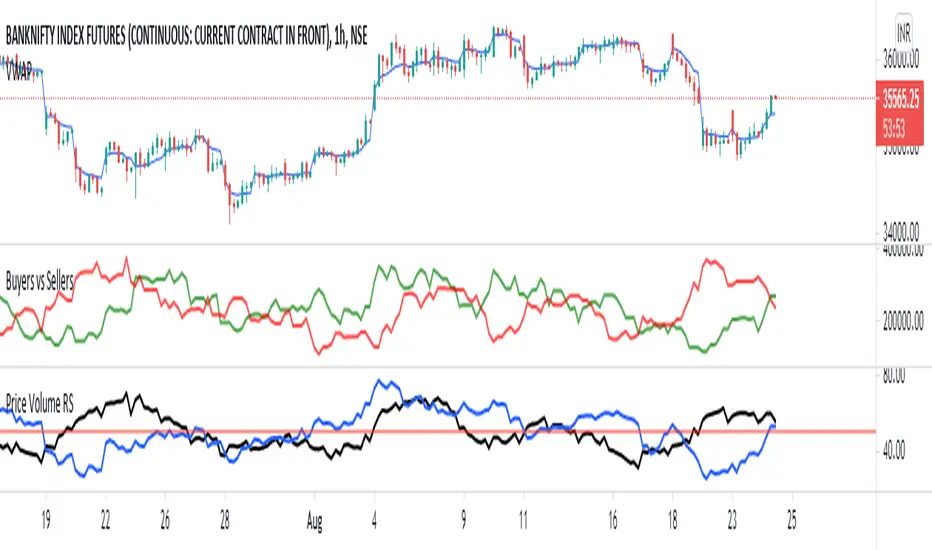
Relative Strength - Price & VolumeNow you can see both Price & Volume Relative Strength Together
If both Price & Volume increases, then BULLISH
If both Price & Volume decreases, then UNCERTAIN, NEUTRAL, TRAP
If Price decreases & Volume increases, then BEARISH
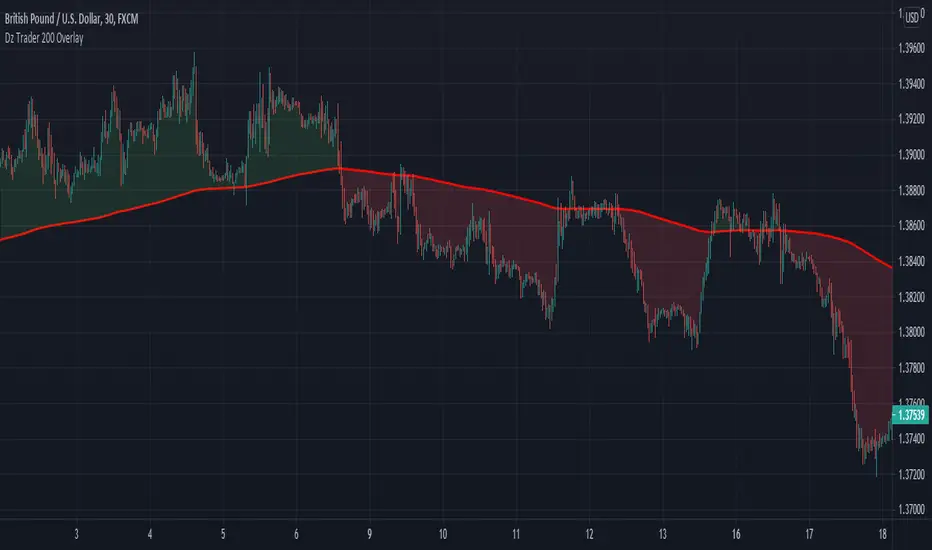
Dz Trader 200 Cloud Overlaythis indicator is a simply smoothed 200 moving average, displayed with a cloud. it will either be red cloud for bearish or green cloud for bullish. apply to chart to make it easy to see what the chart is doing compared to the size of the cloud
Daily Dax Strategy
-----------------
Hey there!
There are a lot of reasons why this strategy has performed very well in recent years.
A very simple strategy in itself. The system basically follows the trend following approach. The focus is always on rising trends. No action takes place during falling trends. Both time filters and trend filters are used. There is only one position per day which is compulsorily closed again at the end of the time filter.
Only for CURRENCYCOM:DE30 !
The indicator is designed for the h1 hourly chart. In addition, the display can be adjusted using the options.
That's all. Due to the economic background, the strategy can be used without a large technical chart analysis.
Warning: Before contacting a position, it is always more important than having strong news. Better to play it safe in these same ones.
Caution: With this strategy, as an exception, no SL is allowed by default. Therefore always calculate the risk carefully.
Past results do not guarantee future profits!
Follow the link below to get access to this indicator or get us a PM to get access.
--------------------------------------------------------------------------------------------------------------
--------------------------------------------------------------------------------------------------------------
-----------------
Willkommen!
Es gibt viele Gründe, warum sich diese Strategie in den letzten Jahren ganz gut bewährt hat.
Eine sehr einfache Strategie für sich. Grundsätzlich folgt das System dem Trendfolge Ansatz. Es wird immer nur auf steigende Trends gesetzt. Während fallenden Trends finden keine Aktionen statt. Es werden sowohl Zeitfilter als auch Trendfilter verwendet. Es gibt nur eine Position am Tag welche zwingend auch am Ende des Zeitfilters wieder geschlossen wird.
Only for CURRENCYCOM:DE30 !
Der Indikator ist für den h1 Stundechart ausgelegt. Zusätzlich kann die Anzeige über die Optionen angepasst werden.
Das ist alles. Aufgrund des wirtschaftlichen Hintergrunds kann die Strategie ohne umfangreiche technische Chartanalyse verwendet werden.
Achtung: Vor dem Öffnen einer Positionen immer zuerst prüfen ob starke News anstehen. In diesen Fällen lieber auf Nummer sicher gehen.
Achtung: Bei dieser Strategie ist standardmäßig ausnahmsweise kein SL vorgesehen. Daher das Risiko Immer gut kalkulieren.
Vergangene Ergebnisse garantieren keine zukünftigen Gewinne!
Verwenden Sie den folgenden Link, um Zugriff auf diesen Indikator zu erhalten oder schreibe uns eine PM um Zugriff zu erhalten.

Av3Based on the ANNE EA v3 for MT4. For use on FOREX.
if ATR is greater than ATR average taken from last 5 candles, then market considered as trending, and so Open(0)>Close(1)=buy Open(0)Close(1)=sell Open(0)

High/Low Channel Multi averages Crypto Swing strategyThis is a swing strategy designed for trending markets such as crypto and stock, with big timeframes , like 8h.
For this strategy we take SMA, EMA, VWMA, ALMA, SMMA, LSMA and VWMA and make an apply them all to both HIGH and LOW separately and make 2 averages, 1 applied to high and the other applied to low.
With them we make a channel.
Rules for entry
For long: close of a candle is above avg applied to high.
For short: close of a candle is below avg applied to low.
Rules for exit
We exit when we either hit TP or SL or when we receive a different condition than the entry one.(long- > short and viceversa)
If you have any questions, let me know !

Swing/Scalper HULL + T3 avg Crypto StrategyThis is a both a swing and a scalper strategy(depends on the timeframe that you use), that works with all timeframes, however I noticed that with swing 3h works the best on most crypto pairs, such as ETH, BTC and so on.
Its main components are:
Hull moving average
T3 moving average
Risk management
With them I make an average and use it as the main moving average.
Rules for entry
For long: Average moving average is bigger than previous average moving average value.
For short:Average moving average is lower than previous average moving average value.
Rules for exit
We exit when either the TP/SL has been hit, or when we get a different condition than previous one(both for long and short).
If you have any questions, let me know !

Percentage Oscillator SwingThe percentage price oscillator (PPO) is a technical momentum indicator.
It shows the relationship between the close of a candle and the highest/lowest point with a specific lenght in percentage terms.
Rules
The higher percentage on the values upwards, compared to those downwards, the higher the power of the bull trend.
The higher percentage on the values downwards, compared to those upwards, the higher the power of the bear trend.

Trend Momentum with Buyers / Sellers PowerHi there!
With this indicator, you can hunt big trends before they start.
This indicator is combined with RSI and Momentum indicators
It can show you the power of trend and which side it wants to go
It can help you to open a position at the first point of a new trend or at the safe and proven point of the trend, also it can help you to close your position before the trend change its direction (it's not recommended to use it to close your positon, but sometimes it can help you to find the ending point of big pumps)
Rules:
* Baseline is ZERO ( 0 ) line
* When gray line crossover red line, it shows us a powerful uptrend
* When the gray line crossunder the red line it shows us a powerful upward trend
Signals:
* Only use Buy signals(Long) when they are above or crossing-up baseline
* Only use Sell signals(Short) when they are under or crossing-down baseline
* If they both (red and gray lines) are too high and they suddenly starting to come back to baseline, it shows we have a range trend, the trend is weak or a reversal trend is coming!!
!! WARNING: DO NOT USE THIS INDICATOR ALONE !!
Suggestions :
-Use 1H, 4H, daily, or Weekly timeframes
-Use ADX and DI or three WMA's
-Use divergence
-You can use it for scalping but you need to change the inputs (not recommended)
If you have any idea about making new indicators(what information do you want from the chart?), comment please, then I can research and make it for all of us! =)

Stochastic Weighted RSI w/ Divergence + Signals🐢 Tawtis' Stochastic Weighted Relative Strength Index , aka SWRSI
This indicator combines the Stochastic RSI and the classic RSI we all know and love to create a more effective indication of seller/buyer dominance, and in turn, trend. I have named it the "Stochastic Weighted RSI". The script also includes a standard RSI, so you can use both at the same time!
Loads of customisation, pretty much every input can be changed to fit your preferences, however, the default settings are what I would personally recommend for the best results. Either way, feel free to change them!
By looking at the indicator, you can also establish the trend that may follow in the candles to come.
Typically, an indicator reading of over 70 is considered overbought, and an indicator reading of under 30 is considered oversold.
The calculations for the SWRSI and its signals take into account a multitude of exponential moving averages, a Stochastic RSI and a classic RSI, among other things.
There are 2 types of signals provided by the indicator, being strong and weak. You do not have to follow these, and they aren't always accurate (it's impossible to be accurate 100% of the time), however, they can give a good idea of the trend that will ensue.
Strong buy signals are created when:
SWRSI is under 30
SWRSI is over the EMA (default 2) of the SWRSI
Short EMA (default 20) is under the long EMA (default 50)
Strong sell signals are created when:
SWRSI is over 70
SWRSI is under the EMA (default 2) of the SWRSI
Short EMA (default 20) is over the long EMA (default 50)
Weak buy and sell signals are printed as green and red background highlights, and operate the same as the strong buy and sells, without the short/long EMA criterion. Both of these signal types can be toggled off using the settings if you do not want to see them.
Enjoy!
