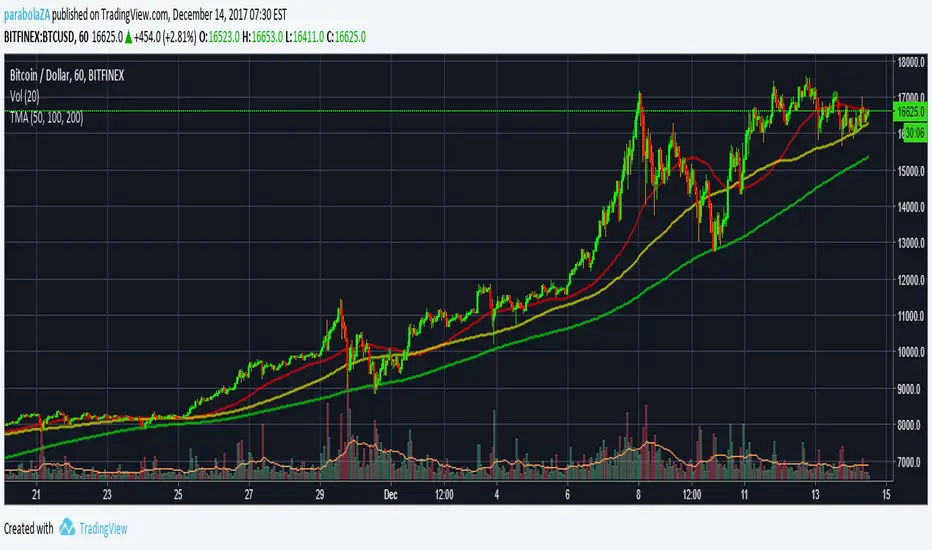
Multiple Moving AveragesThis is really simple. But useful for me as I don't have a paid account. No-pro users can only use 3 indicators at once and because I rely heavily on simple moving averages it can be a real pain.
This one indicator features:
20 MA
50 MA
100 MA
200 MA
which I find are the most useful overall. The 20 and 50 over all time frame but in particular < 1 day, the 100 and 200 at > 4 hr time frames. In general I don't use the 100 MA that much. The daily 200 MA is a critical support for many assets like stocks and cryptos. I'm by no means a pro and if you are learning I recommend becoming familiar with moving averages right at the beginning.
If you want to deactivate some of the lines, you can do it via the indicator's settings icon.
Average

BTC World Price: Multi-Exchange VWAPBTC World Price: Multi-Exchange VWAP
__________________________
WHAT IT DOES
What you see above are not Bitmex candles, but this indicator's.
Bitcoin is listed on multiple exchanges. Many people have called for a single global index that would quote BTC price and volume across all exchanges: this script is such a virtual aggregate (formerly: Multi-Listed , Volume-Weighted Average Price ).
It will, independently for each tick, for any time-frame:
- Quote the price (O, H, L, C) and volume from Bitfinex (USD), Binance (USDT), bitFlyer (Yen), Bithumb (S. Korean Won), Coinbase (USD), Kraken (EUR) and even Bitmex (USD Contracts).
- Weight each price with the corresponding volume of the exchange.
- Quote the FOREX conversion rate in USD for each currency (USDJPY etc.)
- Finally return global average price (candles) in USD.
- Additionally provide (H+L)/2 etc. values.
No more "on Coinbase this" or "on Bitstamp that", you've now got a global overview!
See CoinMarketCap: Markets for reference. I've included alternative exchanges in the comments at the top of the script.
__________________________
HOW TO USE IT
Basically just add it to your chart and use the indicator's candles instead of the chart's main ticker.
By default, BTC World Price will display candles only, but you can also display OHLC & averages (in whichever style you want).
You may indeed want to hide the main symbol (top-left corner, click the 'eye' button next to its name), or switch it to something else than candles/bars (e.g. line).
Make sure "Scale Price Chart Only" is disabled if you want to use the auto-zoom feature. (if other indicators are messing your zoom, you can try to select "Line with Breaks" or "Area with Breaks" to allow these to overflow from the main window)
By clicking the triangle next to the indicator's name, you can select "Visual Order" (e.g "Bring to Front").
You can select regular Candles or Heikin-Ashi in Options.
In the Format > Inputs tab, you can select which exchanges to quote. By default, all of them are enabled.
The script also exposes the following typical values to the backend, which you can use as Price Source for other indicators: (e.g. MA, RSI, in their "Format > Input" tab)
Open Price (grey)
High Price (green)
Low Price (red)
Close Price (white)
(H + L)/2 (light blue)
(H + L + C)/3 (blue)
(O + H + L + C)/4 (purple)
They are all hidden by default (by means of maximum transparency).
In the Format > Style tab, you can change their color, transparency and style (line, area, etc), as well as uncheck Candles and Wicks to hide these.
If you are using "Indicator Last Value" and want to clear the clutter from all these values, simply uncheck them in Style. They will still be available as Price Source for other indicators.
You can also choose to scale it to the left, right (default) or "screen" (no scaling).
Once you're satisfied with your Style, you may click "Default"> "Save as default" in the botton-left. Everytime you load the indicator, it will look the same. ("Reset Settings" will reset to the script's defaults)
__________________________
Please leave feedback below in comments or pm me directly for bugs and suggestions.

Always show daily EMAThis script will always plot the daily EMA regardless of which timeframe you are on.

DayMidPointDayMidPoint - Plot the moving average of the Daily price midpoint for short periods of time (i.e. 3 day or 5 day). Great for detecting the short term daily trend direction to determine a SHORT or LONG position building in a stock. Use with DayHigh and DayLow indicators. for nice price channels on a chart.

DayHigh - Plot the Moving Average of the Daily HighPlot the Moving Average of the Daily High for short periods of time (i.e 3 day or 5 day). Great for detecting when a stocks SELL pressure is running out and time to switch to a BUY strategy. Use in the DayHIGH indicator for nice price channels on a chart.
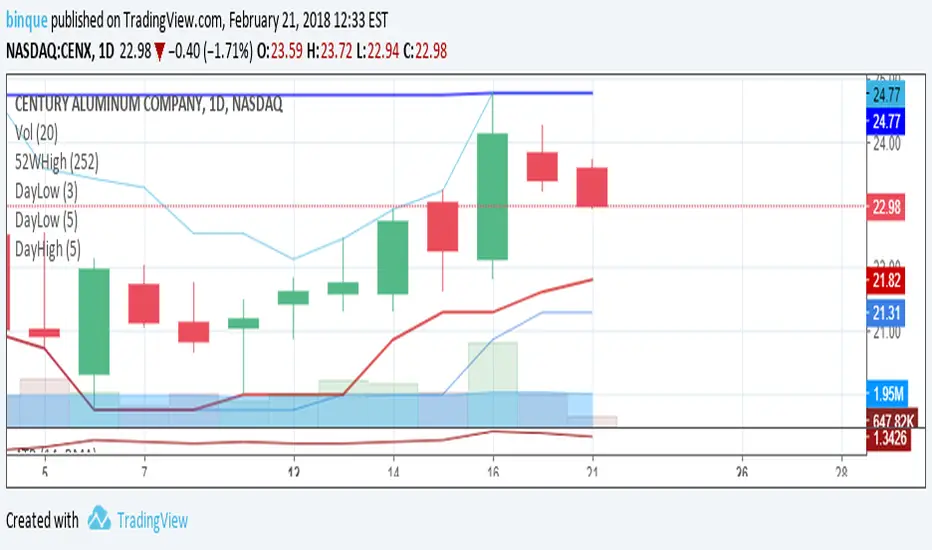
DayLow - Chart the Moving Average of the DAILY LOW PriceThis is a moving average of the Daily LOW Price over a short period of time (i.e. 3 day low moving average, etc...) Great for tracking trailing stops for a stock on an up swing.


BTC Price Spread - Coinbase & Futs - Premiums & DiscountsThis indicator takes the price of Bitcoin on Coinbase and the futures price on Mex, and compares it the average price of Bitcoin across other major exchanges.
This essentials give us a spread at which Bitcoin is going for.
In turn, this could be a possible tool to help determine market sentiment.
This indicator was created for experimental purposes.
Use at your own digression.


3SMAThis script plots three Simple Moving Averages instead of just one.
Support me going through grad school!
www.linkedin.com
BTC tip jar: 1Mv1s7nLaTsRoLai5WXEGg8doisXuiPUXy
ETH tip jar: 0x6113DDD23D0D5aCad3d1f8640A8A571E9Cb86cB8
LTC tip jar: LYvyoqTSWxa22TQw3E7818xy4AfYNi6xcm
BCH tip jar: 1GC7oZ7MhLkamKCDdZFnUfV21SKWq84VdY

Currency StrengthRepublished: The original script violated house rules by including an external link to Backtest Rookies.
Background
The currency strength indicator takes up to 4 forex pairs and calculates the average strength across all pairs. The indicator uses the pair's daily percentage change to calculate the overall strength. For flexibility, it can accept any instrument as an input. This means you can use multiple instances to track various currency strengths. It was designed with the major pairs in mind but there is no reason why it cannot be used for other FX pairs.
Note: The indicator defaults to GBP. When setting it up for other currencies, be sure to flag whether the currency is a counter currency or not.
The code is provided free and open source. Please modify it as you see fit.
Screenshots
Defaults with Annotation
Yen strength beating pound strength
Opposing Trends

Triple MASuper simple.
Three simple moving averages all in a single indicator for your convenience.
Default values:
MA 1 - 20
MA 2 - 50
MA 3 - 100
If you like this or any of my other scripts - please consider chucking some BTC my way ;) 1LbFxAYJSVPxirT8eW31QHaGbySHyPYgMq

Average Daily Range - without open barBasic ADR-indicator that is showing the daily range on lower timeframes as well, without using the current open daily bar for calculation.
Also plots as line in a separate indicator window. Updates displayed value when hovering over the candles on the chart to see historical Numbers.

Average True Range - without open barBasic ATR without the current open bar in progress, it calculates the closed bars within the chosen ATR Period

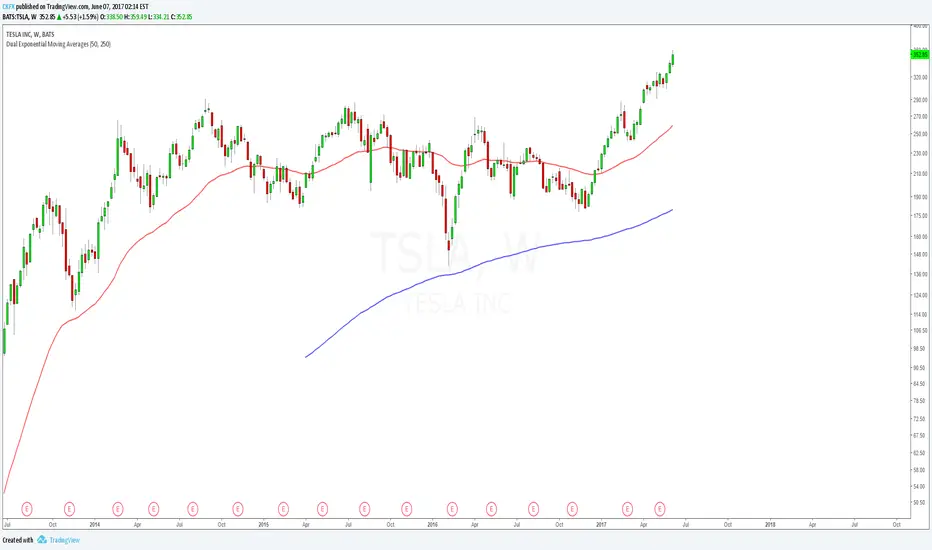
Dual Exponential Moving AveragesJust like the regular "Moving Average Exponential" indicator except this allows you to show 2 with custom time intervals, saving non-subscribers to Trading View an indicator slot. Enjoy.
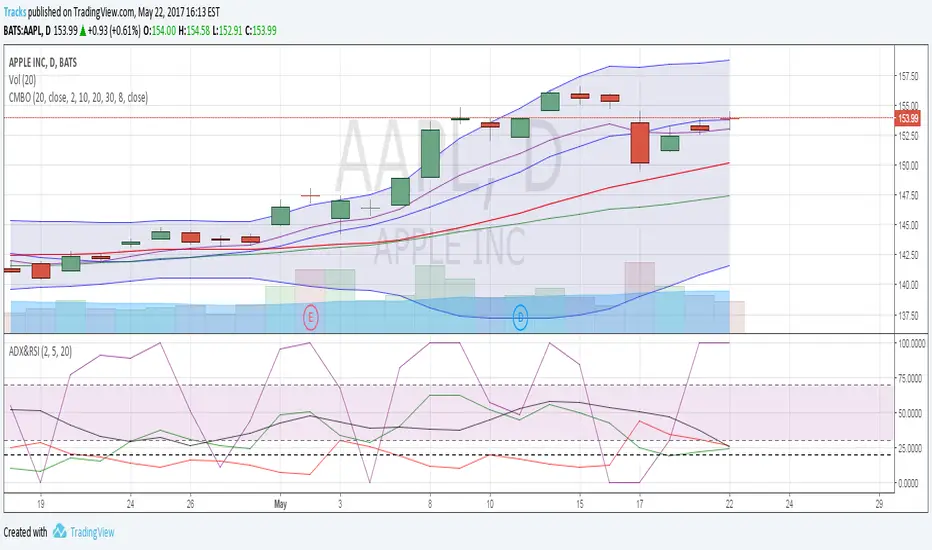
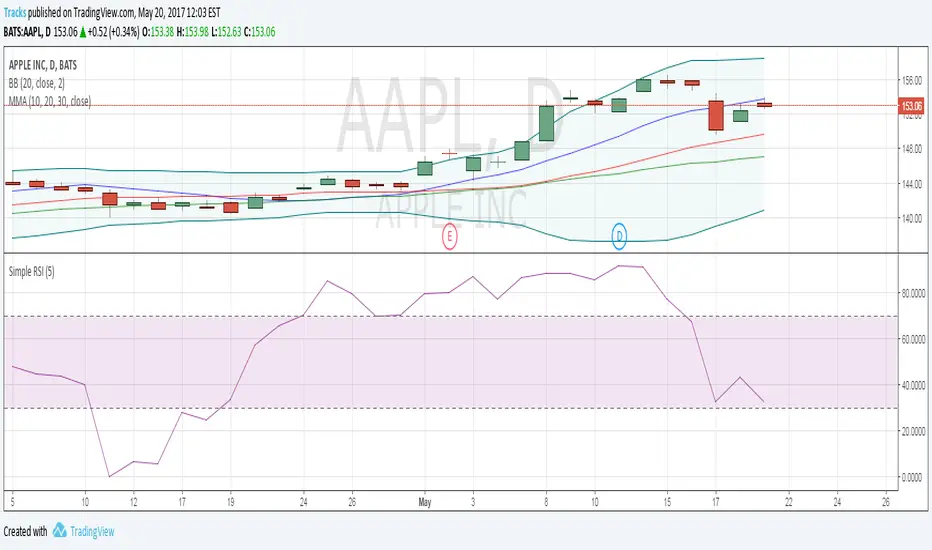
Combo IndicatorFor easier setup, this script combines 5 indicators. 3 simple moving averages, 1 EMA and Bollinger Bands. These are common indicators that are that often used and discussed on OptionsPlayers.com
Multiple Moving AverageCombines 3 moving average plot lines into one indicator for easy configuration
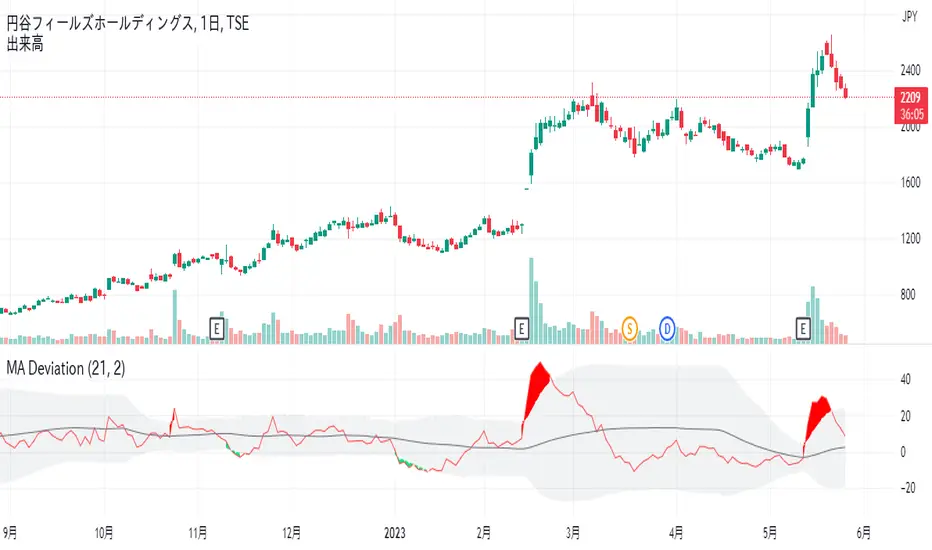
Moving average deviation rateMoving average deviation rate
Simple moving average deviation rate and standard deviation.
The bollinger band is momentum value standard devition.
Bat the bollinger band is not normal distribution to close price.
Moving average deviation rate is normal distribution.
This indicator is draw Moving average deviation rate and fill area 2σ standard devition.
If it exceeds 2σ, it is a trading opportunity.
移動平均かい離率と、2σのバンドです。
ボリンジャーバンドは移動量の標準偏差を描画しますが、終値はボリンジャーバンドに対して正規分布を描きません。
移動平均かい離率は、標準偏差に対して正規分布を示します。
かい離率2σを超えた場合、トレードチャンスです。
Multiple Moving Averages using only 1 Indicator!Multiple moving averages in one indicator, so those of you without a pro membership can add multiple moving averages to your chart while only taking up 1 of the 3 indicators.

CMOabsav Backtest This indicator plots the absolute value of CMO averaged over three
different lengths. This indicator plots a classical-looking oscillator,
which is really an averaged value based on three different periods.
You can change long to short in the Input Settings
Please, use it only for learning or paper trading. Do not for real trading.
