Rolling ATR Momentum
Rolling ATR Momentum Indicator – User Manual
---
🔍 Overview
The Rolling ATR Momentum Indicator is a simple yet powerful tool designed to detect shifts in market volatility. It compares the current Average True Range (ATR) with the ATR from a previous point in time to measure how market volatility is changing.
This indicator is especially useful for:
- Spotting the beginning or fading of a momentum phase
- Filtering out low-volatility market conditions
- Enhancing timing for entries and exits in trending or breakout trades
---
📊 Key Components
✅ ATR Delta (Rolling)
- Definition: `ATR Delta = Current ATR - Past ATR`
- Inputs:
- ATR Period (default: 14): The base ATR calculation window
- Lookback Period (default: 5): How many bars ago to compare ATR
- Interpretation:
- Positive ATR Delta (Green Line): Market volatility is increasing
- Negative ATR Delta (Red Line): Market volatility is decreasing
📈 Zero Line
- A horizontal baseline at zero helps you easily see when ATR momentum shifts from negative to positive (or vice versa).
🟩/🟥 Background Color
- Green Background: ATR Delta is positive (rising volatility)
- Red Background: ATR Delta is negative (falling volatility)
🔵 Optional: ATR Reference Lines
- You can optionally display raw Current ATR and Past ATR by changing their visibility settings.
---
✅ How to Use It
Entry Timing (Futures/Options)
- Use ATR Delta as a filter:
- Only take trades when ATR Delta is positive → confirms momentum is building
- Avoid trades when ATR Delta is negative → market might be slow, sideways, or losing steam
Breakout Anticipation
- A rising ATR Delta after a tight range or consolidation can suggest that a breakout is underway
Stop-loss Strategy
- Use high ATR periods for wider stops (to avoid noise)
- Use low ATR periods for tighter stops or skip trading
---
🧠 Pro Tips
- This indicator doesn’t predict direction—combine with trend or price structure tools (like EMA, PPMA, candlesticks)
- Works best in trending or breakout environments
- Add it to multi-timeframe layouts to see volatility buildup on higher timeframes
---
⚙️ Settings
| Parameter | Description |
|----------|-------------|
| ATR Period | Length of the ATR calculation (default 14) |
| Lookback Period | How many bars back to compare ATR values |
---
🧭 Best For:
- Index futures (Nifty, BankNifty)
- Option buyers needing volatility confirmation
- Intraday & swing traders looking to trade momentum setups
---
Use the Rolling ATR Momentum indicator as your volatility radar—simple, clean, and highly effective for staying on the right side of market energy.
End of Manual
Khoảng dao động thực tế trung bình (ATR)

Rolling ATR Momentum - EnhancedATR Rolling Momentum Indicator – User Manual
---
🔍 Overview
The ATR Rolling Momentum Indicator is a dynamic volatility tool built on the Average True Range (ATR). It not only tracks increasing or decreasing momentum but also provides early warnings and confirmation signals for potential breakout moves. It’s especially powerful for futures and options traders looking to align with expanding price action.
---
📊 Core Components
✅ ATR Delta (Rolling ATR)
- Definition: Difference between current ATR and past ATR (user-defined lookback).
- Use: Tells whether volatility is expanding (positive delta) or contracting (negative delta).
- Visual: Green line for rising momentum, red for declining.
🟣 ATR Delta Slope
- Definition: Measures acceleration in momentum.
- Use: Helps identify early signs of breakout buildup.
- Visual: Purple line. Watch for slope turning up from below.
🟡 Volatility Squeeze (Yellow Dot)
- Definition: Current ATR is significantly lower than its 20-period average.
- Use: Indicates the market is coiling—possible breakout ahead.
🔼 Momentum Start (Green Triangle)
- Definition: ATR Delta slope turns from negative to positive.
- Use: Early warning to prepare for volatility expansion.
🔷 Breakout Confirmation (Blue Label Up)
- Definition: ATR Delta exceeds its high of the last 10 candles.
- Use: Confirms volatility breakout—trade opportunity if direction aligns.
🟩/🟥 Background Color
- Green Background: Momentum rising (positive ATR delta)
- Red Background: Momentum falling (negative ATR delta)
- Yellow Tint: Active squeeze zone
---
✅ How to Use It (Futures/Options Focus)
Step-by-Step:
1. Squeeze Detected (Yellow Dot) → Stay alert. Market is coiling.
2. Green Triangle Appears → Momentum is starting to rise.
3. Background Turns Green → Confirmed rising momentum.
4. Blue Label Appears → Confirmed breakout (enter trade if trend aligns).
Directional Bias:
- Use your main chart setup (price action, EMAs, trendlines, etc.) to decide direction (Call or Put, Long or Short).
- ATR Momentum only tells you how strong the move is—not which way.
---
⚙️ Inputs & Settings
- ATR Period: Default 14 (core volatility measure)
- Rolling Lookback: Used to calculate delta (default 5)
- Slope Length: Used to measure acceleration (default 3)
- Squeeze Factor: Default 0.8 — lower = more sensitive squeeze detection
- Breakout Lookback: Checks ATR delta against last X bars (default 10)
---
🧠 Pro Tips
- Works great when paired with EMA stacks, price structure, or breakout patterns.
- Avoid taking trades based only on squeeze or momentum—combine with chart confirmation.
- If background turns red after a breakout, it may be losing momentum—book partials or tighten stops.
---
🧭 Ideal For:
- Nifty/BankNifty Futures
- Option directional trades (call/put buying)
- Index scalping and momentum swing setups
---
Use this tool as your volatility compass—it won't tell you where to go, but it'll tell you when the wind is strong enough to move fast.
End of Manual

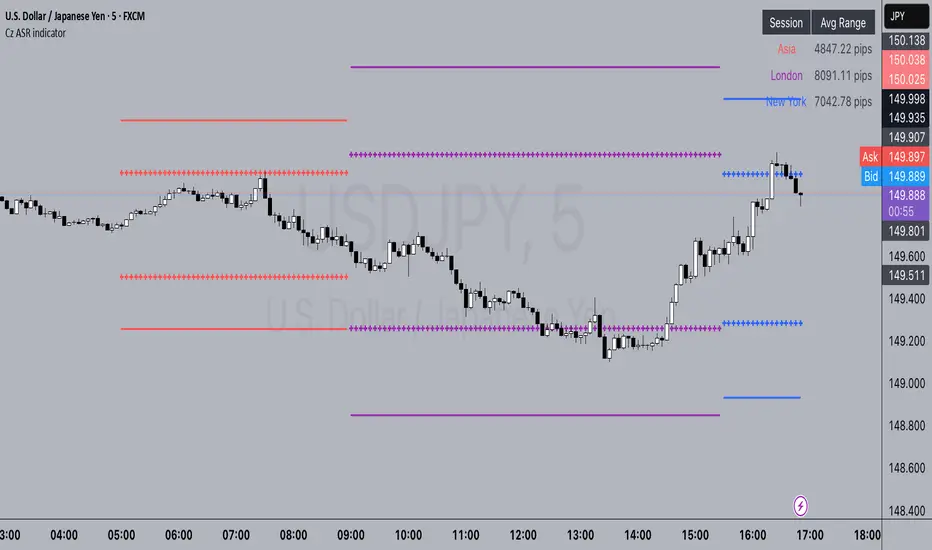
Cz ASR indicatorAverage session range indicator built by me. Great tool to gauge volatility and intraday reversal zones. Great for FX as there is an included table that shows range in pips; however, this can be applied across all assets as a volatility measure.
How it works:
The script measures the range of sessions, including Asia, London, and New York. The lookback period could be adjusted so you can find what length works best and is most accurate. This is then averaged out to provide the ASR. This provides us with an upper and lower bound of which the price could potentially fluctuate in based on the past session ranges. I have also added the 50% ASR, which is also a super useful metric for reversals or continuations.
There is also a configurable UTC so that you can adjust the indicator so it can accurately measure the range within certain sessions.
Note - different session start and stop times vary from market to market. I have set the code to the standard forex market opens however, if you wish to change the time ,you are able to do so by editing the variables in the script
Enjoy :)
ATR - Asymmetric Turbulence Ribbon🧭 Asymmetric Turbulence Ribbon (ATR)
The Asymmetric Turbulence Ribbon (ATR) is an enhanced and reimagined version of the standard Average True Range (ATR) indicator. It visualizes not just raw volatility, but the structure, momentum, and efficiency of volatility through a multi-layered visual approach.
It contains two distinct visual systems:
1. A zero-centered histogram that expresses how current volatility compares to its historical average, with intensity and color showing speed and conviction
2. A braided ribbon made of dual ATR-based moving averages that highlight transitions in volatility behavior—whether volatility is expanding or contracting
The name reflects its purpose: to capture asymmetric, evolving turbulence in market behavior, through structure-aware volatility tracking.
_______________________________________________________________
🔧 Inputs (Fibonacci defaults)
ATR Length
Lookback period for ATR calculation (default: 13)
ATR Base Avg. Length
Moving average period used as the zero baseline for histogram (default: 55)
ATR ROC Lookback
Number of bars to measure rate of change for histogram color mapping (default: 8)
Timeframe Override
Optionally calculate ATR values from a higher or fixed timeframe (e.g., 1D) for macro-volatility overlay
Show Ribbon Fill
Toggles colored fill between ATR EMA and HMA lines
Show ATR MAs
Toggles visibility of ATR EMA and HMA lines
Show Crossover Markers
Shows directional triangle markers where ATR EMA and HMA cross
Show Histogram
Toggles the entire histogram display
_______________________________________________________________
📊 Histogram Component: Volatility Energy Profile
The histogram shows how far the current ATR is from its moving average baseline, centered around zero. This lets you interpret volatility pressure—whether it's expanding, contracting, or preparing to reverse.
To complement this, the indicator also plots the raw ATR line in aqua. This is the actual average true range value—used internally in both the histogram and ribbon calculations. By default, it appears as a slightly thicker line, providing a clear reference point for comparing historical volatility trends and absolute levels.
Use the baseline ATR to:
- Compare real-time volatility to previous peaks or troughs
- Monitor how ATR behaves near histogram flips or ribbon crossovers
- Evaluate volatility phases in absolute terms alongside relative momentum
The ATR line is particularly helpful for users who want to keep tabs on raw volatility values while still benefiting from the enhanced visual storytelling of the histogram and ribbon systems.
Each histogram bar is colored based on the rate of change (ROC) in ATR: The faster ATR rises or falls, the more intense the color. Meanwhile, the opacity of each bar is adjusted by the effort/result ratio of the price candle (body vs. range), showing how much price movement was achieved with conviction.
Color Interpretation:
🔴 Red
Strong volatility expansion
Market entering or deepening into a volatility burst
Seen during breakouts, panic moves, or macro shock events
Often accompanied by large real candle bodies
🟠 Orange
Moderate volatility expansion
Heating up phase, often precedes breakouts
Common in strong trending environments
Signals tightening before acceleration
🟡 Yellow
Mild volatility increase
Transitional state—energy building, not yet exploding
Appears in early trend development or pullbacks
🟢 Green
Mild volatility contraction
ATR cooling off
Seen during consolidation, reversion, or range balance
Good time to assess upcoming directional setups
🔵 Aqua
Moderate compression
Volatility is clearly declining
Signals consolidation within larger structure
Pre-breakout zones often form here
🔵 Deep Blue
Strong volatility compression
Market is coiling or dormant
Can signal upcoming squeeze or fade environment
Often followed by sharp expansion
Opacity scaling:
Brighter bars = efficient, directional price action (strong bodies)
Faded bars = indecision, chop, absorption, or wick-heavy structure
Together, color and opacity give a 2D view of market volatility: Hue = the type and direction of volatility
Opacity = the quality and structure behind it
Use this to gauge whether volatility is rising with conviction, fading into neutrality, or compressing toward breakout potential.
_______________________________________________________________
🪡 Ribbon Component: Volatility Rhythm Structure
The ribbon overlays two moving averages of ATR:
EMA (yellow) – faster, more reactive
HMA (orange) – smoother, more rhythmic
Their relationship creates the ribbon logic:
Yellow fill (EMA > HMA)
Short-term volatility is increasing faster than the longer-term rhythm
Signals active expansion and engagement
Orange fill (HMA > EMA)
Volatility is decaying or leveling off
Suggests possible exhaustion, pullback, or range
Crossover triangle markers (optional, off by default to avoid clutter) identify the moment of shift in volatility phase.
The ribbon reflects the shape of volatility over time—ideal for mapping cyclical energy shifts, transitional states, and alignment between current and average volatility.
_______________________________________________________________
📐 Strategy Application
Use the Asymmetric Turbulence Ribbon to:
- Detect volatility expansions before breakouts or directional runs
- Spot compression zones that precede structural ruptures
- Visually separate efficient moves from noisy market activity
- Confirm or fade trade setups based on underlying energy state
- Track the volatility environment across multiple timeframes using the override
_______________________________________________________________
🎯 Ideal Timeframes
Designed to function across all timeframes, but particularly powerful on intraday to daily ranges (1H to 1D)
Use the timeframe override to anchor your chart in higher-timeframe volatility context, like daily ATR behavior influencing a 1H setup.
_______________________________________________________________
🧬 Customization Tips
- Increase ATR ROC Lookback for smoother color transitions
- Extend ATR Base Avg Length for more macro-driven histogram centering
- Disable the histogram for ribbon-only rhythm view
- Use opacity and color shifts in the histogram to detect stealth energy builds
- Align ATR phases with structure or order flow tools for high-quality setups

Volatility Layered Supertrend [NLR]We’ve all used Supertrend, but do you know where to actually enter a trade? Volatility Layered Supertrend (VLS) is here to solve that! This advanced trend-following indicator builds on the classic Supertrend by not only identifying trends and their strength but also guiding you to the best trade entry points. VLS divides the main long-term trend into “Strong” and “Weak” Zones, with a clear “Trade Entry Zone” to help you time your trades with precision. With layered trends, dynamic profit targets, and volatility-adaptive bands, VLS delivers actionable signals for any market.
Why I Created VLS Over a Plain Supertrend
I built VLS to address the gaps in traditional Supertrend usage and make trade entries clearer:
Single-Line Supertrend Issues: The default Supertrend sets stop-loss levels that are too wide, making it impractical for most traders to use effectively.
Unclear Entry Points: Standard Supertrend doesn’t tell you where to enter a trade, often leaving you guessing or entering too early or late.
Multi-Line Supertrend Enhancement: Many traders use short, medium, and long Supertrends, which is helpful but can lack focus. In VLS, I include Short, Medium, and Long trends (using multipliers 1 to 3), and add multipliers 4 and 5 to track extra long-term trends—helping to avoid fakeouts that sometimes occur with multiplier 3.
My Solution: I focused on the main long-term Supertrend and split it into “Weak Zone” and “Strength Zone” to show the trend’s reliability. I also defined a “Trade Entry Zone” (starting from the Mid Point, with the first layer’s background hidden for clarity) to guide you on where to enter trades. The zones include Short, Medium, and Long Trend layers for precise entries, exits, and stop-losses.
Practical Trading: This approach provides realistic stop-loss levels, clear entry points, and a “Profit Target” line that aligns with your risk tolerance, while filtering out false signals with longer-term trends.
Key Features
Layered Trend Zones: Short, Medium, Long, and Extra Long Trend layers (up to multipliers 4 and 5) for timing entries and exits.
Strong & Weak Zones: See when the trend is reliable (Strength Zone) or needs caution (Weak Zone).
Trade Entry Zone: A dedicated zone starting from the Mid Point (first layer’s background hidden) to show the best entry points.
Dynamic Profit Targets: A “Profit Target” line that adjusts with the trend for clear goals.
Volatility-Adaptive: Uses ATR to adapt to market conditions, ensuring reliable signals.
Color-Coded: Green for uptrends, red for downtrends—simple and clear.
How It Works
VLS enhances the main long-term Supertrend by dividing it into two zones:
Weak Zone: Indicates a less reliable trend—use tighter stop-losses or wait for the price to reach the Trade Entry Zone.
Strength Zone: Signals a strong trend—ideal for entries with wider stop-losses for bigger moves.
The “Trade Entry Zone” starts at the Mid Point (last layer’s background hidden for clarity), showing you the best area to enter trades. Each zone includes Short, Medium, Long, and Extra Long Trend sublevels (up to multipliers 4 and 5) for precise trade timing and to filter out fakeouts. The “Profit Target” updates dynamically based on trend direction and volatility, giving you a clear goal.
How to Use
Spot the Trend: Green bands = buy, red bands = sell.
Check Strength: Price in Strength Zone? Trend’s reliable—trade confidently. In Weak Zone? Use tighter stops or wait.
Enter Trades: Use the “Trade Entry Zone” (from the Mid Point upward) for the best entry points.
Use Sublevels: Short, Medium, Long, and Extra Long layers in each zone help fine-tune entries and exits.
Set Targets: Follow the Profit Target line for goals—it updates automatically.
Combine Tools: Pair with RSI, MACD, or support/resistance for added confirmation.
Settings
ATR Length: Adjust the ATR period (default 10) to change sensitivity.
Up/Down Colors: Customize colors—green for up, red for down, by default.

ATRs in Days📌 ATR in Days
This script tracks how price moves in relation to ATR over multiple days, providing a powerful volatility framework for traders.
🔹 Key Features:
✅ 4 ATRs in 5 Days – Measures if a stock has moved 4x its ATR within the last 5 days, identifying extreme volatility zones.
✅ Daily ATR Calculation – Tracks average true range over time to gauge market conditions.
✅ Clear Table Display – Real-time ATR readings for quick decision-making.
✅ Intraday & Swing Trading Compatible – Works across multiple timeframes for day traders & swing traders.
📊 How to Use:
Look for stocks that exceed 4 ATRs in 5 days to spot extended moves.
Use ATR as a reversion or continuation signal depending on market structure.
🚀 Perfect for traders looking to quantify volatility & structure trades effectively!

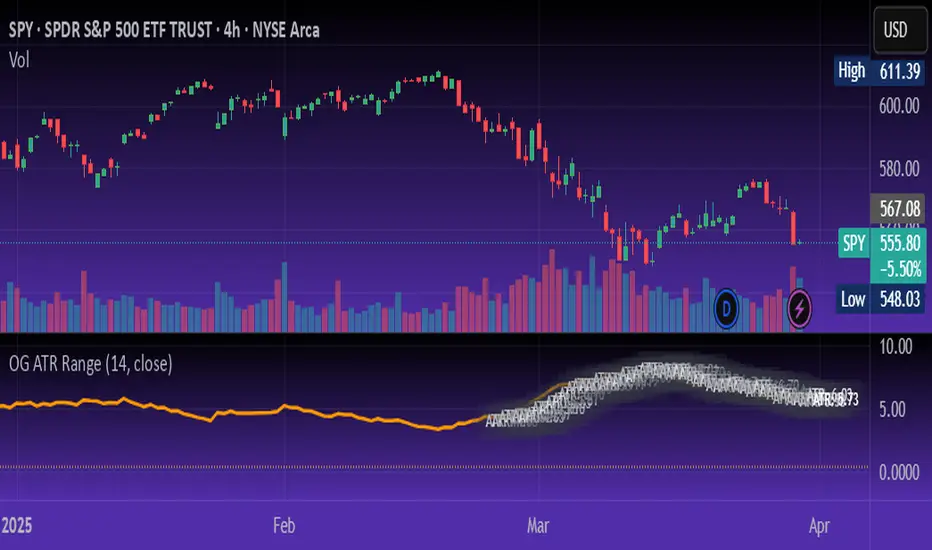
OG ATR RangeDescription:
The OG ATR Tool is a clean, visualized version of the Average True Range indicator for identifying volatility, stop-loss levels, and realistic price movement expectations.
How it works:
Calculates the average range (in points/pips) of recent candles.
Overlays ATR bands to help define breakout potential or squeeze zones.
Can be used to size trades or set dynamic stop-loss and target levels.
Best for:
Intraday traders who want to avoid unrealistic targets.
Volatility-based setups and breakout strategies.
Creating position sizing rules based on instrument volatility.
Pro Tip: Combine with your trend indicators to set sniper entries and exits that respect volatility.
ATR & PTR TableThe ATR & PTR Table Indicator displays a dynamic table that provides Average True Range (measures market volatility over 1D, 1W, and 1M timeframes), Price trading range (difference between the high and low prices over the same periods) & percentage of the typical range that has been traded. This indicator will help traders identify potential breakout zones and assess volatility across multiple timeframes.
This had been optimized to show ATR and PTR on every time frame. The (1D) represents ATR on whatever timeframe you are currently on.

Price Extreme BandsPrice Extreme Bands Description
This indicator calculates and displays Price Extreme Bands based on an Exponential Moving Average (EMA) and True Range Average True Range (TR ATR). It utilizes a custom "Super Smoother" function to smooth the bands, providing a clearer representation of potential price extremes without sacrificing accuracy.
Usage
Built for specifically for intraday timeframes, this indicator identifies short term price extremes and volatility ranges. Traders can observe when price moves towards the outer bands, suggesting strong momentum or potential overbought/oversold conditions. The filled zones highlight areas of increased volatility which can used as exit criteria for a trade, possible reversal points in ranging markets or price ranges where price momentum could slow in trending markets.
Key Features
Length Input: Controls the length of the EMA and TR ATR calculations.
Multiplier Inputs: Uses two fixed multipliers (1.71 and 2.50) to create bands.
Super Smoother: Applies a custom smoothing function to the bands for reduced noise.
Fill Zones: Fills the areas between the inner and outer bands to highlight potential volatility ranges.
Calculation:
1. EMA (Basis): Calculates the Exponential Moving Average of the selected source.
2. TR ATR: Calculates the True Range and then smoothes it using RMA (Rolling Moving Average).
3. Bands: Calculates upper and lower bands using the EMA and ATR, with multipliers of 1.71 and 2.50.
4. Super Smoother: Applies a smoothing function to the calculated bands.
Visuals:
Basis Line: Plots the EMA (basis) (invisible by default).
Inner Bands (1.71 Multiplier): Plots the smoothed bands with a distinct color (e.g., orange) (invisible by default).
Outer Bands (2.50 Multiplier): Plots the smoothed bands with a different color (e.g., purple) (invisible by default).
Fill Zones: Fills the region between the inner and outer upper bands and the inner and outer lower bands with a translucent color (e.g. light blue).
// Note: The plot lines are invisible by default. To view the basis, upper and lower band lines, adjust the visibility settings in the indicator's settings.
Uniqueness: Ready of the box. Code and parameters built specifically for 1m to 15m timeframes provides users with an indicator to easily identify price extremes. The use of TR ATR and addition of the Super Smoother calculation create a easier visualization and implementation compared to existing price band options.
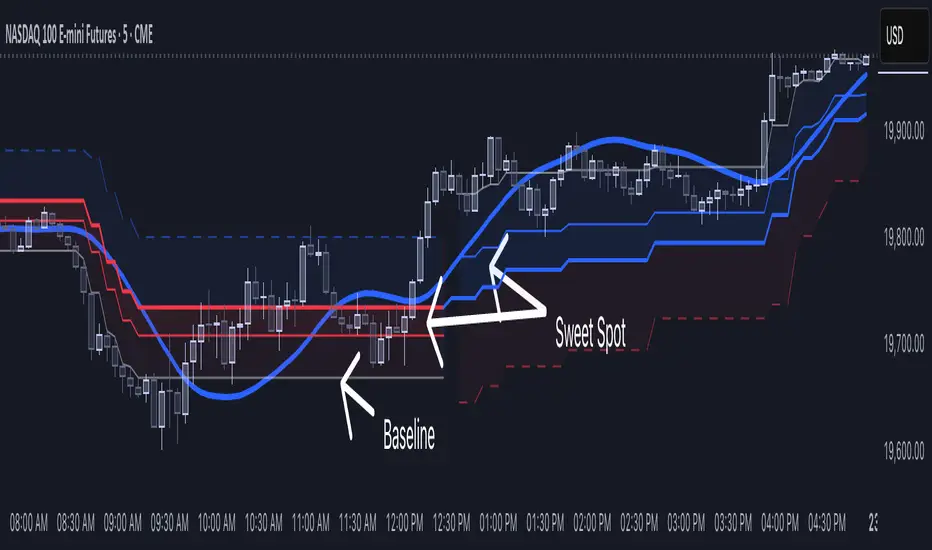
[NLR] - SweetSpot ZonesThe Sweet Spot Zone helps you find the best spots to enter a trade, inspired by the " Follow Line Indicator " by Dreadblitz (big thanks to him!). It draws a colored zone on your chart to show ideal entry points, with a Base Point to keep you on track.
What It Does
Blue Zone: Uptrend—buy when the price dips into the zone.
Red Zone: Downtrend—sell or short when the price climbs into the zone.
Base Point: A gray line showing the key level the zone is built on.
How to Use It
Look for the colored zone:
- Blue: Buy if the price dips into the zone but stays above the Base Point.
- Red: Sell/short if the price climbs into the zone but stays below the Base Point.
Important: Avoid entering trade beyond base point - you might see low returns and face big drawdowns.
Confirm with other signals (like RSI/MACD) before entering.
Settings
ATR Length (10): How far back it looks to calculate price movement.
ATR Multiplier (2.5): How wide the zone is.
Error Margin (5.0): Keeps the zone steady during small price wiggles.
Uptrend/Downtrend Colors: Change the zone colors if you’d like!
Credits
Inspired by the "Follow Line Indicator" by Dreadblitz—check out his work for more great ideas!
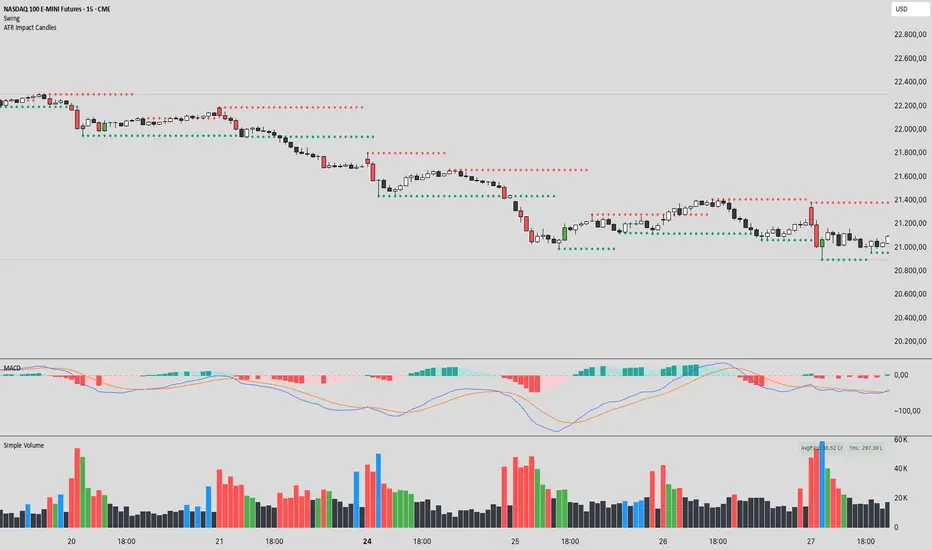
ATR Impact CandlesATR Impact Candles: Simplify Your Trading with Pure Price Action
You don’t need dozens of cluttered indicators to catch what really matters. With ATR Impact Candles, you get a powerful, single-tool solution that cuts through the noise by focusing on what truly drives the market: price action and volatility. This indicator highlights only those candlesticks that pack a punch—showing you when the market’s range is exceptionally strong relative to its recent behavior. Whether you’re a scalper or a swing trader, ATR Impact Candles empowers you to time your entries and exits with confidence, letting you trade based on real market momentum.
⸻
Indicator Overview
The indicator is designed for TradingView and is implemented in Pine Script (version 5). Its primary purpose is to highlight specific candles that meet a defined volatility condition based on the Average True Range (ATR). Instead of modifying every candle’s appearance, the indicator only changes the color of those “signal” candles that exceed a user-defined multiple of the ATR. The rest of the candles remain in their traditional black and white appearance—preserving the classic candlestick chart look.
⸻
Key Features
1. ATR-Based Signal Identification:
• ATR Calculation:
The indicator calculates the ATR using a configurable lookback period (default is 14 periods). The ATR is a common volatility measure that reflects the average range of price movement.
• Threshold Condition:
A candle is flagged as a signal if its range (high minus low) meets or exceeds a specified multiple (the “ATR Factor”) of the ATR. By default, this factor is set to 2, meaning any candle whose range is at least twice the ATR is considered significant.
2. Dynamic Candle Coloring:
• Signal Candles:
• When a candle meets the ATR threshold condition:
• Up Candles: are colored green.
• Down Candles: are colored red.
• Non-Signal Candles:
• Candles that do not meet the threshold condition retain their classic appearance:
• Up candles are white.
• Down candles are black.
3. User Configurability:
• ATR Period:
Traders can adjust the ATR period to tailor the volatility measure to different markets or timeframes.
• ATR Factor:
The multiple of the ATR that defines a signal candle is also configurable, giving flexibility to experiment with different thresholds for what constitutes “significant” price movement.
• Overlay Display:
The indicator runs in overlay mode on the chart, meaning it directly affects the appearance of the candlestick bars without interfering with other chart elements.
4. Additional Visual Aid:
• Threshold Line Plot:
The script optionally plots a line representing the ATR multiplied by the chosen factor. This line serves as a visual benchmark on the chart, allowing traders to see at what level the ATR threshold lies relative to the price action.
⸻
How It Works
1. ATR Calculation:
The indicator first calculates the Average True Range (ATR) for the defined period. This value is updated for each new candle.
2. Range Comparison:
For each candle, the indicator calculates the range (high - low) and compares it to the threshold, which is the ATR multiplied by the user-defined factor.
3. Conditional Coloring:
• If the Candle’s Range ≥ (ATR * Factor):
• The candle is marked as a “signal candle.”
• Its color is set to green if it is an up candle (close is greater than or equal to open) or red if it is a down candle.
• Otherwise:
• The candle retains its classic look, with up candles in white and down candles in black.
4. Chart Display:
By applying these rules to every candle, the indicator visually emphasizes those moments when the market shows unusually large price movements relative to its recent average volatility. This helps traders quickly spot potential breakouts or reversals.
⸻
Practical Applications
• Volatility Breakouts:
Identify candles that may signal the start of a breakout or strong reversal.
• Risk Management:
Adjust stop-loss levels or position sizes when unusually volatile candles are detected.
• Signal Confirmation:
Combine with other technical indicators or chart patterns to reinforce entry or exit decisions.
⸻
ATR Impact Candles is your essential, no-nonsense tool for filtering out market noise and focusing solely on significant price action. Simplify your trading decisions and harness the power of volatility with one clear, effective indicator.
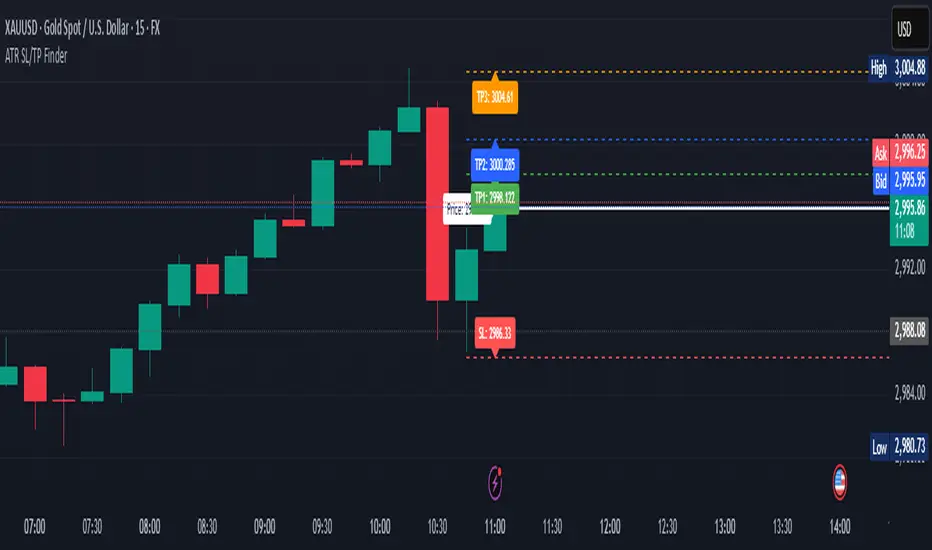
ATR Stop Loss & 3 TP FinderATR Stop Loss & 3 TP Finder - By SeehraSingh
This indicator is designed to help traders automate Stop Loss (SL) and Take Profit (TP) placement based on the Average True Range (ATR). It dynamically calculates:
Stop Loss (SL): Set based on a user-defined ATR multiplier.
Three Take Profit (TP) levels: Configurable ATR multipliers for TP1, TP2, and TP3.
Customizable Price Sources: Allows traders to choose different price sources (Open, High, Low, Close, HL2, HLC3, OHLC4, HLCC4) for both SL and TP calculations.
Visual Representation: Plots dashed lines for Entry, SL, TP1, TP2, and TP3.
Table Display: Provides an easy-to-read table at the bottom showing SL, TP1, TP2, and TP3 values.
How It Works:
Select ATR length and smoothing type (RMA, SMA, EMA, WMA).
Set ATR multipliers for SL and TP levels.
Choose the price source for SL and TP calculations.
The indicator automatically plots entry, SL, and three TP levels on the chart.
Ideal For:
Traders who use ATR-based dynamic Stop Loss and Take Profit strategies.
Those who want to avoid fixed SL/TP placements and prefer volatility-based risk management.
Scalpers, Swing Traders, and Position Traders looking for automated SL/TP visualization.
Disclaimer
⚠️ Trading involves risk. This indicator is for educational purposes only and should not be considered financial advice. Always conduct your own analysis before entering any trade. The author is not responsible for any financial losses incurred while using this tool. Past performance does not guarantee future results.
Higher Timeframe Support/ResistanceMulti-Timeframe Support/Resistance Indicator
This TradingView indicator helps you monitor important support and resistance levels based on the previous candle’s high, low, and close from a higher timeframe. By default, it uses a daily timeframe, but you can adjust this to any timeframe you want.
Key Features:
- Previous Candle High (PCH) and Previous Candle Low (PCL):
These levels are plotted on your chart (if enabled) and can act as potential support and
resistance zones. You can toggle the visibility of these levels.
- Pivot, Resistance (R1), and Support (S1):
The script calculates Pivot, R1 (Resistance), and S1 (Support) levels based on the previous
candle's price action from the selected higher timeframe.
These levels are displayed on your chart and can be used to identify potential breakout or
reversal points.
- Alert Feature:
Alerts are triggered when the price approaches any of these key levels (PCH, PCL, Pivot, R1,
or S1) within a specified threshold (e.g., 0.5%).
This helps traders react quickly to potential price movements near critical levels.
- Visual Representation:
The script visually fills the areas between Pivot and R1 (Resistance-Pivot Zone) and Pivot and
S1 (Support-Pivot Zone) with color for easy identification of key price zones.

Combined ATR + VolumeOverview
The Combined ATR + Volume indicator (C-ATR+Vol) is designed to measure both price volatility and market participation by merging the Average True Range (ATR) and trading volume into a single normalized value. This provides traders with a more comprehensive tool than ATR alone, as it highlights not only how much price is moving, but also whether there is sufficient volume behind those moves.
Originality & Utility
Two Key Components
ATR (Average True Range): Measures price volatility by analyzing the range (high–low) over a specified period. A higher ATR often indicates larger price swings.
Volume: Reflects how actively traders are participating in the market. High volume typically indicates strong buying or selling interest.
Normalized Combination
Both ATR and volume are independently normalized to a 0–100 range.
The final output (C-ATR+Vol) is the average of these two normalized values. This makes it easy to see when both volatility and market participation are relatively high.
Practical Use
Above 80: Signifies elevated volatility and strong volume. Markets may experience significant moves.
Around 50–80: Indicates moderate activity. Price swings and volume are neither extreme nor minimal.
Below 50: Suggests relatively low volatility and lower participation. The market may be ranging or consolidating.
This combined approach can help filter out situations where volatility is high but volume is absent—or vice versa—providing a more reliable context for potential breakouts or trend continuations.
Indicator Logic
ATR Calculation
Uses Pine Script’s built-in ta.tr(true) function to measure true range, then smooths it with a user-selected method (RMA, SMA, EMA, or WMA).
Key Input: ATR Length (default 14).
Volume Calculation
Smooths the built-in volume variable using the same selectable smoothing methods.
Key Input: Volume Length (default 14).
Normalization
For each metric (ATR and Volume), the script finds the lowest and highest values over the lookback period and converts them into a 0–100 scale:
normalized value
=(current value−min)(max−min)×100
normalized value= (max−min)(current value−min) ×100
Combined Score
The final plot is the average of Normalized ATR and Normalized Volume. This single value simplifies the process of identifying high-volatility, high-volume conditions.
How to Use
Setup
Add the indicator to your chart.
Adjust ATR Length, Volume Length, and Smoothing to match your preferred time horizon or chart style.
Interpretation
High Values (above 80): The market is experiencing significant price movement with high participation. Potential for strong trends or breakouts.
Moderate Range (50–80): Conditions are active but not extreme. Trend setups may be forming.
Low Values (below 50): Indicates quieter markets with reduced liquidity. Expect ranging or less decisive moves.
Strategy Integration
Use C-ATR+Vol alongside other trend or momentum indicators (e.g., Moving Averages, RSI, MACD) to confirm potential entries/exits.
Combine it with support/resistance or price action analysis for a broader market view.
Important Notes
This script is open-source and intended as a community contribution.
No Future Guarantee: Past market behavior does not guarantee future results. Always use proper risk management and validate signals with additional tools.
The indicator’s performance may vary depending on timeframes, asset classes, and market conditions.
Adjust inputs as needed to suit different instruments or personal trading styles.
By adhering to TradingView’s publishing rules, this script is provided with sufficient detail on what it does, how it’s unique, and how traders can use it. Feel free to customize the settings and experiment with other technical indicators to develop a trading methodology that fits your objectives.
🔹 Combined ATR + Volume (C-ATR+Vol) 지표 설명
이 인디케이터는 ATR(Average True Range)와 거래량(Volume)을 결합하여 시장의 변동성과 유동성을 동시에 측정하는 지표입니다.
ATR은 가격 변동성의 크기를 나타내며, 거래량은 시장 참여자의 활동 수준을 반영합니다. 보통 높은 ATR은 가격 변동이 크다는 의미이고, 높은 거래량은 시장에서 적극적인 거래가 이루어지고 있음을 나타냅니다.
이 두 지표를 각각 0~100 범위로 정규화한 후, 평균을 구하여 "Combined ATR + Volume (C-ATR+Vol)" 값을 계산합니다.
이를 통해 단순한 가격 변동성뿐만 아니라 거래량까지 고려하여, 더욱 신뢰성 있는 변동성 판단을 할 수 있도록 도와줍니다.
📌 핵심 개념
1️⃣ ATR (Average True Range)란?
시장의 변동성을 측정하는 지표로, 일정 기간 동안의 고점-저점 변동폭을 기반으로 계산됩니다.
ATR이 높을수록 가격 변동이 크며, 낮을수록 횡보장이 지속될 가능성이 큽니다.
하지만 ATR은 방향성을 제공하지 않으며, 단순히 변동성의 크기만을 나타냅니다.
2️⃣ 거래량 (Volume)의 역할
거래량은 시장 참여자의 관심과 유동성을 반영하는 중요한 요소입니다.
높은 거래량은 강한 매수 또는 매도세가 존재함을 의미하며, 낮은 거래량은 시장 참여가 적거나 관심이 줄어들었음을 나타냅니다.
3️⃣ ATR + 거래량의 결합 (C-ATR+Vol)
단순한 ATR 값만으로는 변동성이 커도 거래량이 부족할 수 있으며, 반대로 거래량이 많아도 변동성이 낮을 수 있습니다.
이를 해결하기 위해 ATR과 거래량을 각각 0~100으로 정규화하여 균형 잡힌 변동성 지표를 만들었습니다.
두 지표의 평균값을 계산하여, 가격 변동과 거래량이 동시에 높은지를 측정할 수 있도록 설계되었습니다.
📊 사용법 및 해석
80 이상 → 강한 변동성 구간
가격 변동성이 크고 거래량도 높은 상태
강한 추세가 진행 중이거나 큰 변동이 일어날 가능성이 큼
상승/하락 방향성을 확인한 후 트렌드를 따라가는 전략이 유리
50~80 구간 → 보통 수준의 변동성
가격 움직임이 일정하며, 거래량도 적절한 수준
점진적인 추세 형성이 이루어질 가능성이 있음
시장이 점진적으로 상승 혹은 하락할 가능성이 크므로, 보조지표를 활용하여 매매 타이밍을 결정하는 것이 중요
50 이하 → 낮은 변동성 및 유동성 부족
가격 변동이 적고, 거래량도 낮은 상태
시장이 횡보하거나 조정 기간에 들어갈 가능성이 큼
박스권 매매(지지/저항 활용) 또는 돌파 전략을 고려할 수 있음
💡 활용 방법 및 전략
✅ 1. 트렌드 판단 보조지표로 활용
단독으로 사용하는 것보다는 RSI, MACD, 이동평균선(MA) 등의 지표와 함께 활용하는 것이 효과적입니다.
예를 들어, MACD가 상승 신호를 주고, C-ATR+Vol 값이 80을 초과하면 강한 상승 추세로 해석할 수 있습니다.
✅ 2. 변동성 돌파 전략에 활용
C-ATR+Vol이 80 이상인 구간에서 가격이 특정 저항선을 돌파한다면, 강한 추세의 시작을 의미할 수 있습니다.
반대로, C-ATR+Vol이 50 이하에서 가격이 저항선에 가까워지면 돌파 가능성이 낮아질 수 있습니다.
✅ 3. 시장 참여도와 변동성 확인
단순히 ATR만 높아서는 신뢰하기 어려운 경우가 많습니다. 예를 들어, 급등 후 거래량이 급감하면 상승 지속 가능성이 낮아질 수도 있습니다.
하지만 C-ATR+Vol을 사용하면 거래량이 함께 증가하는지를 확인하여 보다 신뢰할 수 있는 분석이 가능합니다.
🚀 결론
🔹 Combined ATR + Volume (C-ATR+Vol) 인디케이터는 단순한 ATR이 아니라 거래량까지 고려하여 변동성을 측정하는 강력한 도구입니다.
🔹 시장이 큰 움직임을 보일 가능성이 높은 구간을 찾는 데 유용하며, 80 이상일 경우 강한 변동성이 있음을 나타냅니다.
🔹 단독으로 사용하기보다는 보조지표와 함께 활용하여, 트렌드 분석 및 돌파 전략 등에 효과적으로 적용할 수 있습니다.
📌 주의사항
변동성이 크다고 해서 반드시 가격이 급등/급락한다는 보장은 없습니다.
특정한 매매 전략 없이 단순히 이 지표만 보고 매수/매도를 결정하는 것은 위험할 수 있습니다.
시장 상황에 따라 변동성의 의미가 다르게 작용할 수 있으므로, 반드시 다른 보조지표와 함께 활용하는 것이 중요합니다.
🔥 이 지표를 활용하여 시장의 변동성과 거래량을 보다 효과적으로 분석해보세요! 🚀

Supertrend with RSI FilterThis indicator is an enhanced version of the classic Supertrend, incorporating an RSI (Relative Strength Index) filter to refine trend signals. Here is a detailed explanation of its functionality and key advantages over the traditional Supertrend.
1. Indicator Functionality
The indicator uses ATR (Average True Range) to calculate the Supertrend line, just like the classic version. However, it introduces an additional condition based on RSI to strengthen or weaken the Supertrend color based on market momentum.
2. Interpretation of Colors
The indicator displays the Supertrend line with dynamic colors based on trend direction and RSI strength:
- Uptrend (Supertrend in buy mode):
- Dark green (Teal): RSI above the defined threshold (default 50) → Strong bullish confirmation.
- Light gray: RSI below the threshold → Indicates a weaker uptrend or lack of confirmation.
- Downtrend (Supertrend in sell mode):
- Dark red: RSI below the threshold → Strong bearish confirmation.
- Light gray: RSI above the threshold → Indicates a weaker downtrend or lack of confirmation.
The opacity of the color dynamically adjusts based on how far RSI is from its threshold. The greater the difference, the more vivid the color, signaling a stronger trend.
3. Key Advantages Over the Classic Supertrend
- Filters out false signals: The RSI integration helps reduce false signals by only validating trends when RSI aligns with the Supertrend direction.
- Weakens uncertain signals: When RSI is close to its threshold, the color becomes more transparent, alerting traders to a less reliable trend.
- Classic mode available: The 'Use Classic Supertrend' option allows switching to a standard Supertrend display (fixed red/green) without the RSI effect.
4. Customizable Parameters
- ATR Length & ATR Factor: Define the sensitivity of the Supertrend.
- RSI Period & RSI Threshold: Allow refining the RSI filter based on market volatility.
- Classic mode: Enables/disables the RSI filtering to revert to the original Supertrend.
This indicator is especially valuable for traders looking to refine their trend signals based on market momentum measured by RSI.
This indicator is for informational purposes only and should not be considered financial advice. Trading involves risks, and past performance does not guarantee future results. Always conduct your own analysis before making any trading decisions.

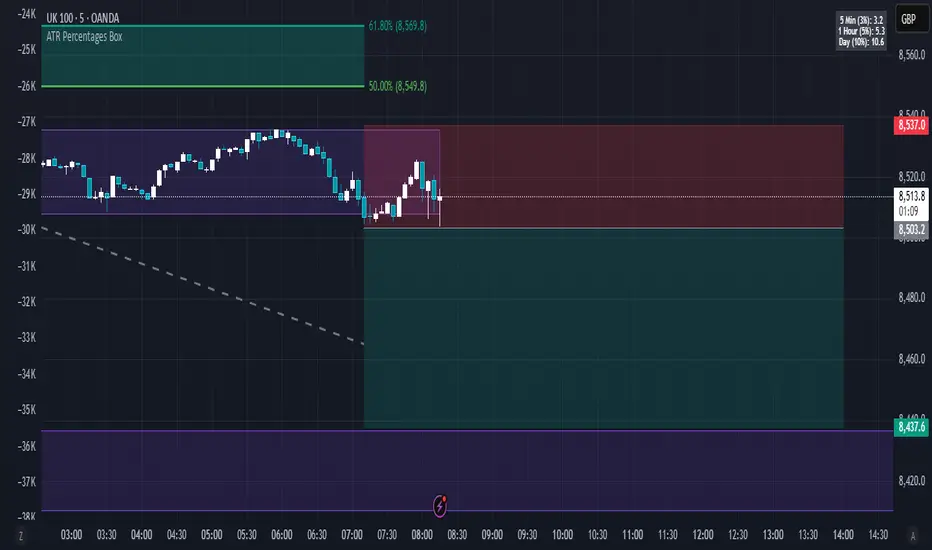
ATR Percentages BoxThis custom indicator provides a quick visual reference for volatility-based price ranges, directly on your TradingView charts. It calculates and displays three ranges derived from the Daily Average True Range (ATR) with a standard 14-period setting:
5 Min (3% ATR): Ideal for very short-term scalping and quick intraday moves.
1 Hour (5% ATR): Useful for hourly setups, short-term trades, and intraday volatility assessment.
Day (10% ATR): Perfect for daily volatility context, swing trades, or placing stops and targets.
The ranges are clearly shown in a compact box at the top-right corner, providing traders immediate insights into realistic price movements, helping to optimise entries, stops, and profit targets efficiently.
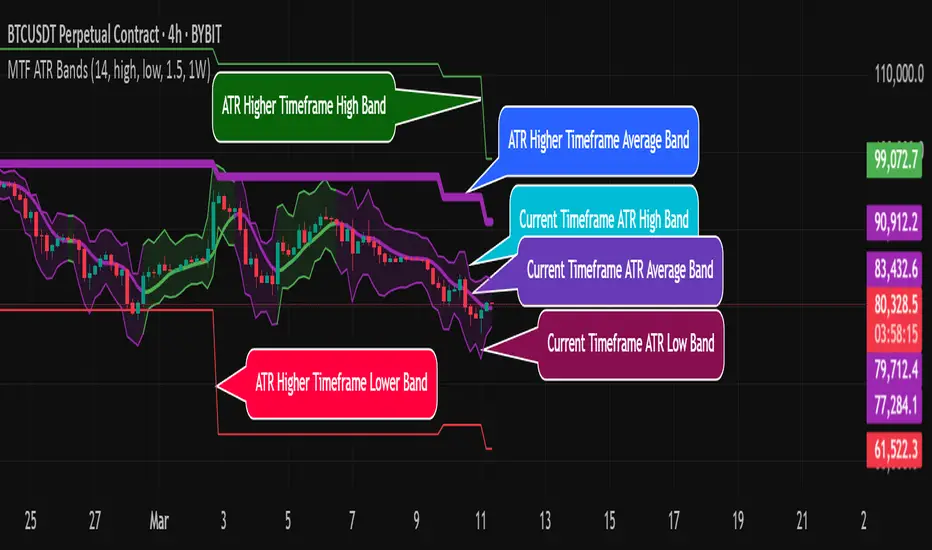
MTF ATR BandsA simple but effective MTF ATR bands indicator.
The script calculate and display ATR bands low and high of the current timeframe using high, low inputs and an RMA moving average, adding to it ATR of the period multiplied with the user multiplier, default is set to 1.5.
Than is calculated a smoothed average of the range and the color of it based on its slope, same color is used to fill the atr bands.
Than the higher timeframe bands are calculated and displayed on the chart.
How can be used ?
The higher timeframe average and bands can give you long term direction of the trend and the current timeframes moving average and filling short term trend, for example using the 15 min chart with a 4h HTF bands, or an 1h with a daily, or a daily with an weekly or weekly with bi-monthly atr bands.
Also can be used as a stop loss indicator.
Hope you will like it, any question send me a PM.
Ehlers Instantaneous Trendline ATR LevelsOverview
This sophisticated technical analysis tool merges John Ehlers' cutting-edge Instantaneous Trendline methodology with a dynamic ATR-based bands system. The indicator is designed to provide traders with a comprehensive view of market trends while accounting for volatility, making it suitable for both trending and ranging markets. Works on all timeframes and chart types.
Key Features in Detail
1. Ehlers Instantaneous Trendline Implementation
- Advanced algorithm that reduces lag typically associated with moving averages
- Built-in volatility filtering system to minimize false signals
- Adaptive to market conditions through dynamic calculations
- Real-time trend direction identification
2. Multi-layered ATR Band System
- Hierarchical band structure with 18 total bands (9 upper, 9 lower)
- Color-coded visualization system:
Upper bands: Red gradient (darker = further from trendline)
Lower bands: Green gradient (darker = further from trendline)
Central trendline: Yellow for optimal visibility
- Customizable multipliers for each band level
- Independent visibility controls for each band
Configuration Options
Trendline Settings:
- Lower values: More responsive to price changes and faster reacting to break in ATR filter
- Higher values: Smoother trendline with less noise and slower reacting to break in ATR filter
ATR Configuration:
Period: Customizable from 1 to any positive integer
- Longer periods: More stable volatility measurement
- Shorter periods: More reactive to recent volatility changes
Filter Multiplier: Fine-tune volatility filtering
- Higher values: More filtered signals leading to less shift in bands
- Lower values: More sensitive to price movements leading to more band shifts
Practical Applications
1. Trend Analysis
Use the central trendline for primary trend direction
Monitor band crossovers for trend strength confirmation
Track price position relative to bands for trend context
2. Volatility Assessment
Band spacing indicates current market volatility
Width between bands helps identify consolidation vs. expansion phases
Price Extremes
3. Support and Resistance
Each band acts as a dynamic support/resistance level
Multiple timeframe analysis possible adjusting for different timeframe ATR

ReadyFor401ks Just Tell Me When!ReadyFor401ks Just Tell Me When!
LET ME START BY SAYING. NO INDICATOR WILL HELP YOU NAIL THE PERFECT ENTRY/EXIT ON A TRADE. YOU SHOULD ALWAYS EDUCATE YOURSELF AND HAVE A BASIC UNDERSTANDING OF INVESTING, TRADING, CHART ANALYSIS, AND THE RISKS INVOLVED WITH. THAT BEING SAID, WITH THE RIGHT ADJUSTMENTS, IT'S PRETTY D*$N CLOSE TO PERFECTION!
This indicator is designed to help traders identify t rend direction, continuation signals, and potential exits based on a dynamic blend of moving averages, ATR bands, and price action filters. Whether you’re an intraday trader scalping the 5-minute chart or a swing trader analyzing the weekly timeframe for LEAPS , this tool provides a clear, rule-based system to help guide your trading decisions.
⸻
Key Features & Benefits
🔹 Customizable Trend Power (Baseline) Calculation
• Choose from JMA, EMA, HMA, TEMA, DEMA, SMA, VAMA, and WMA for defining your baseline trend direction.
• The baseline helps confirm whether the market is in a bullish or bearish phase.
🔹 ATR-Based Trend Continuation & Volatility Measurement
• ATR bands dynamically adjust to market conditions, helping you spot breakouts and fakeouts.
• The indicator detects when price violates ATR range , which often signals impulse moves.
🔹 Clear Entry & Exit Signals
• Uses a Continuation MA (SSL2) to confirm trends.
• Includes a separate Exit MA (SSL3) that provides crossover signals to indicate when to exit trades or reverse positions .
• Plots trend continuation circles when ATR conditions align with trend signals.
🔹 Keltner Channel Baseline for Market Structure
• A modified Keltner Channel is integrated into the baseline to help filter out choppy conditions .
• If price remains inside the baseline, the market is in consolidation , while breakouts beyond the bands indicate strong trends .
🔹 Adaptive Color Coding for Market Conditions
• Bars change color based on momentum, making trend direction easy to read.
• Green = Bullish Trend, Red = Bearish Trend, Gray = Neutral/Chop.
🔹 Flexible Alerts for Trade Management
• Get real-time alerts when the Exit MA crosses price , helping you l ock in profits or switch directions .
⸻
How to Use This Indicator for Different Trading Styles
🟢 For Intraday Trading (5-Minute Chart Setup)
• Faster MA settings help react quickly to momentum shifts.
• Ideal for scalping breakouts, trend continuation setups, and intraday reversals.
• Watch for ATR violations and price interacting with the baseline/Keltner Channel for entries.
--------------------------------
My Settings for Intraday Trading on 5min Chart
ATR Period: 15
ATR Multi: 1
ATR Smoothing: WMA
Trend Power based off of: JMA
Trend Power Period: 30
Continuation Type: JMA
Continuation Length: 20
Calculate Exit of what MA?: HMA
Calculate Exit off what Period? 30
Source of Exit Calculation: close
JMA Phase *APPLIES TO JMA ONLY: 3
JMA Power *APPLIES TO JMA ONLY: 3
Volatility Lookback Period *APPLIES TO VAMA ONLY 30
Use True Range for Channel? Checked
Base Channel Multiplier: 0.4
ATR Continuation Criteria: 1.1
----------------------------------
🔵 For Swing Trading & LEAPS (Weekly Chart Setup - Default Settings)
• Slower MAs provide a broader view of trend structure.
• Helps capture multi-week trend shifts and confirm entry points for longer-term trades.
• Weekly ATR bands highlight when stocks are entering overextended conditions.
💡 Example:
Let’s say you’re looking at TSLA on a Weekly Chart using the default settings. You notice that price crosses above the continuation MA (SSL2) while remaining above the baseline (trend power MA). The bar turns green, and price breaks above ATR resistance, signaling a strong bullish continuation. This could be a great opportunity to enter a long-term swing trade or LEAPS options position.
On the flip side, if price reverses below the Exit MA (SSL3) and turns red while breaking the lower ATR band, it might signal a good time to exit longs or enter a short trade.
⸻
Final Thoughts
The ReadyFor401ks Just Tell Me When! indicator is an all-in-one trading system that simplifies trend-following, volatility measurement, and trade management. By integrating multiple moving average types, ATR filters, and clear visual cues, it allows traders to stay disciplined and remove emotions from their trading decisions.
✅ Perfect for scalpers, day traders, and swing traders alike!
🔔 Set up alerts for automated trade signals and never miss a key move!
💬 If you find this indicator useful, leave a comment and share how you use it in your trading! 🚀

Range%This indicator displays the range of each candle i.e. High minus Low as a percentage of the previous closing price. It does not account for gaps, making it particularly useful for intraday trading. By tracking the volatility cycle of candles, this indicator helps identify periods of increased or decreased market volatility, allowing traders to pinpoint the best days to execute trades.
If the Range% is below low line candles will turn White and If Range% is above the High Line Candles will turn Red.

ATR Multiples from LOD/HODAn indicator that plots ATR (Average True Range) multiples from the current Low of Day (LOD) and High of Day (HOD). The indicator should:
Calculate the Low of Day (LOD) and High of Day (HOD) dynamically for the current trading session.
Use the ATR (Average True Range), with a customizable length, as the base measurement.
Plot multiple levels above the LOD and below the HOD, based on user-defined ATR multiples (e.g., 1x ATR, 2x ATR, 3x ATR, etc.).
Customizable Inputs:
ATR Length
ATR Multiples (Up to 5 levels)
Line color and style for each level
Display the ATR multiples on the chart as horizontal lines extending throughout the trading session.

FVG | iSolani
Unveiling Market Inefficiencies with Precision
In fast-moving markets, spotting hidden opportunities often hinges on identifying imbalances between price and value. The FVG | iSolani indicator revolutionises this process by detecting Fair Value Gaps (FVGs) —zones where price action skips over "fair" valuation levels, creating potential retracement targets. Combining advanced filtering, dynamic visualisation, and automated management, this tool empowers traders to pinpoint high-probability setups with unprecedented clarity.
Core Methodology
The indicator employs a multi-layered approach to identify FVGs:
Three-Bar Gap Analysis: Bullish FVGs form when the current low exceeds the high of two bars prior, while bearish FVGs occur when the current high stays below the low of two bars back.
Volatility-Adjusted Filtering: Gaps are measured against a 100-bar standard deviation to exclude insignificant price jumps.
Volume Confirmation: Only gaps accompanied by above-average volume (relative to a 1-bar SMA) are validated, filtering out low-conviction moves.
Auto-Invalidation System: Continuously monitors price action to remove FVG zones once price closes within their range, maintaining chart cleanliness.
Breaking New Ground
This tool introduces three paradigm-shifting innovations:
Volume-Weighted Significance: Unlike traditional FVG detectors, it ties gap validity to volume spikes, emphasising institutional activity.
Adaptive Zone Management: Boxes automatically extend rightward (when enabled) and self-destruct when invalidated, eliminating manual cleanup.
Smart Color Encoding: Offers both monochrome (for multi-timeframe analysis) and standard bull/bear color schemes, with customisable transparency.
Engine Under the Hood
The script operates through four key processes:
Gap Detection: Scans every new bar for three-candle patterns meeting FVG criteria.
Statistical Filtering: Applies user-defined threshold (default: 1σ) to separate meaningful gaps from market noise.
Box Rendering: Draws semi-transparent zones between gap boundaries using TradingView's box objects, styled according to user preferences.
Array-Based Memory: Stores all active FVGs in arrays, enabling real-time validation checks against current price action.
Standard Configuration
Optimised default settings balance visibility and functionality:
Filter: 1.0 (1 standard deviation threshold)
Colors: "Mono" mode (gray boxes) with 90% transparency
Text Labels: Enabled in medium gray
Extension: Gaps extend indefinitely rightward
Borders: Dotted lines with visible outlines
Through its fusion of quantitative rigor and visual adaptability, the FVG | iSolani transforms raw price data into actionable intelligence. By focusing on volume-confirmed gaps and automating zone management, it cuts through market chaos to reveal structurally significant levels—a must-have for traders navigating breakouts, reversals, or order-flow analysis.

SuperTrend + Relative Volume (Kernel Optimized)Introducing our new KDE Optimized Supertrend + Relative Volume Indicator!
This innovative indicator combines the power of the Supertrend indicator along with Relative Volume. It utilizes the Kernel Density Estimation (KDE) to estimate the probability of a candlestick marking a significant trend break or reversal.
❓How to Interpret the KDE %:
The KDE % is a crucial metric that reflects the likelihood that the current candlestick represents a true break in the SuperTrend line, supported by an increase in relative volume. It estimates the probability of a trend shift or continuation based on historical SuperTrend breaks and volume patterns:
Low KDE %: A lower probability that the current break is significant. Price action is less likely to reverse, and the trend may continue.
Moderate KDE - High KDE %: An increased possibility that a trend reversal or consolidation could occur. Traders should start watching for confirmation signals.
📌How Does It Work?
The SuperTrend indicator uses the Average True Range (ATR) to determine the direction of the trend and identifies when the price crosses the SuperTrend line, signaling a potential trend reversal. Here's how the KDE Optimized SuperTrend Indicator works:
SuperTrend Calculation: The SuperTrend indicator is calculated, and when the price breaks above (bullish) or below (bearish) the SuperTrend line, it is logged as a significant event.
Relative Volume: For each break in the SuperTrend line, we calculate the relative volume (current volume vs. the average volume over a defined period). High relative volume can suggest stronger confirmation of the trend break.
KDE Array Calculation: KDE is applied to the break points and relative volume data:
Define the KDE options: Bandwidth, Number of Steps, and Array Range (Array Max - Array Min).
Create a density range array using the defined number of steps, corresponding to potential break points.
Apply a Gaussian kernel function to the break points and volume data to estimate the likelihood of the trend break being significant.
KDE Value and Signal Generation: The KDE array is updated as each break occurs. The KDE % is calculated for the breakout candlestick, representing the likelihood of the trend break being significant. If the KDE value exceeds the defined activation threshold, a darker bullish or bearish arrow is plotted after bar confirmation. If the KDE value falls below the threshold, a more transparent arrow is drawn, indicating a possible but lower probability break.
⚙️Settings:
SuperTrend Settings:
ATR Length: The period over which the Average True Range (ATR) is calculated.
Multiplier: The multiplier applied to the ATR to determine the SuperTrend threshold.
KDE Settings:
Bandwidth: Determines the smoothness of the KDE function and the width of the influence of each break point.
Number of Bins (Steps): Defines the precision of the KDE algorithm, with higher values offering more detailed calculations.
KDE Threshold %: The level at which relative volume is considered significant for confirming a break.
Relative Volume Length: The number of historic candles used in calculating KDE %
