Vishall BTST- final - option 1.2Reverse of X, Z from - Vishall BTST- final - option 1.1
X = Spot Price @ Normal - Spot Price @HA
Z = Spot Future@ Normal - Spot Future Price @ HA
Băng tần và kênh

HPDR Bands with projectionHPDR: Historical Price Delta Range
What is it? The HPDR indicator measures how much an asset’s price typically changes over a specific timeframe. It looks at historical price movements ("deltas") and organizes them into percentiles. These are then plotted on your chart as a median line surrounded by statistical bands.
This tool helps you understand an asset’s unique character and its typical price deviations.
Because the median is in this context a statistically relative stable value(if you add 7 values to 1000 it doesn't change much), it allows for high-probability projections of the future median.
For a clearer understanding of the indicator's logic, try setting the Range to 7 and the Offset to -7.
The 50% percentile Band signifies that in 50% of all bars, the price remained within this statistical range.

Professional 3SD Institutional Rejection
This indicator identifies institutional "liquidity grab" and "momentum exhaustion" zones using the statistical extremes of 3 Standard Deviations (3SD) on Bollinger Bands. Unlike standard strategies, it doesn't just look for band touches; it confirms price "wicking" outside the 3SD and closing back inside the 2SD band (rejection), while ensuring the Money Flow Index (MFI) shows signs of exhaustion. It is highly effective on 1H, 4H, and Daily timeframes for mean-reversion setups targeting the median line.

Solid Dynamic Corridors[AkmanBey]
Solid Dynamic Corridors: Technical Overview
The Solid Dynamic Corridors indicator is a sophisticated, multi-layered trend-following and volatility-channel system. Unlike standard indicators, it combines RSI-derived price projections, ATR-based volatility expansion, and a 20-level support/resistance matrix to identify high-probability trend zones.
1. RSI-Based Price Projection
The foundation of the indicator starts with an inverse calculation of RSI levels. By setting specific overbought (51) and oversold (49) thresholds, the script projects these momentum levels directly onto the price chart as dynamic bands. This allows the trader to see where the price would be if it reached those specific RSI exhaustion points.
2. The Multi-Layered Support & Resistance Matrix
The core strength of the script lies in its 20-level calculation engine. It computes 10 distinct resistance levels (H1-H10) and 10 distinct support levels (L1-L10) using a hybrid blend of:
* Exponential Moving Averages (EMA)
* Average True Range (ATR)
* Historical Extremes (High/Low Lookbacks)
* Price Action Ratios
These levels are then averaged to create the Final Resistance and Support Averages, providing a "solid" boundary that filters out market noise more effectively than a single moving average.
3. Volatility-Adjusted Dynamic Expansion
To adapt to changing market conditions, the indicator employs an ATR-based expansion mechanism. By applying a user-defined multiplier to the current ATR, the bands expand during high-volatility periods and contract during consolidation, ensuring the "Corridors" remain relevant regardless of market speed.
4. Trend Tracking & Persistence Logic
The system features a unique Signal Persistence logic. When a trend shift is detected (via an ATR-based trailing stop mechanism):
* Buy/Sell Signals: Triggered when the price breaks through the calculated trailing limits.
* Persistence Lines: Once a signal is generated, the indicator "locks" the support or resistance level at that moment and tracks it for an extended period (up to 19,999 bars). This helps traders identify long-term historical anchor points even after the immediate trend has passed.
5. Extreme Range Analysis (HH-LL)
Finally, the script calculates Extreme Upper and Lower Bounds based on the highest and lowest points of the signal tracking lines. This creates a "Master Range" that colors the chart dynamically, signaling whether the market is in a Red (Overextended High), Green (Overextended Low), or Blue (Neutral) state.
Summary of Key Features
* Hybrid Momentum/Volatility Engine: Combines RSI and ATR logic.
* Noise Reduction: Averages 20 different data points to find "True" support and resistance.
* Long-Term Reference: Unique tracking system that remembers signal levels for thousands of bars.
* Visual Clarity: Intuitive color coding for trend direction and extreme price zones.

EMAs ChimuTraderPublicoscrip de emas 200 y 50 periodos para anlizar todo BINANCE:SOLUSDT y muchas monedas mas

Stoch RSI M5 / M30 / H1_Brando ValenciaIndicator Description
This indicator displays the Stochastic RSI for 5-minute, 30-minute, and 1-hour timeframes simultaneously in one stable MTF panel — no lookahead, no repainting.
Red (5m) → entry timing
Green (30m) → short-term / intraday bias
Blue (1h) → higher-timeframe context & direction
The calculation matches the TradingView default Stoch RSI (%K) exactly:
RSI length: 14
Stochastic length: 14
Smoothing: 3
Levels
Above 80 → overbought
Below 20 → oversold
50 → trend filter / equilibrium
Purpose
This indicator is not a standalone entry trigger, but a context and timing tool:
1h & 30m define direction
5m provides precise entry windows
Ideal for scalping and day trading (e.g. EUR/USD during London & New York sessions).

MTF Bollinger Bands (2SD & 3SD)
개요
1분봉이나 5분봉 등 하위 타임프레임에서 스캘핑을 할 때, 차트를 변경하지 않고 상위 타임프레임(기본 4시간)의 볼린저 밴드 위치를 확인하기 위해 제작했습니다.
주요 기능
MTF (Multi-Timeframe): 현재 보고 있는 차트와 상관없이 설정한 타임프레임의 볼린저 밴드를 표시합니다. (기본값: 4시간)
듀얼 밴드 시각화 (Dual Zone): 표준편차 2(2SD)와 표준편차 3(3SD)을 동시에 계산합니다.
2SD 영역: 2SD와 3SD의 배경색이 겹치도록 설계하여, 중심부(2SD)가 시각적으로 더 진하게 보입니다. 이는 주요 지지/저항 구간을 직관적으로 보여줍니다.
3SD 영역: 외곽은 연하게 표시되어 과매수/과매도 구간을 식별하기 좋습니다.
끊김 없는 라인: gaps_off 처리를 통해 타임프레임 변경 시 선이 끊기지 않고 부드럽게 연결됩니다.
설정 가이드
Timeframe: 기준이 될 상위 시간대를 선택하세요. (기본: 240분/4시간)
Multiplier: 표준편차 배수를 변경할 수 있습니다. (기본: 2.0 / 3.0)
Transparency: 배경 투명도를 조절해 밴드의 진하기를 변경하세요.
==========================================
Overview
Designed for traders who need to monitor Higher Timeframe (HTF) volatility while scalping on Lower Timeframes (LTF). This indicator overlays HTF Bollinger Bands on your current chart without the need to switch tabs.
Key Features
MTF Capability: Displays Bollinger Bands from any user-defined timeframe. (Default: 4 Hours).
Dual Zone Visualization: Plots both 2 Standard Deviations (2SD) and 3 Standard Deviations (3SD).
Visual Depth: The script utilizes an overlapping fill method. The inner 2SD band appears darker as it layers on top of the 3SD background, clearly highlighting the primary support/resistance zone.
Extreme Zones: The outer 3SD band remains lighter, indicating extreme overbought/oversold conditions.
Seamless Plotting: Uses gaps_off to ensure lines remain continuous across different timeframes.
Settings
Timeframe: Select the target HTF. (Default: 240 / 4H)
Multiplier: Adjust the standard deviation multipliers. (Default: 2.0 & 3.0)
Style: Customize colors and transparency to fit your chart theme.

Custom ORB (Adjustable Time + Alerts)Opening range Breakout for the current day only. Time frame and be adjusted for first 15 min, 30 min, e.g., 9:30 am to 9:45 am or to 10 am, etc. You can add price alerts for high and low. You can also change the color of solid lines.


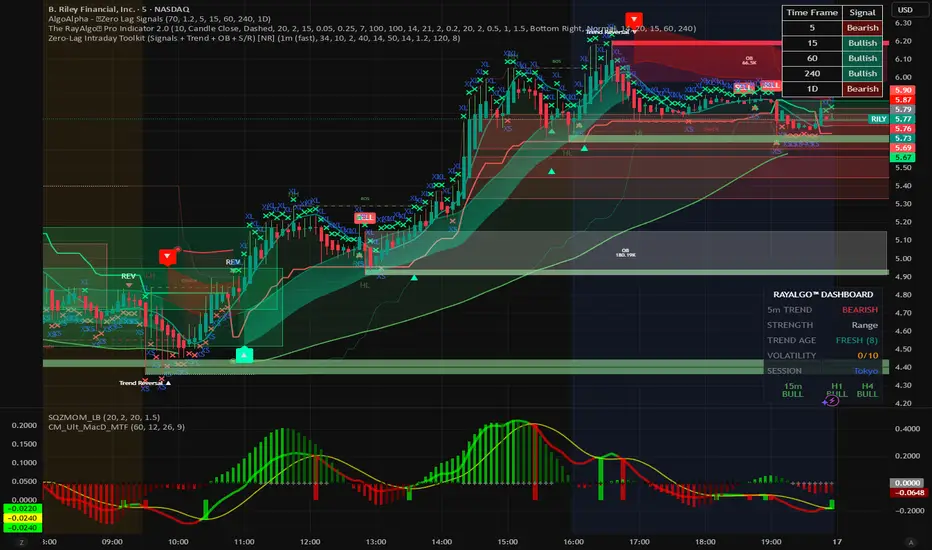
ZERO-LAG Tabrizi Scalping ToolKit This indicator will allow you to scalp on the 1M and 5M chart with zero lag. We will show you trend reversals and also when to buy and sell
Premarket High Low 4:00 at 9:30 AMThis indicator is designed for scalping in 2-minute intervals, taking into account that trading should occur after an SMA 13 / SMA 20 / SMA 200 compression.

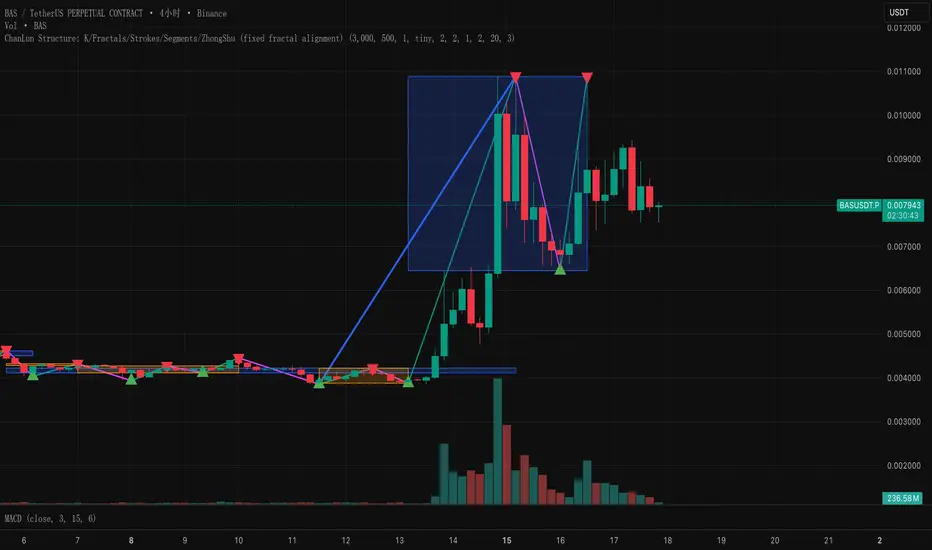
ChanLun Structure: K/Fractals/Strokes/Segments/ZhongShuThis script implements the "line and center" concept of CHANLUN.
Scalping Signals with MTF Fibo BandsThis indicator is a scalping / intraday signal system built on Multi-Timeframe (MTF) Fibonacci Bands, combined with an RSI midline filter and an optional direction-lock mechanism to reduce consecutive losing entries.
🔹 What does this indicator do?
It plots two independent Fibonacci Band sets (A & B), each calculated from a higher timeframe SMA + ATR.
Entry zones are defined between Band 2 and Band 3, representing statistically extreme price areas.
You can choose to generate signals from:
Band A only
Band B only
BOTH (A + B confirmation)
📈 Entry Logic
LONG
Price closes inside the Lower Zone (between Fib2 Lower & Fib3 Lower)
RSI is above the midline (default 50)
SHORT
Price closes inside the Upper Zone (between Fib2 Upper & Fib3 Upper)
RSI is below the midline (default 50)
🟧 Direction Lock System
If enabled, the indicator locks the trade direction when a position hits Stop Loss before reaching TP1.
This prevents repeated entries in the same direction during unfavorable conditions.
🔓 Unlock Logic
The lock can be removed when:
RSI crosses back over the midline (RSI > 50 for LONG, RSI < 50 for SHORT)
AND price closes again inside the valid Band 2–3 zone
With the optional setting enabled, a new entry can occur on the same candle
🛑 Stop Loss Logic (Important)
This indicator uses price-action-based stop logic, not fixed pip stops.
1️⃣ Before TP1
LONG: Two consecutive candle closes below Fib3 Lower
SHORT: Two consecutive candle closes above Fib3 Upper
⚠️ Because SL depends on candle closes, you must monitor lower timeframes (1m or below) to react quickly and avoid delayed exits.
2️⃣ After TP1 (Break-Even Protection)
Once TP1 is touched:
SL automatically shifts to Break-Even (entry price)
Any return to entry will close the position
⚠️ Usage Warning
This indicator is NOT designed for sharp, explosive, or news-driven moves
Avoid using it during:
High-impact news
Extremely fast impulsive candles
Sudden volatility spikes
Best performance is achieved in structured price action environments, not chaotic market conditions.


GS Volume Truth Serum (With Alerts)this tells you when institutions are behind a move and its not a bull trap

NQ bands 50/65.5/100this is a indicator that puts lines 50 points above and below price, 65.5 points above and below price and 100 points above and below price for the Nasdaq Futures.

Advance SMC (Milad Tayefi)Smart money indicator which recognizes market structure and produces buy/sell signals.

ADX Volatility Waves [BOSWaves]ADX Volatility Waves - Trend-Weighted Volatility Mapping with State-Based Wave Transitions
Overview
ADX Volatility Waves is a regime-aware volatility framework designed to map statistically significant price extremes through adaptive wave structures driven by trend strength.
Rather than treating volatility as a static dispersion metric, this indicator conditions all volatility expansion, contraction, and zone placement on ADX-derived trend intensity. Price behavior is interpreted through wave-like transitions between balance, expansion, and exhaustion states rather than isolated band interactions.
The result is a dynamic, gradient-based wave system that visually encodes volatility cycles and regime shifts in real time, allowing traders to contextualize price movement within trend-weighted volatility waves.
Price is evaluated not by static thresholds, but by its position and progression within adaptive volatility waves shaped by directional strength.
Conceptual Framework
ADX Volatility Waves is built on the premise that volatility unfolds in waves, not straight lines.
Traditional volatility tools identify dispersion but fail to account for how volatility behaves differently across trend regimes. By embedding ADX directly into volatility construction, this indicator ensures that volatility waves expand during strong directional phases and compress during weak or transitioning regimes.
Three guiding principles define the framework:
Volatility must be conditioned on trend strength
Extremes occur within zones, not at lines
Signals should emerge from completed wave transitions, not instantaneous touches
This reframes analysis from reactive mean-reversion toward regime-aware wave interpretation.
Theoretical Foundation
The indicator fuses directional movement theory with statistical volatility modeling.
Bollinger-derived dispersion provides the structural base, while ADX normalization controls the amplitude of volatility waves. As ADX increases, volatility waves widen and deepen; as ADX weakens, waves compress and tighten around equilibrium.
From this foundation, extended upper and lower wave zones are constructed and smoothed to represent statistically significant expansion and contraction phases.
At its core are three interacting systems:
ADX-Controlled Volatility Engine : Standard deviation is dynamically scaled using normalized ADX values, producing trend-weighted volatility waves.
Wave Zone Construction : Smoothed volatility boundaries are offset and expanded to form upper and lower wave zones, defining overextension and compression regions.
State-Based Wave Transition Logic : Signals occur only after price completes a full wave cycle: expansion into an extreme wave zone followed by a confirmed return to equilibrium.
This structure ensures that signals reflect completed volatility waves, not transient noise.
How It Works
ADX Volatility Waves processes price action through layered wave mechanics:
Trend-Weighted Volatility Calculation : Volatility boundaries are dynamically adjusted using ADX influence, allowing wave amplitude to scale with trend strength.
Structural Smoothing : Volatility boundaries are smoothed to stabilize wave geometry and reduce short-term distortions.
Wave Offset & Expansion : Upper and lower wave zones are positioned beyond equilibrium and expanded proportionally to volatility range, forming clearly defined expansion waves.
Gradient Wave Depth Mapping : Each wave zone is subdivided into multiple gradient layers, visually encoding increasing extremity as price moves deeper into a wave.
Wave State Tracking & Cooldown Control : The system tracks prior wave occupancy, enforces neutral stabilization periods, and applies cooldowns to prevent overlapping wave signals.
Compression Detection : Volatility width monitoring identifies compression phases, highlighting conditions where new volatility waves are likely to form.
Together, these processes create a continuous, adaptive wave map of volatility behavior.
Interpretation
ADX Volatility Waves reframes market reading around volatility cycles:
Upper Volatility Waves (Red Gradient) : Represent upside expansion phases. Deeper wave penetration indicates increased overextension relative to trend-adjusted volatility.
Lower Volatility Waves (Green Gradient) : Represent downside expansion phases. Sustained presence signals pressure, while exits toward balance suggest wave completion.
Equilibrium Zone : The neutral region between volatility waves. Confirmed re-entry into this zone marks the completion of a wave cycle and forms the basis for BUY and SELL signals.
Regime Context via ADX : Strong ADX regimes widen waves, reducing premature reversal signals. Weak ADX regimes compress waves, increasing sensitivity to reversion.
Wave progression and completion matter more than single-bar interactions.
Signal Logic & Visual Cues
ADX Volatility Waves produces single-entry BUY and SELL labels as its visual cues, plotted only when price first enters a volatility wave zone after the defined cooldown period.
Buy Signal (Bottom Zone Entry) : A BUY label appears when price enters the lower volatility wave (oversold zone). This highlights potential expansion into undervalued extremes, providing visual context for trend assessment rather than a guaranteed execution trigger.
Sell Signal (Top Zone Entry) : A SELL label appears when price enters the upper volatility wave (overbought zone). This marks potential overextension into upper volatility extremes, serving as a contextual indicator of trend stress.
All labels respect cooldown tracking to prevent clustering. Alerts are tied directly to these zone-entry signals, and a separate alert monitors volatility squeezes for awareness of compression periods.
Strategy Integration
ADX Volatility Waves integrates cleanly into volatility-aware trading frameworks:
Wave Context Mapping : Use wave depth to assess expansion and exhaustion risk rather than forcing immediate entries.
Transition-Based Execution : Prioritize BUY and SELL signals formed after confirmed wave completion.
Trend-Regime Filtering : In strong ADX regimes, treat waves as continuation pressure. In weak regimes, favor completed wave reversions.
Volatility Cycle Awareness : Monitor compression phases to anticipate the emergence of new volatility waves.
Multi-Timeframe Alignment : Apply higher-timeframe ADX regimes to contextualize lower-timeframe wave behavior.
Technical Implementation Details
Core Engine : ADX-normalized volatility expansion
Wave System : Smoothed, offset, expanded volatility waves
Visualization : Multi-layer gradient wave zones
Signal Logic : State-based wave transitions with cooldown enforcement
Alerts : Wave entry, wave completion, volatility compression
Performance Profile : Lightweight, real-time optimized overlay
Optimal Application Parameters
Timeframe Guidance:
1 - 5 min : Short-term volatility waves and intraday transitions
15 - 60 min : Structured intraday wave cycles
4H - Daily : Macro volatility regimes and expansion phases
Suggested Baseline Configuration:
BB Length : 20
BB StdDev : 1.5
ADX Length : 14
ADX Influence : 0.8
Wave Offset : 1.0
Wave Width : 1.0
Neutral Confirmation : 5 bars
These suggested parameters should be used as a baseline; their effectiveness depends on the asset volatility, liquidity, and preferred entry frequency, so fine-tuning is expected for optimal performance.
Performance Characteristics
High Effectiveness:
Markets exhibiting rhythmic volatility expansion and contraction
Assets with responsive ADX regime behavior
Reduced Effectiveness:
Erratic, news-driven price action
Illiquid markets with distorted volatility metrics
Integration Guidelines
Confluence : Combine with BOSWaves structure or trend tools
Discipline : Respect wave completion and cooldown logic
Risk Framing : Interpret wave depth probabilistically, not predictively
Regime Awareness : Always contextualize waves within ADX strength
Disclaimer
ADX Volatility Waves is a professional-grade volatility and regime-mapping tool. It does not predict price and does not guarantee profitability. Performance depends on market conditions, parameter calibration, and disciplined execution. BOSWaves recommends using this indicator as part of a comprehensive analytical framework incorporating trend, volatility, and structural context.

Daily & Pre-Market Key Levels (v5)Plots:
- Today's high/low
- Pre-market High/Low
- Yesterday's high/low/close
- Day before yesterday high/low

Varun's StrategyBuy and Sell strategy designed for a 1 minute chart to buy when RSI drops under 25 and sell when RSI exceeds 75

FX Session High/Low Bands - Last 5 EST Days
FX Session High/Low Bands - Last 5 Days
Description:
This indicator plots horizontal bands representing the high and low price levels from the major forex trading sessions over the last 5 days. It helps traders identify key support and resistance zones based on recent session activity.
Features:
Multiple Session Tracking: Displays high/low levels for major FX sessions:
Asian Session (Tokyo)
European Session (London)
US Session (New York)
5-Day Lookback: Captures the highest high and lowest low from each session over the previous 5 trading days
Visual Bands: Clear horizontal lines or filled zones showing session boundaries
Dynamic Updates: Automatically recalculates as new session data becomes available
How to Use:
Support/Resistance: Previous session highs/lows often act as key price levels
Breakout Trading: Watch for price breaking above/below session bands
Range Trading: Trade within the bands during consolidation periods
Session Overlap: Pay attention to multiple session bands converging
Ideal For:
Forex day traders
Session-based trading strategies
Support/resistance identification
Multi-timeframe analysis

Probability-Based Adaptive Detection🙏🏻 PBAD (Probability-Based Adaptive Detection) : adaptive control tool for outliers || novelty detection, made for worst case data & processes, for the highest time complexity O(n^2) compared with the alternatives (would be explained in a sec). Thresholds are completely data driven and axiomatic, no need in provided hyperparameters, are not learned or optimized. The method accepts multiple weights, e.g. both temporal and volatility weights.
Method briefly explained (I can go deeper if any1 asks explicitly):
Performs weighted KDE on initial input data, finds KDE global maximum (mode), creates new “residuals” dataset by centering initial data around this value;
Performs weighted KDE on residuals, uses sigmoid based probability mass targets with increasing probability coverage to construct a set of non-disjoint High Density Intervals (also called HDR, HPD in Bayesian terms);
Uses these intervals to calculate analogs of centralized & standardized moments;
Uses these ^^ moments to construct a set of control thresholds. The scheme used in PBAD is not only based on a central threshold, or on neighboring ones, it utilizes all previous thresholds, gaining more information.
...
The most important part is to understand whether you really need PBAD. Because even tho it seems to be the best one given highest algocomplexity, irl it would work worse in cases when it’s not required by your data.
Here’s the menu (aka taxonomy omg) of methods you can use that would let you make the right choice:
Moment-Based Adaptive Detection (MBAD) :
Norm: L2
Time complexity: original O(n), successfully reduced to O(1) in online version
Use case: default, general purpose
Based on: method of moments (powers of residuals from mean)
Thresholds architecture: centralized
Quantile-Based Adaptive Detection (QBAD):
Norm: L1
Time complexity: O(nlogn)
Use case: either bad data Or process instability
Based on: quantile moments (dyadic percentiles of residuals from median)
Thresholds architecture: chained/recursive/sequential
Probability-Based Adaptive Detection (PBAD):
Norm: L0
Time complexity: O(n^2)
Use case: both bad data And process instability
Based on: probability moments (target probability masses of residuals from KDE mode)
Thresholds architecture: decentralized (for lack of a better name xd, the idea is that these thresholds gain information from the all other threshold and are Not exclusively based on the central or neighboring thresholds)
...
Examples of true use cases:
^^ an appropriate financial instrument to use PBAD
^^ and another one
...
Additional details about how to use it:
Keep the student5 kernel, it’s the best you can do. I added others mostly for comparisons and if you want to use the tool Not for its primary purpose (on a fine data)
“Calculate for N bars” and “Starting at bar N” options allow to reduce calculation period only on the N number of last bars or next bars from a chosen one. It's vital, because calculations here are heavy
Keep plotting offset at 1 (allows to visually compare current bar with the previous threshold values). This is the way it should be done on price data.
HLC3 is the optimal source input, unless you want to use your own better one point estimate of each datapoint (in the best case done by using PBAD itself on OHLC+ values).
In essence it should be used just like MBAD or QBAD, fade/push extensions and limit, fade/push/skip deviations & basis, or other strategies of your. Again, the only reason for 3 methods to exist is to be chosen for according data characteristics.
Btw:
This is the initial version, I don’t consider it perfected tbh, even tho it works as expected, however this method is very situational anyways.
In this script KDE function is modified to ensure the outcoming probabilities Do sum up to 1. I didn’t do this normalization in Weighted KDE Mode script , but there it’s not required since we just need a KDE global max.
see ya
∞

Selected Days Indicator V3-TrDoes the stock drop every Wednesday? Do March months always move similarly? Does the 1st week of the month behave differently?
Do you ever say "it always makes this move in these months"? Don't you want to see more clearly whether it actually makes this move or not? Don't you want to see and test periodically repeating price patterns?
Hisse her Çarşamba düşüyor mu? Mart ayları hep benzer mi hareket ediyor? Ayın 1. haftası farklı mı davranıyor?
Bazen "bu aylarda hep bu hareketi yapıyor" dediğiniz oluyor mu? Gerçekten de bu hareketi yapıp yapmadığını daha net görmek istemez misiniz? Periyodik tekrarlayan fiyat kalıplarını görmek ve test etmek istemiyor musunuz?
1. Problem
Some stocks or crypto assets exhibit systematic behaviors on certain days, weeks, or months. But it's hard to see - everything is mixed together on the chart. This indicator isolates the days/weeks/months you want and shows only them. Hides everything else.
2. How It Works
Three-layer filter: Day (Monday, Tuesday...), Week (1st, 2nd, 3rd week of the month), Month (January, February...). Select what you want, let the rest disappear. Example: Show only Thursdays of March-June-September. Or compare every 1st week of the month. View as candlestick, line, or column chart.
3. What's It Good For?
Test "end-of-month effect". Find "day-of-the-week anomaly". Analyze crypto volatility by days. See seasonality in commodities. Discover patterns specific to your own strategy. Past data doesn't guarantee the future but provides statistical advantage.
