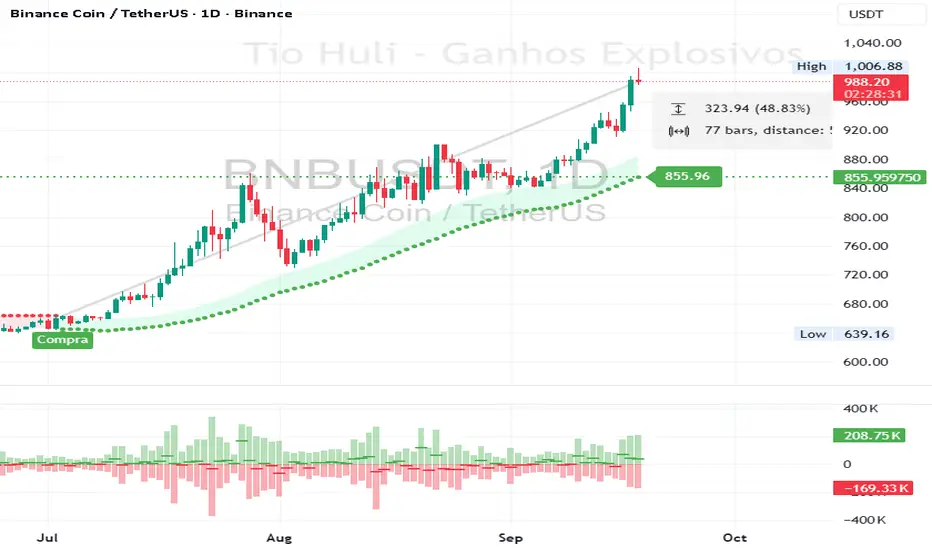
CHiLo — Custom HiLo (SMA/EMA, Activator, Shading, Auto-Decimals)CHiLo is a clean Hi/Lo trend read with SMA/EMA options, a HiLo vs. HiLo Activator mode, optional band shading , and a right-side HiLo marker with automatic decimals based on the symbol. Optional Buy/Sell labels mark state flips. Inspired by the broader trend-following literature and practitioners; in Brazil, educator Hulisses “Tio Huli” Dias is a notable voice popularizing trend following.
What it does
CHiLo plots a Hi/Lo state with two modes:
HiLo (classic high/low bands)
HiLo Activator (activator-style behavior)
It includes:
SMA/EMA selection
Optional shading between Hi/Lo bands
Optional Buy/Sell labels on state flips
HiLo marker (auto-decimals from the symbol’s tick size)
Goal: deliver a fast, visual trend context that you can pair with your own risk rules and confirmations.
How to use
Add the indicator and choose Mode (HiLo / Activator) and MA type (SMA/EMA).
Tune Period (and Offset if needed). Higher = smoother (fewer flips); lower = more responsive.
Toggle Shading to emphasize the envelope.
Toggle Buy/Sell labels if you want flip markers.
Use the HiLo marker on the right to read the current level (auto-formatted).
Inputs (quick reference)
Period / Offset — sensitivity vs. delay.
Type — HiLo or HiLo Activator.
MA Type — SMA (steadier) or EMA (snappier).
HiLo Style — Points or Line.
Shading & Transparency — highlight the band area.
Buy/Sell Labels — on/off.
HiLo Marker — size and horizontal offset (decimals automatic).
Notes & credits
Educational use only; not financial advice.
For best results, combine with position sizing, stops, and regime filters.
Băng tần và kênh
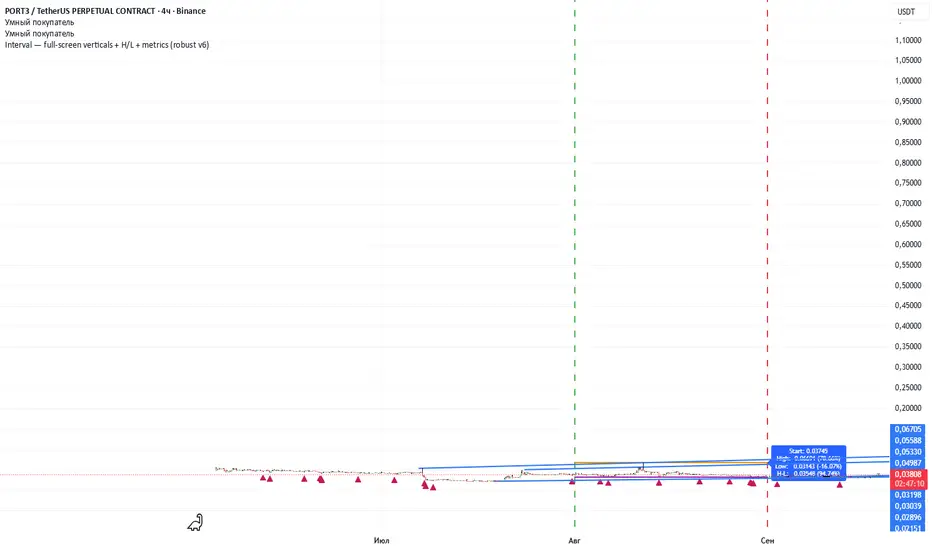
Interval — full-screen verticals + H/L + metrics (robust v6)Specify the start date of the analysis and the end date of the analysis, after which 2 vertical lines will appear, the extremes in this period will be marked, and the percentage of deviations will be shown. Next, you can switch assets and see how they behave over the same time interval.

知行短期趋势线(双EMA)Double EMA long and shortDouble EMA long and short K line crosses up and down to generate signals

[delta2win] Liquidity Zone Map🔥 Liquidity Zone Map — Volume‑normalized pivot zones with adaptive ATR scaling
📊 What it does:
• Detects potential liquidity/liquidation zones above confirmed highs and below confirmed lows
• Draws dynamic zones whose height scales with ATR and whose color intensity scales with volume
• Zones extend right and terminate on rule‑based events (midline cross)
🔬 How it works (core formulas):
• Pivot detection: ta.pivothigh/ta.pivotlow with length L
• Zone height: H = max(ATR(T) × M, MinTicks)
• Intensity (volume‑normalized):
– Z‑Score mode: I = clamp((V − μ) / (σ + ε), 0..1)
– Piecewise mode: I = clamp(V ≤ μ ? V/μ : (V − μ) / (Vmax − μ + ε), 0..1)
• Gradient color: col = Gradient(I) (start → mid → end)
• Zone life‑cycle:
– Creation on new pivot (top/bottom)
– Right edge follows bar_index
– Termination when with Mid = (Top+Bottom)/2, or optional TTL timeout
• Analysis range: global or constrained (Bars Back or ±% price window). Color scaling can be global or range‑scoped.
🆕 What’s new/different:
• Selectable volume normalization (Z‑Score or Piecewise)
• Timeframe‑adaptive ATR multiplier
• Range‑scoped vs. global color scaling
• Optional midlines, borders, info legend, scale legend
• Optional TTL termination for zones (lifetime in bars)
• Object management (cleanup/pooling) for performance
🧭 How to use (suggested presets):
• 1–5m: L=2, T=200, M=0.25, Range=Bars Back 1000, Intensity=Piecewise
• 15–60m: L=3, T=200, M=0.20, Range=Bars Back 1500, Intensity=Piecewise
• 4h+: L=4, T=200, M=0.20, Range=Off, Intensity=Z‑Score
⚙️ Settings:
• Pivot length L, ATR length T, multiplier M, MinTicks
• Opacity: base/auto (min/max)
• Range: Bars Back | Price Range ±% | Off
• Scaling: global vs. range‑scoped
• Midlines/borders/legends on/off
💡 Usage notes:
• Smaller L → more reactive, less robust
• Larger M → longer‑lasting zones
• On higher TFs, constrain "Bars Back" for performance
⚠️ Limitations:
• Non‑predictive; regime/volatility dependent
• Data quality impacts intensity computation

Ultimate Sniper Entry - Pivot PerfectionT2R📌 Description
The Ultimate Sniper Entry – Pivot Perfection is a precision trading tool designed to identify high-probability pivot points and generate early buy/sell entries with strong confirmation. By combining pivot detection, volume spikes, momentum filters (RSI), candle patterns, and EMA trend alignment, this system helps traders capture market reversals and trend continuation setups with improved accuracy.
It offers:
Smart Pivot Detection with adjustable sensitivity.
Multi-layer Confirmation: volume, momentum, candle structure, and EMA trend filter.
Non-Repainting Signals: arrows plotted only after pivot confirmation.
Visual Aids: buy/sell arrows, optional pivot markers, background trend shading.
Alerts: instant notifications for sniper buy/sell entries.
Info Panel: quick reference guide directly on chart.
Ideal for traders who want structured, rules-based entries while avoiding false signals, the Ultimate Sniper Entry system adapts to multiple markets and timeframes.

Emas cryptosmart## General Summary
The Emas cryptosmart indicator is a technical analysis tool designed to provide a clear and comprehensive view of the market trend. It combines a long-term Hull Moving Average (HMA) to establish the overall trend with a faster, more responsive Triple Hull Moving Average (THMA) to identify short-term momentum.
Its primary feature is the dynamic candle coloring, which offers immediate visual cues about price direction, simplifying trading decisions.
## Indicator Components
This indicator is composed of two main lines:
Hull 200 (HMA): The Long-Term Trend Anchor
This line (dynamic lime/red by default) acts as a filter for the main market trend. Due to its 200-period setting, it moves smoothly and establishes the general context.
Uptrend: When the Hull 200 is rising (lime color), it indicates the macro trend is bullish.
Downtrend: When it is falling (red color), the macro trend is bearish.
THMA 55: The Short-Term Momentum Line
This line (dynamic aqua/orange by default) is a Triple Hull Moving Average. It is extremely fast and sensitive to recent price changes, designed to capture immediate momentum.
This is the key line for the candle coloring and for identifying potential entry or exit points.
## How to Interpret It
The primary strategy is to use the Hull 200 to define the direction for your trades and the THMA 55 to fine-tune your timing.
Candle Coloring (Main Signal):
Bullish Candles (default: aqua): When the price closes above the THMA 55, the candles turn to a bullish color. This signals that immediate momentum is positive and can be considered a buy signal or confirmation to stay in a long position.
Bearish Candles (default: orange): When the price closes below the THMA 55, the candles turn to a bearish color. This indicates that immediate momentum is negative, suggesting a potential sell or an exit from a long position.
Confluence Strategy:
The highest-probability signals occur when both moving averages are aligned.
Strong Buy Example: Look for a situation where the Hull 200 is rising (lime color) and wait for the candles to turn bullish as the price crosses above the THMA 55.
Strong Sell Example: Look for a situation where the Hull 200 is falling (red color) and wait for the candles to turn bearish as the price crosses below the THMA 55.
## Key Features
Visual Clarity: Automatic candle coloring eliminates the need to constantly interpret crosses, allowing for a quick read of the market's state.
Dual Perspective: Offers a balanced view by combining a slow trend indicator with a fast momentum indicator.
Reduced Lag: The use of Hull variants minimizes the delay typical of conventional moving averages (SMAs/EMAs).
Fully Customizable: All colors, for both the lines and the candles, can be adjusted in the settings menu to fit your visual style.
oscillator fast cryptosmart (Bands on Scale)The oscillator fast cryptosmart is a high-sensitivity momentum indicator designed to generate signals more rapidly than many traditional oscillators, such as the MACD. It is engineered to detect potential price breakouts by analyzing short-term market cycles.
At its core, the indicator uses a Detrended Price Oscillator (DPO) to remove the longer-term trend from price action, allowing it to focus purely on the underlying momentum cycles. It then calculates dynamic volatility bands around this oscillator line.
Signals are generated when momentum breaks out from a normal range, providing traders with an early warning of a potential acceleration in price.
How to Interpret the Signals:
Buy Signal (Green Vertical Line): A buy signal is generated when the oscillator's main line (yellow) crosses above its upper statistical band. This indicates a sharp surge in positive momentum, suggesting a potential upward move is beginning.
Sell Signal (Red Vertical Line): A sell signal is generated when the oscillator's main line crosses below its lower statistical band. This indicates a significant increase in negative momentum, suggesting a potential downward move is starting.
By focusing on momentum breakouts rather than lagging moving average crossovers, the oscillator fast cryptosmart aims to provide an edge in identifying opportunities in fast-moving markets.

oi + funding oscillator cryptosmartThe oi + funding oscillator cryptosmart is an advanced momentum tool designed to gauge sentiment in the crypto derivatives market. It combines Open Interest (OI) changes with Funding Rates, normalizes them into a single oscillator using a z-score, and identifies potential market extremes.
This provides traders with a powerful visual guide to spot when the market is over-leveraged (overheated) or when a significant deleveraging event has occurred (oversold), signaling potential reversals.
How It Works
Combined Data: The indicator tracks the rate of change in Open Interest and the value of Funding Rates.
Oscillator: It blends these two data points into a single, smoothed oscillator line that moves above and below a zero line.
Extreme Zones:
Overheated (Red Zone): When the oscillator enters the upper critical zone, it suggests excessive greed and high leverage, increasing the risk of a sharp correction (long squeeze). A cross below this level generates a potential sell signal.
Oversold (Green Zone): When the oscillator enters the lower critical zone, it indicates panic, liquidations, and a potential market bottom. A cross above this level generates a potential buy signal.
Trading Strategy & Timeframes
This oscillator is designed to be versatile, but its effectiveness can vary depending on the timeframe.
Optimal Timeframes (1H and 4H): The indicator has shown its highest effectiveness on the 1-hour and 4-hour charts. These timeframes are ideal for capturing significant shifts in market sentiment reflected in OI and funding data, filtering out short-term noise while still providing timely reversal signals.
Lower Timeframes (e.g., 1-min, 5-min, 15-min): On shorter timeframes, the oscillator is still a highly effective tool, but it is best used as a confluence factor within a broader trading system. Due to the increased noise on these charts, it is not recommended to use its signals in isolation. Instead, use it as a final argument for entry. For example, if your primary scalping strategy gives you a buy signal, you can check if the oscillator is also exiting the oversold (green) zone to add a powerful layer of confirmation to your trade.
Outside the Bollinger Bands Alerting Indicator Overview
The Outside the Bollinger Bands Alerting Indicator is a comprehensive technical analysis tool that combines multiple proven
indicators into a single, powerful system designed to identify high-probability reversal patterns at Bollinger Band extremes. This
indicator goes beyond simple band touches to detect sophisticated pattern formations that often signal strong directional moves.
Key Features & Capabilities
🎯 Advanced Pattern Recognition
Bollinger Band Breakout Patterns
- Detects "pierce-and-reject" formations where price breaks through a Bollinger Band but immediately reverses back inside
- Identifies failed breakouts that often lead to strong moves in the opposite direction
- Combines multiple confirmation signals: engulfing candle patterns, MACD momentum, and ATR volatility filters
- Visual alerts with symbols positioned below (bullish) or above (bearish) candles
Tweezer Top & Bottom Patterns
- Identifies consecutive candles with nearly identical highs (tweezer tops) or lows (tweezer bottoms)
- Requires at least one candle to breach the respective Bollinger Band
- Confirms reversal with directional close requirements
- Customizable tolerance settings for pattern sensitivity
- Visual alerts with ❙❙ symbols for easy identification
📊 Multi-Indicator Integration
Bollinger Bands Indicator
- Dual-band configuration with outer (2.0 std dev) and inner (1.5 std dev) bands that can be adjusted to suit your own parameters
- Configurable MA types: SMA, EMA, SMMA (RMA), WMA, VWMA
- Customizable length, source, and offset parameters
- Color-coded band fills for visual clarity
Moving Average Suite
- EMA 9, 21, 50, and 200 (individually toggleable)
- Special "SMA 3 High" for help visualizing and detecting Bollinger Band break-outs
- Dynamic color coding based on price relationship
Optional Ichimoku Cloud overlay
- Complete Ichimoku implementation with customizable periods
- Dynamic cloud coloring based on trend direction
- Toggleable overlay that doesn't interfere with other indicators
🚨 Comprehensive Alert System
Real-Time JSON Alerts
- Sends structured data on every confirmed bar close
- Includes all indicator values: BB levels, EMAs, MACD, RSI
- Contains signal states and crossover conditions
- Perfect for automated trading systems and webhooks
{"timestamp":1753118700000,"symbol":"ETHUSD","timeframe":"5","price":3773.3,"bollinger_bands":{"upper":3826.95,"basis":3788.32,"lower":3749.68},"emas":{"ema_9":3780.45,"ema_21":3788.92,"ema_50":3800.79,"ema_200":3787.74,"sma_3_high":3789.45},"macd":{"macd":-10.1932,"signal":-11.3266,"histogram":1.1334},"rsi":{"rsi":40.5,"rsi_ma":39.32,"level":"neutral"}}
Specific Alert Conditions
- MACD histogram state changes (rising to falling, falling to rising)
- RSI overbought/oversold crossovers
- All pattern detections (BB Bounce, Tweezer patterns)
- Bollinger Band breakout alerts
🎨 Visual Elements
Pattern Identification
- ♻ symbols for Bollinger Band breakout patterns (green for bullish, red for bearish)
- ❙❙ symbols for tweezer patterns (green below for bottoms, red above for tops)
- Color-coded band fills for trend visualization
Chart Overlay Options
- All moving averages with distinct colors
- Bollinger Bands with inner and outer boundaries
- Optional Ichimoku cloud with trend-based coloring
Trading Applications
Reversal Trading
- Identify high-probability reversal points at extreme price levels
- Use failed breakout patterns for entry signals
- Combine multiple timeframes for enhanced accuracy
Trend Analysis
- Monitor moving average relationships for trend direction
- Use Ichimoku cloud for trend strength assessment
- Track momentum with MACD and RSI integration
Risk Management
- ATR-based volatility filtering reduces false signals
- Multiple confirmation requirements improve signal quality
- Real-time alerts enable prompt decision making
Suggested Use
- Use on multiple timeframes for confluence
- Combine with support/resistance levels for enhanced accuracy
- Set up alerts for hands-free monitoring
- Customize settings based on market volatility and trading style
- Consider volume confirmation for stronger signals

Sessions Highs/LowsThis indicator plots the High and Low of the three main trading sessions:
Asia (20:00–03:00) – green lines
London (03:00–08:00) – blue lines
New York (08:00–13:00) – red lines
Features:
Levels update in real time during each session.
When a new session starts, the previous lines are deleted – only the latest active sessions remain visible.
Default session times are set to Asia (20:00–03:00), London (03:00–08:00), and New York (08:00–13:00), but you can adjust them to your own custom hours in the settings.
Colors can also be customized.
Use cases:
Quickly visualize session ranges.
Track session highs/lows for breakouts, fakeouts, and reactions around liquidity zones.

Trend ChannelThis Trend Channel is designed to simplify how traders view trends, while also keeping track of potential shifts in trends with signals. It is designed for traders that prefer less over more.
The indicator can be used for trend following, trend reversals and confirmation in combination with price or other indicators.
At the core is one EMA and a smoothed volatility based channel around it.
The purpose of the channel is to avoid false signals on trend reclaim or trend loss and instead identify trend deviations.
The indicator also incorporates long and short EMA cross-over signals to recognize possible shifts in trend without having to overlay multiple EMAs and keep the chart cleaner.
Additionally the indicator fires warnings for potential false signals on golden/death crosses with a letter "W" above/below the signal candle. Those warnings are based on the distance between price and the crossover. When the distance is above a certain threshold the indicator fires a warning that price might mean revert.
Traders can customize all inputs in the settings.

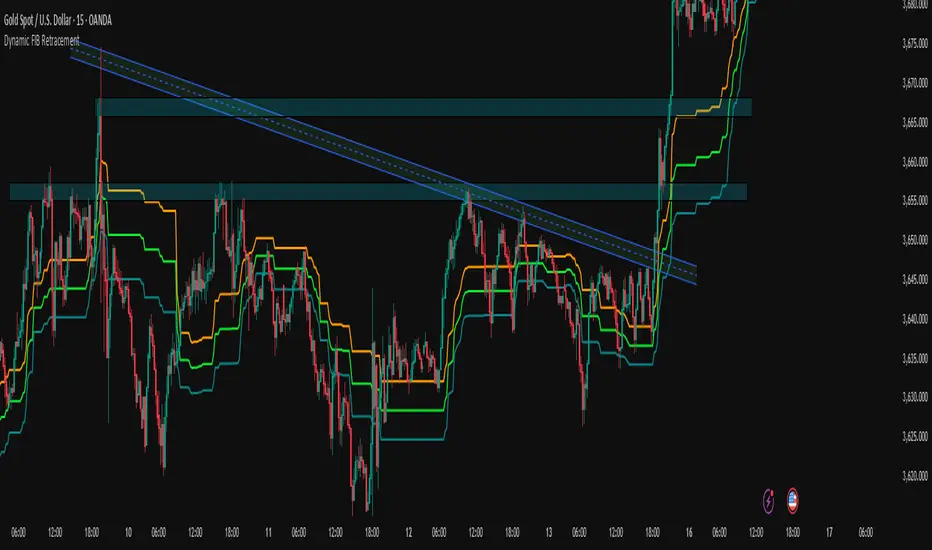
Dynamic FIB Retracement Dynamic FIB Retracement.
Description:
This indicator automatically plots dynamic Fibonacci retracement levels (0.382, 0.5, 0.618) based on the highest high and lowest low of the selected lookback period on the current timeframe. It also provides Buy Above / Sell Below signals at the 0.5 Fibonacci level with trend confirmation, making it easier to spot high-probability trade setups.
Key Features:
Dynamic Fibonacci Levels – Automatically calculates 0.382, 0.5, and 0.618 retracements based on recent price action.
Trend Filter Confirmation – Signals only trigger in the direction of the trend using an EMA-based trend filter (user-adjustable).
Customizable Lookback – Choose how many bars the script should use to detect the high and low for Fibonacci levels.
Visual Alerts – Signals are displayed directly on the chart with triangles, and alerts can be configured for both Buy and Sell events.
Easy to Use – Works on any timeframe and updates automatically as price moves.
Inputs:
Lookback Bars: Determines the number of bars to calculate high and low for Fibonacci levels.
EMA Length: Sets the period for EMA used in trend filtering signals.
Use Cases:
Identify potential retracement zones for entries and exits.
Filter trades in the direction of the trend for higher accuracy.
Quick visualization of key Fibonacci levels for swing or intraday trading.
How to Use:
Apply the indicator to your chart.
Adjust the lookback period and EMA length to match your trading style.
Watch for Buy Above / Sell Below signals near the 0.5 Fibonacci level aligned with the trend.
Optionally, set alerts for automatic notifications when signals occur.
Argentum Flag [AGP] Ver.2.5Central Purpose and Concept
The Argentum Flag script is a multifunctional tool that integrates and visualizes multiple key indicators to provide a detailed and unified perspective of the market. The core concept is to analyze price from different angles—volatility, volume, and momentum—to identify confluences and patterns that may be difficult to see with separate indicators. This "mashup" is not a simple fusion of indicators, but a strategic combination of tools that complement each other to offer a comprehensive view of asset behavior.
Components and Their Functionality
This script combines and visualizes the following elements:
EMA Percentage Bands (EMA Bands):
Uses an Exponential Moving Average (EMA) as a baseline.
Calculates and draws several volatility bands that deviate from the central EMA by fixed percentages (0.47%, 0.94%, 2.36%). These bands are inspired by Fibonacci ratios and the cyclical nature of the market.
The bands are colored with a dynamic gradient that reflects the current state of volatility.
Utility: These bands act as dynamic support and resistance areas. The price entering or exiting these zones can indicate a change in volatility or a possible exhaustion of the movement.
Volatility Signals (Vortex & Prime Signals):
The script generates visual signals when the price stays outside the volatility bands for a specific number of bars.
Vortex Signals (diamond ⍲): Appear when the price crosses and stays outside the Prime bands, suggesting a high volatility or a possible continuation of the trend.
Exit/Entry Signals (circle ⌾): Are activated when the price stays outside the Vortex bands, indicating an extreme extension of volatility. These can be interpreted as potential reversal or profit-taking zones.
Utility: They help traders quickly identify moments of high and low volatility and potential turning points in price action.
Volume Analysis (Volume Bar Colors):
The script changes the color of the bars based on the relationship between the current volume and the average volume over a 50-bar period.
Utility: This feature allows the trader to immediately visualize the strength behind a price movement. For example, a bullish candle with "extreme" volume suggests strong buying interest, while a bearish candle with "low" volume could indicate a weak correction.
Summary Tables (Dashboard):
EMA-Fibo Table: Displays the values of 12 EMAs based on the Fibonacci sequence (5, 8, 13, 21...) in an easy-to-access table. The background color of each value indicates if the current price is above (bullish) or below (bearish) that EMA.
Multi-Timeframe RSI Table: Displays the Relative Strength Index (RSI) values across multiple timeframes (from 1 minute to monthly). The text color changes to highlight if the RSI is in overbought (orange) or oversold (white) areas, according to the established levels.
Utility: These tables condense a large amount of data into a simple format, allowing traders to perform a quick, multi-timeframe market analysis without constantly switching charts.
How to Use the Script
This script is a contextual analysis tool that works best when its different components are combined. It is not a "buy and sell signal" system on its own, but a tool for informed decision-making.
Trend Identification: Use the EMA table to see the general trend direction across different timeframes. A price above most of the EMAs in the table suggests a bullish bias.
Volatility Reading: Observe the EMA bands. If the price stays within the bands, volatility is low. A strong move that breaks out of the bands, accompanied by an "extreme" volume color (blue), suggests strong momentum that could continue.
Momentum Analysis: Use the RSI table to confirm movements. An overbought 15m RSI could support a reversal signal from the Vortex bands, while a 1D RSI in a neutral zone may indicate that the main trend has not changed.
Signal Confirmation: Visual signals (diamond and circle) should not be used in isolation. They must be confirmed by volume analysis and dashboard readings. For example, an "Exit Signal" (circle) with low volume may be less reliable than one with high volume and a clear reversal candle.
Disclaimer
This script is for informational and educational purposes only. It is not financial advice, nor is it a recommendation to buy or sell any financial instrument. All trading involves risk, and past performance is not indicative of future results. The user is solely responsible for their own trading decisions.

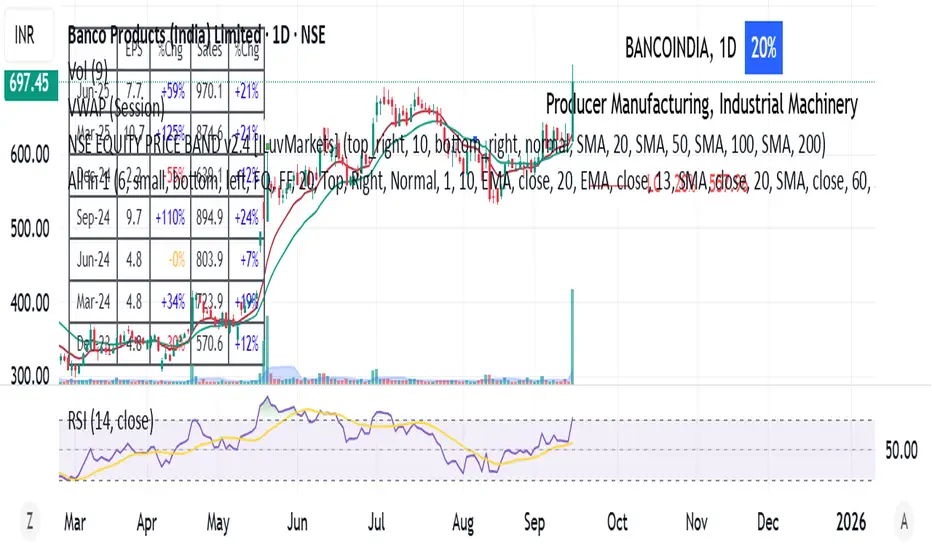
All in 1 by trading spell_kkall in one indicator sharing a mix of ema, quarterly earnings, adr, and market cap
vwap inside bar jmrjm vwap inside bar which helps to take guage trend with vwap and and help to understand when market taking pause due to bulls and bears fight. Then we can take a trade in trend with winners.

RSI Divergence Indicator + Current Value - YOSIRSI Divergence Indicator – TradingView
The RSI Divergence Indicator is a custom TradingView tool designed to detect and visualize both regular and hidden divergences between price action and the Relative Strength Index (RSI).
🔹 Core Features:
Plots RSI with standard overbought (70), oversold (30), and midline (50) levels.
Highlights regular bullish divergence (price makes lower low, RSI makes higher low).
Highlights regular bearish divergence (price makes higher high, RSI makes lower high).
Detects hidden bullish divergence (price higher low, RSI lower low).
Detects hidden bearish divergence (price lower high, RSI higher high).
Clear visual signals using colored markers and labels (“Bull”, “Bear”, “H Bull”, “H Bear”).
Built-in alert conditions to notify traders when new divergences appear.
🔹 Customization:
Adjustable RSI period and source (default: 14, close).
Configurable pivot lookback (left & right) for fine-tuning divergence detection.
Options to enable/disable plotting of specific divergence types.
Custom colors for bullish, bearish, hidden bullish, and hidden bearish signals.
🔹 Added Upgrade (based on your request):
Displays the current RSI value next to the line, allowing quick reference without hovering.

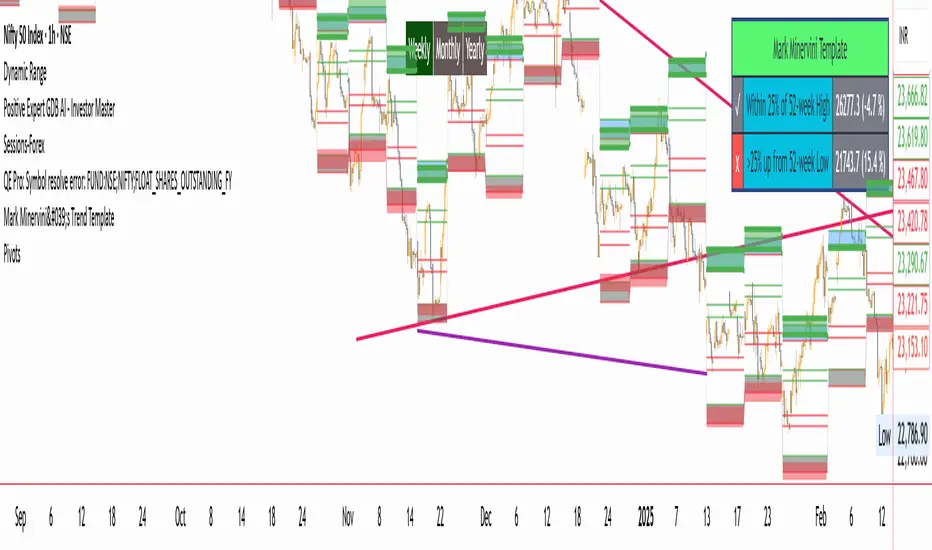
mara Dynamic RangeUpdated pp dynamic zone indicator, which helps to provide support/resistance for intra day and swing trade
Multi-Exchange VWAP Aggregator (Crypto)Description:
This advanced VWAP indicator aggregates volume data from up to 9 cryptocurrency exchanges simultaneously, providing a more accurate volume-weighted average price than single-exchange VWAP calculations.
Key Features:
Multi-Exchange Aggregation - Combines volume from Binance, Coinbase, Bybit, Bitfinex, Bitstamp, Deribit, OKEx, Phemex, and FTX
Flexible Currency Pairs - Supports both spot (USD, USDT, EUR, USDC, BUSD, DAI) and perpetual futures contracts
Standard Deviation Bands - Includes customizable 1σ, 2σ, and 3σ bands for identifying overbought/oversold levels
Multiple Reset Periods - Daily, Weekly, Monthly, or Session-based VWAP calculations
Volume Calculation Options - Choose between SUM, AVG, MEDIAN, or VARIANCE for volume aggregation
Why Use This?
Traditional VWAP indicators only use volume from a single exchange, which can be misleading in fragmented crypto markets. This indicator provides a comprehensive market-wide VWAP by aggregating volume across major exchanges, giving you a more reliable benchmark for entries, exits, and institutional price levels.
Perfect for traders who want to see where the real volume-weighted price sits across the entire crypto market, not just one exchange.

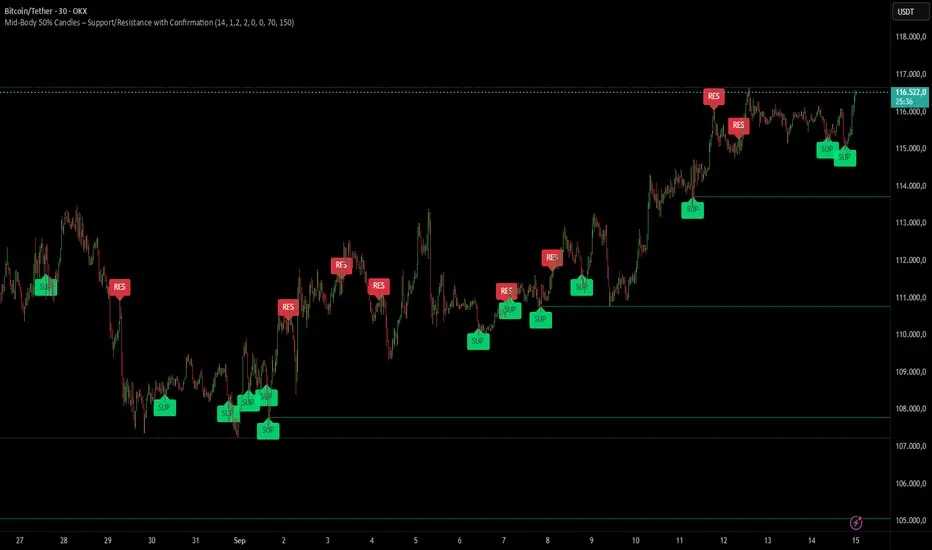
Mid-Body 50% Candles – Support/Resistance with ConfirmationHow it works:
– Calculates the mid-body (open+close)/2 of the previous candle.
– Bullish candle → potential SUP level.
– Bearish candle → potential RES level.
– Optional next-bar confirmation (close above/below the mid-body).
– Filters available: ATR size, swing detection, upper/lower wick %.
– Lines extend until broken or removed.
– Alerts available for: level creation, touch and break.
Use cases:
– Confirm candle rejections (pin bars).
– Filter false breakouts.
– Refine entries/exits for scalping or swing trading.
What makes it unique:
Unlike generic Fibonacci or candle tools, this script focuses exclusively on the 50% body level with confirmations and multiple filters, making it more precise for price action decision points.
AKTProfessional Style
“This tool helps in marking lines for options and forex, making trading easier and more effective for you.”
“We apply it to mark key lines in options and forex markets, and it provides great value for traders like you.”
“Used for marking support and resistance lines in options and forex, it’s a highly useful tool for your trades.”
🔹 Simple & Direct Style
“We use it to mark lines in options and forex — very useful for you.”
“It helps mark lines for options and forex, making it useful in your trading.”
“A handy way to mark lines in options and forex, and it’s very useful for you.”
Weekly Setup Scanner (Trend + Momentum + Squeeze)Trend → price above weekly 20 EMA.
Momentum → weekly MACD bullish (MACD > Signal).
Volatility → weekly squeeze (Bollinger Bands inside Keltner Channels).
If all 3 conditions align → it flags the setup
