Sideways Strategy DMI + Bollinger Bands (by Coinrule)Markets don’t always trade in a clear direction. At a closer look, most of the time, they move sideways. Relying on trend-following strategies all the time can thus lead to repeated false signals in such conditions.
However, before you can safely trade sideways, you have to identify the most suitable market conditions.
The main features of such strategies are:
Short-term trades, with quick entries and quick exits
Slightly contrarian and mean-reversionary
Require some indicator that tells you it’s a sideways market
This Sideways DMI + Bollinger Bands strategy incorporates such features to bring you a profitable alternative when the regular trend-following systems stop working.
ENTRY
1. The trading system requires confirmation for a sideways market from the Directional Movement Index (DMI) before you can start opening any trades. For this purpose, the strategy uses the absolute difference between positive and negative DMI, which must be lower than 20.
2. To pick the right moment to buy, the strategy looks at the Bollinger Bands (BB). It enters the trade when the price crosses over the lower BB.
EXIT
The strategy then exits when the move has been exhausted. Generally, in sideways markets, the price should revert lower. The position is closed when the price crosses back down below the upper BB.
The best time frame for this strategy based on our backtest is the 1-hr. Shorter timeframes can also work well on certain coins that are more volatile and trade sideways more often. However, as expected, these exhibit larger volatility in their returns. In general, this approach suits medium timeframes. A trading fee of 0.1% is taken into account. The fee is aligned to the base fee applied on Binance, which is the largest cryptocurrency exchange.
Bollingerbandstrategy

Best TradingView Strategy - For NASDAQ and DOW30 and other IndexThe script is totally based on momentum , volume and price. We have used :
1: Bollinger Band Squeezes to know when a breakout might happen.
2: Used Moving Averages(SMA and EMA) to know the direction.
3: The success Rate of this strategy is above 75% and if little price action is added it can easily surpass 90% success mark.
4: Do not worry about drawdowns , we have implemented trailing SL ,so you might see a little extra drawdown but in reality its pretty less.
5: I myself have tested this strategy for 41 days with a 250$ account and right now I have 2700$.

MadriEsta estrategia fue creada por mi, basándose en el indicador bollinger bands+rsi y una ema , forexstrategiesresources me lo pasó a codigo y despues fue publicado en ChartArt y en la pagina web de forexstrategiesresources.
Ahora este script lo he modificado para optimizarlo para BTC /USDT en la temporalidad de 1 hora, os invito a ir cambiando temporalidades y valores para conseguir la mayor rentabilidad y, al igual que yo lo publico en codigo abierto os invito a que pongáis vuestros ajustes en los comentarios.
Los ajustes que se pueden cambiar para buscar mayor rentabilidad son en primer lugar "lo que se puede cambiar desde el mismo grafico" los valores "A" y "B".
Además, en el codigo el valor "RSIoverSold" y el "RSIoverBought" por mi experencia con menos de 30 no suele ir bien y con mas de 70 tampoco, el rango adecuado es de 29 a 49, incluidos.
Yo no he trasteado mucho pero también os invito a cambiar la fuente de entrada de "close" a "high", "open", "low"...
Recomiendo para la configuración ACTUAL mismo símbolo, mismos valores operar las señales Short cuando el precio este por debajo de la EMA de 900 y operar las Long cuando este por encima.
En otros símbolos la cosa cambia, hay que adaptarlo a cada cosa.

Trend Following with Bollinger BandsThis is a trend following system which uses the Bollinger Bands instead of the Donchian Channels.
Long position:
* Price closes above the middle line.
* The fast EMA (in this case the 40) crosses over or is above the slow one (in this case the 120)
Short position:
* Price closes below the middle line.
* The fast EMA crosses under or is below the slow one.
Stoploss:
* 4 ATRs away from the price.

Bollinger Band Breakout Positional Strategy- BN -15M This strategy consists of following criteria:
Buy:
1. Candle should have RSI is above 60 and Close above Bollinger band upper limit
2. Exit When candle is closed below 20MA
Sell:
1. Candle should have RSI is above 40 and Close below Bollinger band lower limit
2. Exit When candle is closed above 20MA
Checkout results.

Bollinger Bands Fibonacci Ratios StrategyHello, everyone!
We have just released an innovative strategy for TradingView. It allows you to identify price pivot points and volatility.
This strategy is:
User-friendly
Configurable
Equipped with Bollinger Bands and smoothed ATR to measure volatility
Features
Thanks to the BB Fibo strategy, you can:
Trade stocks and commodities.
Identify price pivot points.
Choose any band for trading Long or Short positions.
Swap upper and lower bands applying Use Reverse Buy/Sell parameters.
Note! The upper bands are for the Long position. The lower bands are for the Short positions.
Parameters
We have equipped our strategy with more than 14 additional parameters. So, you can configure the EA according to your needs!
Inputs:
Length
Source: Open, High, Low, Close, HL2, HLC3, OHLC4
Offset
Fibonacci Ratio 1 — a Fibonacci factor for the 1st upper and lower indicator lines calculating.
Fibonacci Ratio 2 — a Fibonacci factor for the 2nd upper and lower indicator lines calculating.
Fibonacci Ratio 3 — a Fibonacci factor for the 3d upper and lower indicator lines calculating.
Use Reverse Buy — the strategy will use lower Bollinger bands instead of upper ones.
Fibonacci Buy — band selection for opening Long positions conditions.
Use Reverse Sell — the strategy will use upper Bollinger bands instead of lower ones.
Fibonacci Sell — band selection for opening Short positions conditions.
Style:
Basis — baseline color and style settings.
Upper 3 — the 3d upper line color and style.
Upper 2 — the 2nd upper line color and style.
Upper 1 — the 1st upper line color and style.
Lower 1 — the 1st lower line color and style.
Lower 2 — the 2nd lower line color and style.
Lower 3 — the 3d upper line color and style.
Background — the background color within the 3d upper and 3d lower indicator band.
Precision — the number of decimals for BB Fibo values.
Note! Try BB Fibo on your demo account first before going live.

Sideways Strategy DMI + Bollinger Bands (by Coinrule)Markets don’t always trade in a clear direction. At a closer look, most of the time, they move sideways. Relying on trend-following strategies all the time can thus lead to repeated false signals in such conditions.
However, before you can safely trade sideways, you have to identify the most suitable market conditions.
The main features of such strategies are:
Short-term trades, with quick entries and quick exits
Slightly contrarian and mean-reversionary
Require some indicator that tells you it’s a sideways market
This Sideways DMI + Bollinger Bands strategy incorporates such features to bring you a profitable alternative when the regular trend-following systems stop working.
ENTRY
1. The trading system requires confirmation for a sideways market from the Directional Movement Index (DMI) before you can start opening any trades. For this purpose, the strategy uses the absolute difference between positive and negative DMI, which must be lower than 20.
2. To pick the right moment to buy, the strategy looks at the Bollinger Bands (BB). It enters the trade when the price crosses over the lower BB.
EXIT
The strategy then exits when the move has been exhausted. Generally, in sideways markets, the price should revert lower. The position is closed when the price crosses back down below the upper BB.
The best time frame for this strategy based on our backtest is the 1-hr. Shorter timeframes can also work well on certain coins that are more volatile and trade sideways more often. However, as expected, these exhibit larger volatility in their returns. In general, this approach suits medium timeframes. A trading fee of 0.1% is taken into account. The fee is aligned to the base fee applied on Binance, which is the largest cryptocurrency exchange.
You can execute this strategy on your favourite exchange at coinrule.com.

Bollinger Bands And Aroon Scalping (by Coinrule)Many technical indicators can be profitable in certain market conditions while failing in others. No indicator is perfect alone.
All the best trading strategies involve multiple indicators and leverage the benefit of each of them. The following is an optimised strategy based on Bollinger Bands and the Aroon indicator.
The Bollinger Bands are among the most famous and widely used indicators. They can suggest when an asset is oversold or overbought in the short term, thus provide the best time for buying and selling it.
A strategy buying dips can work well during times of uptrend. Downtrends will result in a drawdown for the P&L of the strategy. The suggested approach minimises the drawdowns, ensuring that the system trades only when it's more likely to close the trade in profit.
The Setup
ENTRY
The price crosses below the basis line of the Bollinger Band indicator
The Aroon Indicator is above 90
EXIT
The price crosses below the upper Bollinger Band
The Aroon Indicator drops below 70
The Aroon Indicator plays a key role in this strategy. It acts as a confirmation that the asset is currently in an uptrend. On the other hand, it acts as a stop if market conditions deteriorate. The strategy uses an Aroon Indicator set to 288 periods to provide a longer-term view on market conditions, not being heavily dependent on short-term volatility.
The best time frame for this strategy based on our backtest is the 4-hr . The 1-hr can work well with three times more trades, on average. As trades increase, the profitability decreases. Yet again, this is the confirmation that trading more does not mean gaining more.
To make the results more realistic, the strategy assumes each order to trade 30% of the available capital. A trading fee of 0.1% is taken into account. The fee is aligned to the base fee applied on Binance, which is the largest cryptocurrency exchange.

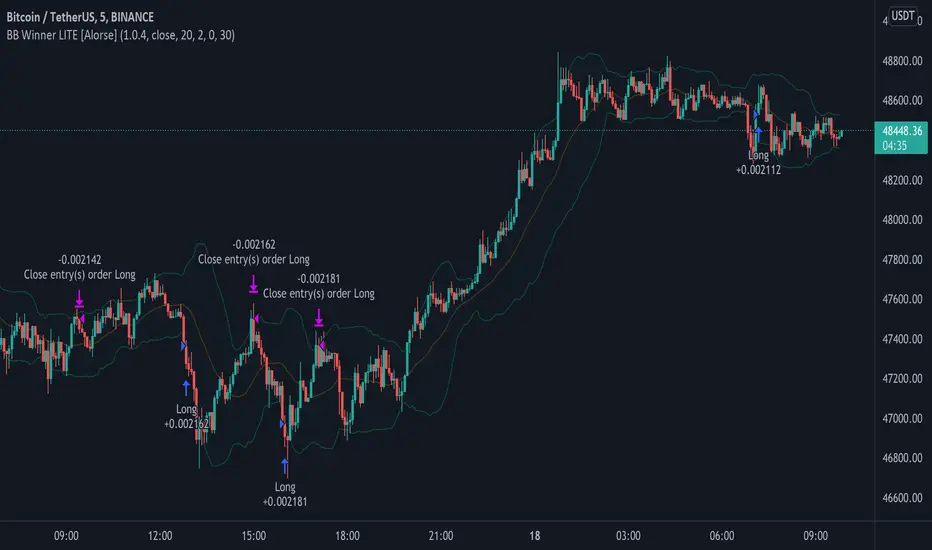
Bollinger Bands Strategy [Alorse]This is a highly effective strategy that is based on going against the micro trend when the price exceeds the Bollinger bands by X percentage.
The percentage set by default to 30%, you can change it from the indicator settings.
You also have the option of enabling or disabling Short entries.
Newton theory (Bollinger Band Breakout)Initial capital 1000 USD
Order size 10%
Commission 0.3% with slippage
Timeframe 4h
This is Simple Bollinger Band Trend find out strategy.
I'm using the usual trailing offset as an exit for this strategy.
using 1x leverage to go long short within 3years backtest result more then 200% for all usd pair.
in next version i will try to find out more optimize sma,std,sl,tp parameter by using freqtrade hyperparameter optimization.
Happy Trading :)

Khair - Day Trade StrategyBollinger band breakout with non-standard deviation along with profit targets
Best used when applied for intraday trading. Users can customize length and deviation and test what works best for them.
Trade both long and shorts, the user also has the option to limit to long-only or both.
This strategy only works intraday interval, so it means when you try to apply it to day/week/month it won't apply.

Bollinger bubble | Forex editionBollinger bubble is an edition for forex market. Work better en JPY pairs.
We buy when a candle open & close outside the lower bollingers band and we target the last highest point on the last 10 candles.
And we sell when a candle open & close outside the higher bollingers band we the target the last lowest point on the last 10 candles.

Bollinger bubble | Stock EditionBollinger bubble is an edition for market like CAC40, DJ30, ..
The market are uptrend with the inflation, this edition only buy (you have less risk then sell)
We buy when a candle open & close outside the lower bollingers band and we target the last highest point on the last 10 candles.

Bollinger Band with RSI
Using combination bollinger band and RSI indicator as guide to predict price volatility and the best entry point. The strategy logic is pretty straightforward where we're interested with close price that touches the lower bollinger band ; there are only two scenarios that will happened after the price reaches the lower band; the price might rebound from the lower bollinger band or drop lower and continue downtrend. To confirm the price movement, we use a second indicator which is the RSI to further investigate the price trend. For example, if the price reaches the lower bollinger band but the RSI value is not in the oversold region, we can conclude that the price will go lower and continue downtrend. If the RSI value is in the oversold region, we can use this price area as our entry point.
Stop loss is necessary to avoid losing too much capital if the RSI value lingers too long in the oversold region.
Best take profit area is when the price rebound above the middle bollinger band area/upper bollinger band or when the RSI reaches overbought region; whichever comes first.
Long entry:
RSI < 30 & close price < lower bollinger band
Exit entry:
RSI > 70
Default stop loss: -25%

Bollinger Bands Strategy with Intraday Intensity IndexFor Educational Purposes. Results can differ on different markets and can fail at any time. Profit is not guaranteed.
This only works in a few markets and in certain situations. Changing the settings can give better or worse results for other markets.
This is a mean reversion strategy based on Bollinger Bands and the Intraday Intensity Index (a volume indicator). John Bollinger mentions that the Intraday Intensity Index can be used with Bollinger Bands and is one of the top indicators he recommends in his book. It seems he prefers it over the other volume indicators that he compares to for some reason. III looks a lot like Chaikin Money Flow but without the denominator in that calculation. On the default settings of the BBs, the III helps give off better entry signals. John Bollinger however is vague on how to use the BBs and it's hard to say if one should enter when it is below/above the bands or when the price crosses them. I find that with many indicators and strategies it's best to wait for a confirmation of some sort, in this case by waiting for some crossover of a band. Like most mean reversion strategies, the exit is very loose if using BBs alone. Usually the plan to exit is when the price finally reverts back to the mean or in this case the middle band. This can potentially lead to huge drawdowns and/or losses. Mean reversion strategies can have high win/loss ratios but can still end up unprofitable because of the huge losses that can occur. These drawdowns/losses that mean reversion strategies suffer from can potentially eat away at a large chunk of all that was previously made or perhaps up to all of it in the worst cases, can occur weeks or perhaps up to months after being profitable trading such a strategy, and will take a while and several trades to make it all back or keep a profitable track record. It is important to have a stop loss, trailing stop, or some sort of stop plan with these types of strategies. For this one, in addition to exiting the trade when price reverts to the middle band, I included a time-based stop plan that exits with a gain or with a loss to avoid potentially large losses, and to exit after only a few periods after taking the trade if in profit instead of waiting for the price to revert back to the mean.

Bollinger Bands Breakout StrategyBollinger Bands Breakout Strategy is the strategy version of Bollinger Bands Filter study version, which can be found under my scripts page. The strategy goes long when price closes above the upper band and goes short signal when price closes below the lower band.
Bollinger Bands is a classic indicator that uses a simple moving average of 20 periods, along with plots of upper and lower bands that are 2 standard deviations away from the basis line. These bands help visualize price volatility and trend based on where the price is, in relation to the bands.
The strategy doesn't take into account any other parameters such as Volume / RSI / Fundamentals etc, so user must use discretion based on confirmations from another indicator or based on fundamentals. The strategy results are based on purely long and short trades and doesn't take into account any user defined targets or stop losses.
The strategy works great when the price closes above/below upper/lower bands with continuation on next bar. It is definitely useful to have this strategy or the Bollinger Bands filter along with other indicators to get early glimpse of breach/fail of bands on candle close during BB squeeze or based on volatility .
This can be used on Heikin Ashi candles for spotting trends, but HA candles are not recommended for trade entries as they don't reflect true price of the asset.
The strategy settings default is 55 SMA and 1 standard deviation for Bollinger Bands filter, but these can be changed from settings.
It is definitely worth reading the 22 rules of Bollinger Bands written by John Bollinger if interested in trading Bollinger Bands successfully.

Fibonacci Bollinger Bands Strategy [QuantNomad]This strategy is modified Stanard Bollinger Bands Strategy. Instead of using standard deviation, I use a metric of how big is the range for the last X bars. Also, I’m using Fibonacci levels as multipliers for BB.
In this strategy you have a choice of 3 different Trailing Stop Loss types:
Standard % – standard percent based TSL
Fibonacci Level – close your position on another Fibonacci level or basis line of BB.
Parabolic SAR – Parabolic SAR adapted as trailing stop loss.
For Standard % and Parabolic SAR, you can use the “TSL Offset” parameter to set an initial offset for trailing stop loss.
Parameters
BB Length – Bolinger Bands Length
Fib Entry Level – Entry BB Multiplier level. Can be one of Fibonacci levels: 0.236, 0.382, 0.5, 0.618, 0.786, 1.000
Trailing SL Type – Type of Trailing Stop Loss used to close positions. Can be one of 3 types: “Standard %”, “Fibonacci Level”, “Parabolic SAR”
TSL Offset (%) – Initial offset for TSL. Applicable to “Standard %” and “Parabolic SAR”
TSL Fib Level – Fibonacci level used for “Fibonacci level” type of TSL
TSL PSAR Start / Increment / Maximum – parameters for PSAR type of TSL.
Strategy side – you can choose the side of the strategy. You can require strategy to go only Long, Short to Both sides.
From/To Day/Month/Year – you can use these parameters to set backtesting range to check the performance of your strategy on a specific range
It's a pro indicator, you can have access to it for a small fee. Link to my PRO indicators you can find in my signature.
Disclaimer
Please remember that past performance may not be indicative of future results.
Due to various factors, including changing market conditions, the strategy may no longer perform as good as in historical backtesting.
This post and the script don’t provide any financial advice.

Bollinger Band BreakoutIt is a long only strategy.
1. Buy when price breaks out of the upper band.
2. Exit has two options. Option 1 allows you to exit using lower band. Option 2 allows you to exit using moving average.
3. Option 1 preferred over option 2 if the instrument is highly volatile.
4. Slippage and commissions are not considered in the return calculation.


Bollinger_Bands_Strategy(Add Function) - BB Free (By Wolf)전략 및 지표 얼러트등 파인스크립트 제작 문의 - 트레이딩뷰 메시지
Contact to create strategy and indicators add alert etc - TradingView Message
이름(Name)
Bollinger Bands Strategy (Add Function) (By Wolf)
-해당 전략은 Long & Short 의 신호를 발생시키는 전략입니다.
-The strategy is to generate a signal from Long & Short
기능 추가(Add Function)
-Trade Direction Long
-Trade Direction Short
-Stoploss ($)
-Profit target($)
-Backtest date
해당 전략은 수익률이 높은값으로 임의로 변경해놓았습니다
본인의 투자전략에 맞는 수치로 변경하여 사용하셔도 좋습니다.
*I entered the value with good profits settings for the strategy.
You can use this customarily
소스코드(Source code)
-비공개 (not open to the public)
*모든 전략은 리페인트 코드를 등록하지않았습니다.
-All strategies do not register the repaint code
*모든 전략 및 지표의 백테스트 결과는 BITMEX Fee 0.075% 를 입력한 결과값입니다.
-The back test result for all strategies and indicators is the result of inputting BITEX Fee 0.075%
*모든 거래는 높은 위험을 수반하며, 과거 백테스트 결과가 반드시 현재 및 미래의 결과를 나타내는것은 아닙니다.
가상 또는 시뮬레이션 백테스트 결과는 한계를 가지고 있으며 실제거래와 시장의 변동 및 유동에 따라 똑같지않을
가능성이있으며, 모든 손실에 대한 책임은 본인에게 있습니다.
-All trade involve high risk, and past backtest results do not necessarily represent current and future results.
Virtual or simulated backtest results have limitations and are not consistent with actual transactions and market changes and flows
It is possible and you are responsible for any loss.

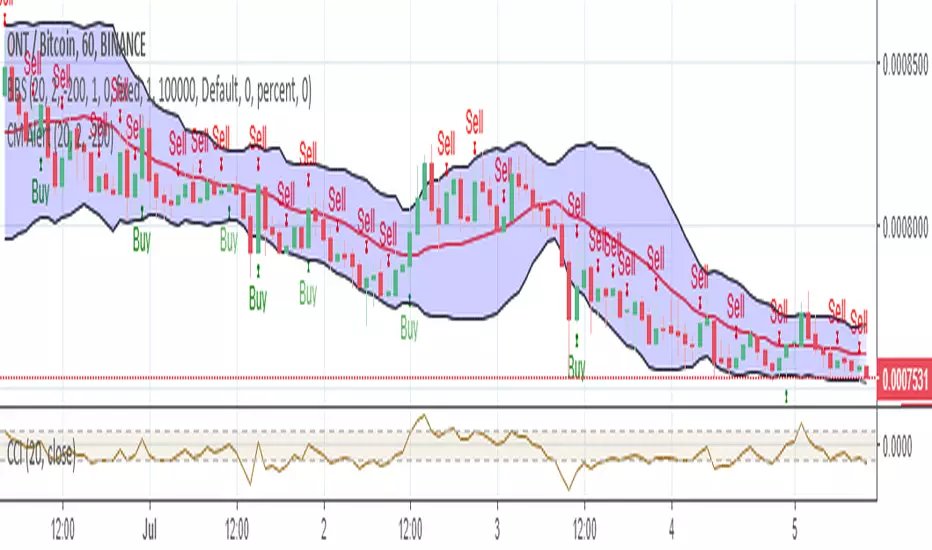
Bollinger Bear SniperThis script uses Bollinger Band but with different interpretation. The upper Bollinger Band is the resistant level, the lower Bollinger Band is the base or support level. The Commodity Channel Index (CCI) and the Bollinger Bandwidth helps us avoid high risk.
The script identifies candles that are marking bold upward moves in prices and fires buy signal. Sales signals are fired when the candle closes in positive. The idea is to buy and sell on the same candle or next positively closed candle. This is anti-bear-anti-bags strategy. You either make profit or loss holding no bag. When you gain more than lose you are in business. This script is set to gain more than lose. We however offer no guarantee, expressed or implied. We are NOT responsible.
Moving Average Cross and/or Bbands botHello TradingView and world!
This is one of our latest concepts for an actual bot builder. This script comes with a bunch of features that we're hoping will alleviate a lot of the stress and confusion around using and building strategies here on TV. Especially if the end-goal is to automate the strategies using Autoview.
This is a combination of 2 strategies, and gives you full control of each component within the script.
The 2 strategies are:
2 Moving Averages == if close is greater than moving average and moving average 1 is greater than moving average 2
Bolling Bands == if close is less than lower or greater than upper
Features / Settings included :
- Ability to change settings from a commodity market (default) to an altcoin or forex market.
- Backtest time period selector component
- Heiken Ashi Candles on/off
- Moving Average Strategy on/off
- Bollinger Bands Strategy on/off
- Both Moving Average settings can be adjusted
- Bollinger Bands length and multiplier can be adjusted.
- Pyramiding Greater Than, Equal To, or Less Than
- Trailing Stop with the ability to set a price in which the Trailing Stop activate
- Take Profit on/off and editable
- Stop Loss on/off and editable
- Margin Call on/off dependent on Leverage which is editable
- If pyramiding is used, the strategy will calculate and display your average on the chart
- Profit and Loss visuals added to the chart
You can watch a video here on how all the settings can be used and work together.
www.youtube.com
You can learn more about Autoview here:
autoview.with.pink
Get your invite and join us in slack here:
slack.with.pink

Double Bollinger Bands StrategyDouble Bollinger Strategy. Price crosses inner BB (with increasing outer BB) long is placed. Long is closed when price closes below outer BB. Reversed for short. The numbers are tuned for NZDUSD 15min chart.
Pbin = percent on inner BB
Pbout = percent on outer BB
There are all kinds of other inputs, trailing stop, limit, etc.
Errors, questions, suggestions are wanted, thank you
