Breakout Candles V2Enhanced Breakout Candles indicator. On top of existing Breakout Candles, this also identifies stop and target distance based on trend.
Breakouts

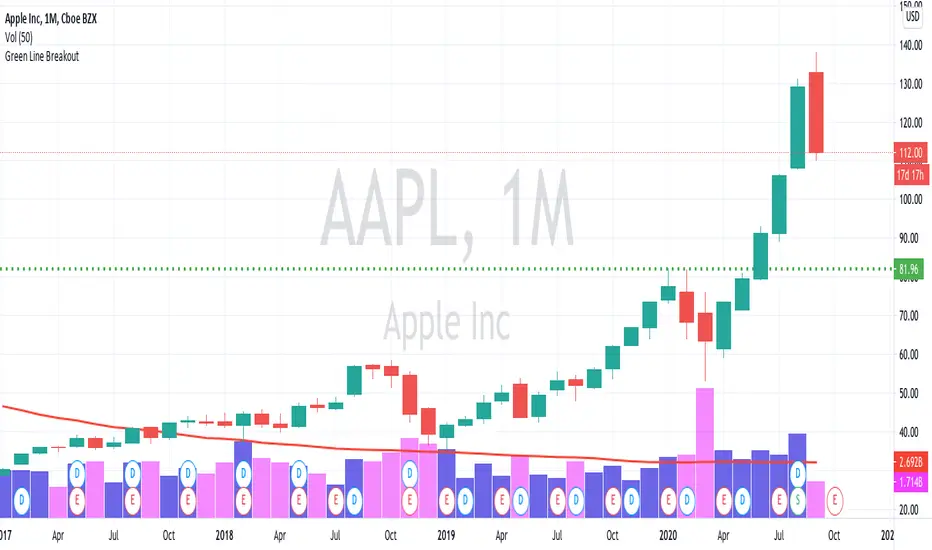
Green Line Breakout (GLB)This is an implementation of Green Line Breakout (GLB) which is popularized by Eric Wish through his Wishing Wealth Blog.
GLB indicator looks at a monthly chart for a stock that hit a new all time high recently and draw a green horizontal line at the highest price reached at any month, that has not been surpassed for at least 3 months.
In other words, this method finds stock that reached an all-time high and has then rested for at least three months. When a stock moves through the green line or is above its last green line, it is an indication of strong buying interest.
Read more about how to use the indicator in Wishing Wealth Blog.
Usage Explanation:
1. Set the time frame to Monthly for a stock and automatically a green dashed line appears based on the calculation explained above
2. If no GLB found for a stock, then green line appears at 0.0
2. If you set any other time frame other than Monthly, no Green Dashed line shown
ETS Breakout LevelsThis indicator mimics the breakout levels a professional trader would draw and watch for trading opportunities. It is a very powerful tool to have.
The lines are drawn as soon as a new breakout level is detected, and the line is then automatically extended to the right, making it easy to see when the market reacts to it.
Knowing where important levels on a chart are, immediately takes you from having no idea where the market might make a big move, to being a trader ready to take action at the right time.
The Breakout Levels indicator is also very good at keeping you out of the market when it's simply choppy and difficult to trade, because the breakout levels will most likely fall outside of the choppy sideways consolidation area, but still prepare you for when the market finally picks a direction again.
This indicator also includes colored time bands that mark times during the trading day where historically stocks often reverse course, or may enter a period of consolidation. These times coincide with tea breaks, lunch breaks or times when news are typically announced.
For Forex traders, there are colored session bands that help you to easily see when the major markets are open.
What Makes It So Powerful?
- Give you a signal as early as possible and does not "repaint" once the bar completes
- Reacts to fast market direction changes like a master trader
- Is super easy to understand and implement in your trading
- Can be used for Forex, Stocks and Crypto
- Works on all timeframes
This indicator also has a number of options you can change in Settings:
1. "Safety Margin" - I keep this at zero, but if you want a bigger "buffer" for safety before entering a trade you can increase this value.
2. "Hidden Above Interval (Minutes)" - The Forex sessions or Stock important daily times can be set to be hidden above a certain timeframe to keep your charts clean.
3. "Show Moving Averages" - All of the moving averages that are included for convenience can be shown or hidden by setting this value.
3.1. The next 5 settings all deal with moving averages that can be shown or hidden individually.
4. "Show Stock Pivot Times" - There are a number of trading times for US Stocks that are important during the trading day, and this setting will highlight them.
4.1. "Show Main Stock Pivot Times" - This shows only the Stock trading times that are deemed the most important, and around these times the market often change direction (e.g. after the morning break, after lunch, etc.)
5. "Show Forex Sessions" - Does pretty much what it says, and you can also adjust the hours if you wish.
6. "Extreme Move Reversal Points" - If an extreme market move has been detected, and this is enabled, a "X" will be shown above or below the bar to indicate that the market might reverse.
7. "More Signals" - If you want to see more potential breakout levels, enable this option.
8. "Show VWAP" - This will include the VWAP indicator as a convenience if selected.
How To Use the ETS Breakout Levels Indicator
1. Add the indicator to any chart you wish to trade, Crypto, Forex or Stocks and set it to the timeframe you prefer. For instance, I use it on 1 minute and 5 minute charts for daytrading Stocks. For Forex I generally use a 15 minute chart, and longer timeframes for Crypto.
2. Open the Settings and change values to suit your requirements as described above.
3. When the indicator has determined that a new breakout level has formed, it will draw a line and extend it to the right so that you can see when future bars come close to it.
4. Price action will either bounce off it, or pierce through it and continue on.
5. If the market is relatively far away from smaller moving averages such as the 9 EMA or 20 EMA, expect that the price action might first move back to the moving averages before continuing in the new direction identified by the indicator.
6. When these levels are broken, it is often an indication of a breakout occurring and it can give you some very significant market moves.
This is an "invite only" script, which means that you will need to let me know that you're interested in it before you can get access to it. This is a paid script, please follow the link in my profile to get the details or ask me directly. It may take up to 48 hours for me to respond, but I do my best to respond as quickly as possible. You will get 7 days to test it for yourself on all your charts with no restrictions.

MedianBandsHere I propose another simple S/R band technique, works on all TF and all securities, this is again one of the simplest forms of logic with a little tweak to tackle modern volatile markets.
It enables us to trade both mean reversion as well as breakout trades as it works in both trending and non-trending markets. You can even use pre-existing ranges as good position management markers.
It requires little to no intervention from the user. The white line is the opening price of the day, I'm a big believer of that so you will find it everywhere in my indicators. :3
Past performance is not assurance of the future performance and this is for educational purposes only.
The script will be protected to avoid theft but you can add to your favorites to use it as you please.
Enjoy~

Zays emaHey, as the creator of “zays ema” I’m proud to have coded such an indicator with much potential ,this indicator, unlike many, references a moving average on a lower time frame, and when applied to a chart you’ll see that when price is either above or below this moving average it will always return back to base to acquire equity, I use that term in full to the fact that, when price is on this moving average it will either consolidate for a period of time or react violently to the upside or downside. This is to be used as a conformation indicator For any other implemented strategy. thank you for your time, have fun :).

Consolidation Zones - LiveHello Traders!
This is the script that finds Consolidation Zones in Realtime.
How it works?
- The script finds highest/lowest bars by using "Loopback Period"
- Then it calculates direction
- By using the direction and highest/lowest bar info it calculates consolidation zones in realtime
- If the length of consolidation area is equal/greater than user-defined min length then this area is shown as consolidation zone
- Then Consolidation Zone extends automatically if there is no breakout
if you increase the Loopback Length then you get bigger consolidation zones:
You have option to "Paint Consolidation Area" or not:
Enjoy!

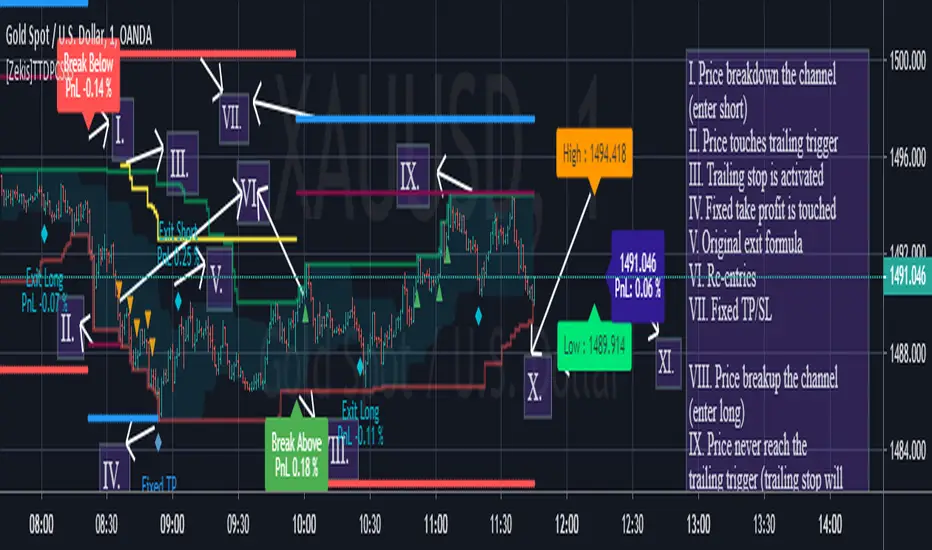
[Zekis]Turtle Trading Donchian Price Channels StrategyOne of the most famous strategy in the history of trading, #Turtle strategy have numerous legends, one of them is using Donchian Price Channels with 55 period for entries and 20 period for exits.
Can be used with any time frame
Added alerts
I added re-entries and re-exits for more scalps or for laddering trading.
Also you can modify parameters for entries and exits for your market needs.
Trade safe!
@Zekis
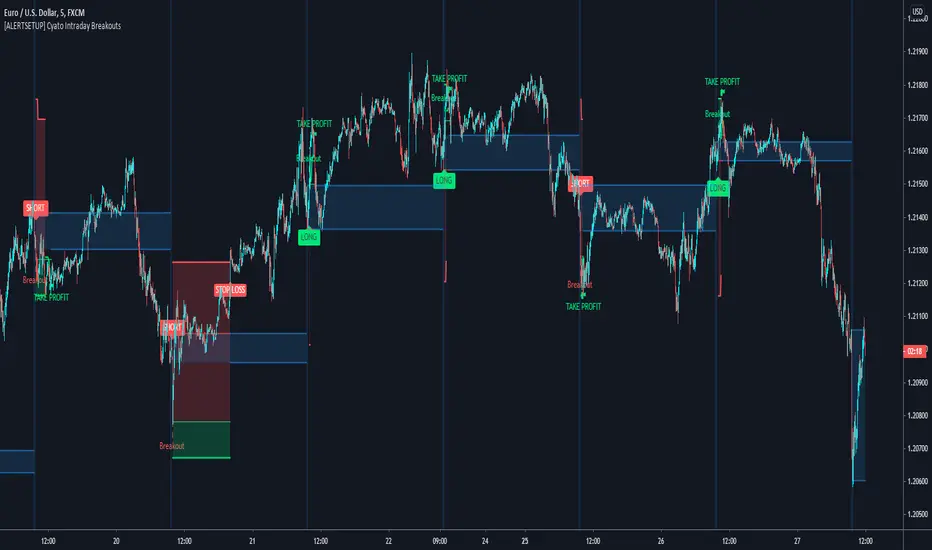
Cyatophilum Intraday Breakouts [ALERT SETUP]Private indicator.
Here is the alert version of the Triple Screen Strategy
Recap of the strategy:
The goal of this indicator is to be able to automate and backtest the strategy, all while staying on a single chart and without repainting.
Features:
Market Tide MACD configuration
Market Wave choice between 3 oscillator: Elder Force Index, Stochastic and William Percent Range
Automated Long and Short entries alerts
Integrated Trailing Stop Loss system fully configurable with automated exit alerts
Integrated Trailing Take profit system fully configurable with automated exit alerts
Indicator samples
Backtest version:
Alerts
Entry Long: Triggers on green long labels.
Take Profit Long: Triggers on the "TAKE PROFIT" green flag if the long target is reached.
Stop Loss Long: Triggers on the "STOP LOSS" or "TSSL" label if the stop loss line has been crossed.
Exit Long: Triggers on either of Take Profit Long or Stop loss long.
Entry Short: Triggers on red short labels.
Take Profit Short: Triggers on the "TAKE PROFIT" green flag if the short target is reached.
Stop Loss Short: Triggers on the "STOP LOSS" or "TSSL" label if the stop loss line has been crossed.
Exit Short: Triggers on either of Take Profit Short or Stop Loss Short.
To get access to this indicator use the link below
Thanks for reading!
Cyatophilum Intraday Breakouts [BACKTEST]Private indicator. Access can be unlocked by purchasing a subscription on my website which link is in my profile signature.
Here is the backtest version of the Triple Screen Strategy
Recap of the strategy:
The goal of this indicator is to be able to automate and backtest the strategy, all while staying on a single chart and without repainting.
Features:
Market Tide MACD configuration
Market Wave choice between 3 oscillator: Elder Force Index, Stochastic and William Percent Range
Automated Long and Short entries alerts
Integrated Trailing Stop Loss system fully configurable with automated exit alerts
Integrated Trailing Take profit system fully configurable with automated exit alerts
Indicator samples
Backtest
Strategy time period can be choosen in the parameters of the indicator.
Be aware that the chart is limited to 10 000 candles of the current timeframe for the backtest calculation.
Default initial capital: 10 000$
Default order size: 100% of equity
Default commission fees: 0.1% per transaction
Backtest results below.
Alerts
Entry Long: Triggers on green long labels.
Take Profit Long: Triggers on the "TAKE PROFIT" green flag if the long target is reached.
Stop Loss Long: Triggers on the "STOP LOSS" or "TSSL" label if the stop loss line has been crossed.
Exit Long: Triggers on either of Take Profit Long or Stop loss long.
Entry Short: Triggers on red short labels.
Take Profit Short: Triggers on the "TAKE PROFIT" green flag if the short target is reached.
Stop Loss Short: Triggers on the "STOP LOSS" or "TSSL" label if the stop loss line has been crossed.
Exit Short: Triggers on either of Take Profit Short or Stop Loss Short.
You can get access to this indicator by purchasing a subscription using the link below.
Thanks for reading!

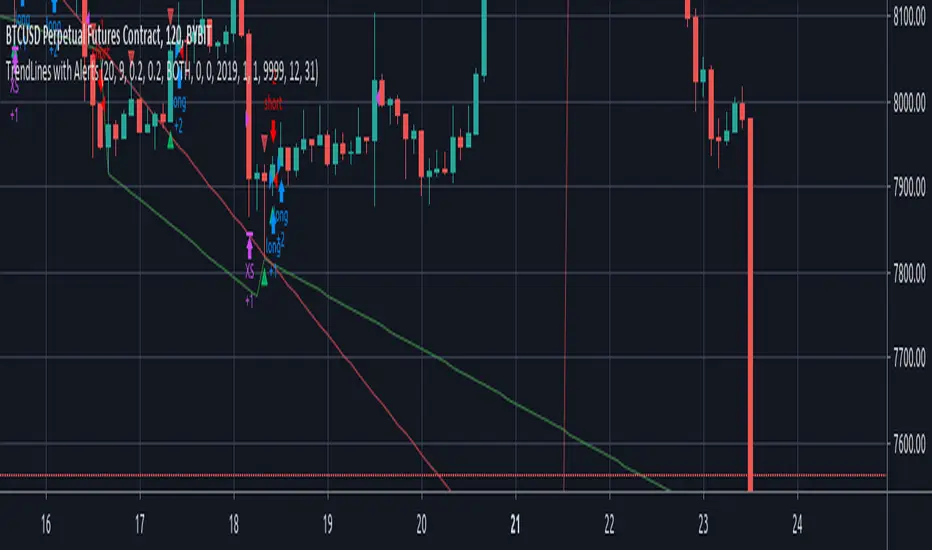
TrendLines with AlertsThis isn't my own work, hence giving it in Open Source library for others to benefit from it too.
I have tried to refin the output of trendlines in this Strategy
The original Code is available at
The script needs some modifications, so I'll be making further updates in future, but for now I'm publishing this because most people don't know how to track trandlines, moreover, some use Line.New() by tradingview Pinescript, which again is a bit difficult to deal with.
This script is a basic version of trendlines on a certain angle (anglecheck was provided by the original author in his script).
Nothing fancy in this script.
Also Converted the original Script to Pinescript v4.
(TBO) Trending Break OutTBO (Trending Break Out) is an indicator designed to help identify trends within the markets. Users are able to see trend continuations and potential trend reversals. Potential breakouts are also shown as trend strength increases or decreases. There are buy signals and short signals included as well. Clouds show underlying support or resistance areas and potential changes in trend strength. Pivots show resistance and support as well.
-Brought to you by Drungle_OG and MooninPapa (YouTubes)

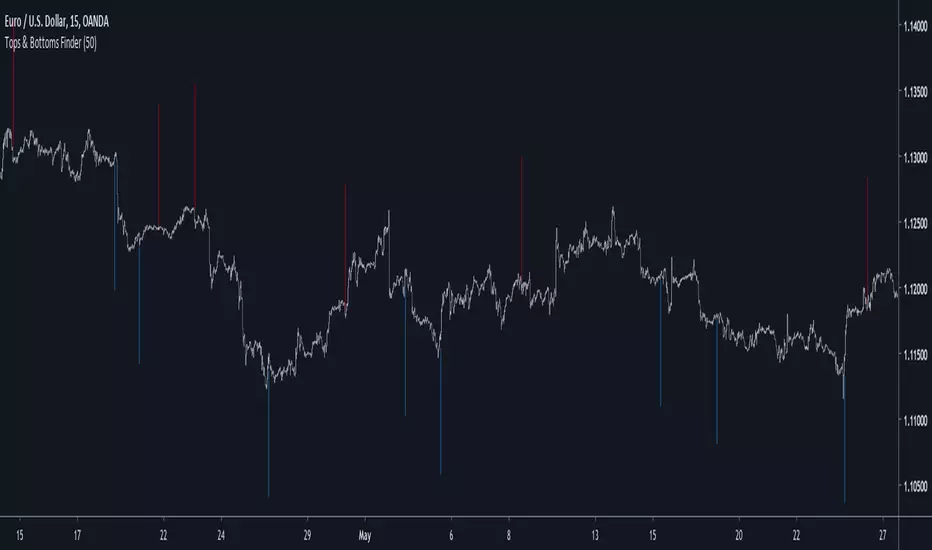
Tops & Bottoms FinderIntroduction
I already shared a method to estimate tops and bottoms (1), the number of parameters could lead to optimization issues so i tried to make a simpler method. In this method i use a simple rescaling method based on individual direction deviation. I will explain further details below.
The Indicator
I use as source for the entire calculation an exponential moving average, the first reaction to this choice would be to think that i wanted to filter signals in order to reduce them, but the truth is that i wanted to have more signals instead, this is because the first calculations involving standard deviations are based on price direction, so by using a smooth input we can get more persistent values in a and b , but its totally up to you to use whatever you want in a , just take into account that less smooth = less signals, this is why i used this calculation process.
a = close and length = 7
a = least squares moving average and length = 25
So you could use pretty much everything you want as input.
Conclusion
The accuracy of such indicators is still relatively low but i presented a way to estimate tops and bottoms without using highest/lowest or differencing thus creating a totally new approach. I encourage you to experiment with it and share your results. If you learned something with this post then i'am happy :)
Notes
Based on several complaints i will have to leave even sooner, i think the 7 of June will be a good day, so if you need something i encourage you to ask me now. With the hope you can understand.
Thanks for reading !
(1)
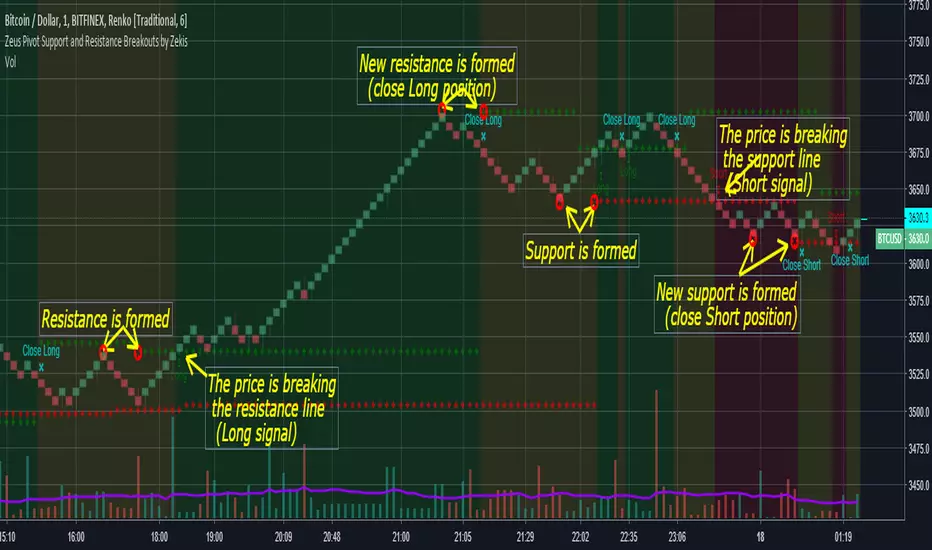
Zeus Pivot Points Support and Resistance Breakouts by ZekisZeus Pivot Support and Resistance Breakouts by Zekis
Is an indicator with big results, it forms new support /resistance according to the last higher high or lower low (it prints new ones only if it breaks through the last one)
Rules:
- enter Long or Short when the support or resistance is craked
- exit when new support or resistance is starts to form
Alerts for entries and exits
A moving average is added to filter signals (leave it at 1 for price close signals)
Bar colors can be added to see longs, shorts or no position
Background colors for longs, shorts or no position
Enjoy!
@Zekis
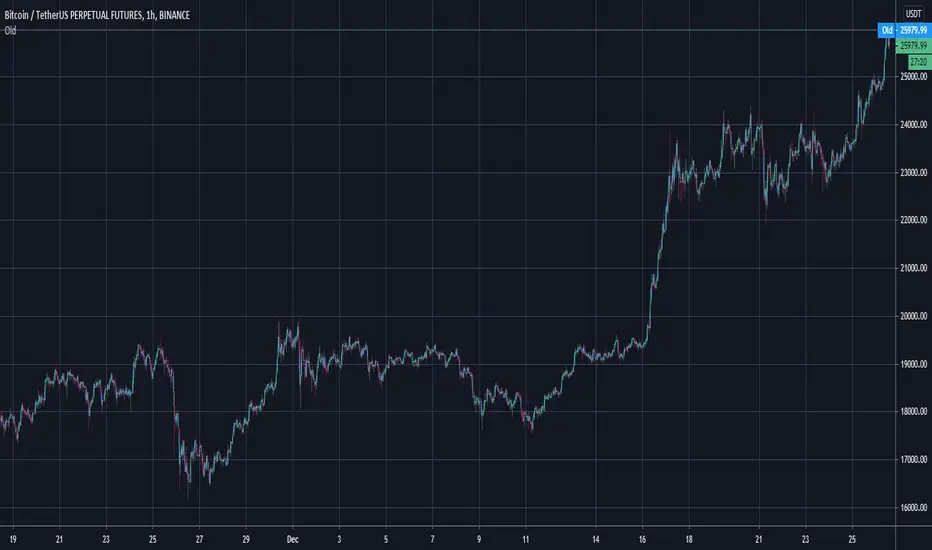
QFT Crypto Bottom FeederQFT Crypto Bottom Feeder
This indicator is intended to be used with alerts and Autoview for buy signals. I do not have sell signals enabled at the moment. The goal is to catch the bottoms of markets swings. I use this for 1,3 and 5 min charts for small %s. You can adjust the base sensitivity as well as how far down it's looking to buy. Defaults are 3 candles for bases/resistance, .20% below base for buys. The buy plots are absolute locations - so where they lie, is where the buy signal will execute.
Volume BreakoutsThe aim of this indicator is to indicate effective volume breakouts.
Blue = Volume is at least 25% above the 20d moving average
Purple = Volume is at least twice as much as the 20d moving average
Red = Volume is at least three times the average
My recommendation : Always watch for breakouts on large volume. That's a sign that big institutions are buying.

FIRST 5-MINUTES ZONE AND HI-LO BRKOUTS..!FIRST 5-MINUTES ZONE
--------------------------------
This script displays the first 5-Minutes high and low range zone and shades in gray color for identification of the zone.
HIGH - LOW BREAKOUT
----------------------------
As we all know that a stock's best breakout level is its previous day's high or low. Hence I designed the script to automatically draw a line when the LTP is near or crossing Previous day's high or Low price, so that we can be sure in taking trading decisions.
And added 30-EMA also
PR.HIGH BREAKOUT
------------------------
PR.LOW BREAKOUT
------------------------
- hope this may be a little help for you traders for taking decisions.
- HAPPY WEALTHY TRADING
cheers
SANJAY RAMANATHAN

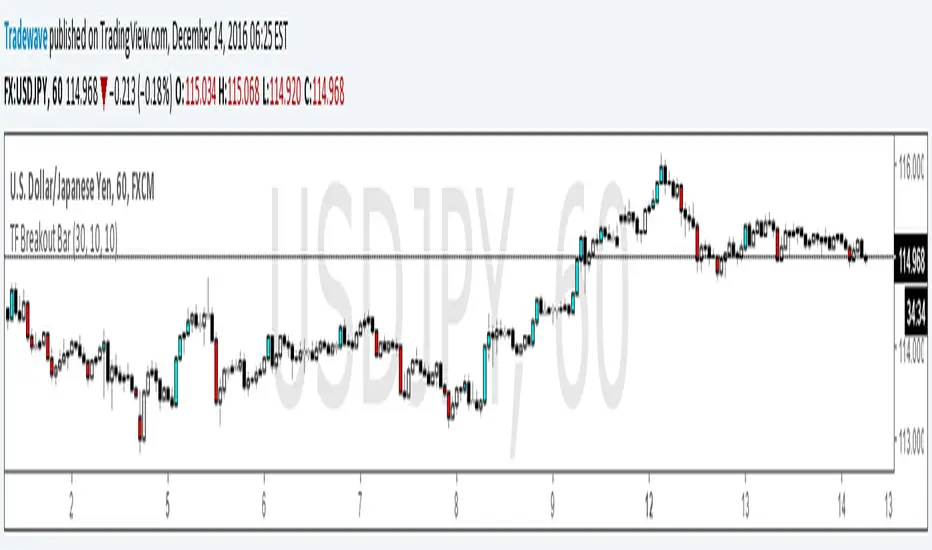
TF Breakout BarIndicator Name: TF Breakout Bar
Creator: Andrew Palladino
Date: 12/14/2016
The TF Breakout Bar allows the user to check for a breakout or a breakdown on a specific time frame regardless of what time frame resolution the current chart is on.
The user can change the following:
Breakout and Breakdown time frame
Lookback bar period for breakouts
Lookback bar period for breakdowns