Dark Cloud [TradingFinder] Piercing Line Reversal chart Pattern
🔵 Introduction
"Reversal candlestick patterns" are among the Japanese candlestick patterns considered as alerts for a potential change in the current price trend. It is often assumed that by identifying reversal candlestick patterns, the price trend will definitely change, either from bullish to bearish or from bearish to bullish. However, this claim is not entirely accurate, and a change in price trend does not always mean a reversal.
Nonetheless, the importance of reversal candlestick patterns remains significant. By recognizing these patterns, you can better predict changes in the trend with higher probability and make better trading decisions.
🔵 Dark Cloud
The "Dark Cloud" pattern occurs when, after an upward trend, buyers continue to drive the price up in the first candle. However, in the next candle, with sellers entering and increasing selling pressure, the price starts to decrease compared to the close of the previous candle.
This price decrease is significant enough that in the last candle, the price goes lower than the open of the previous candle, serving as a warning sign for a potential change in price trend.
The fundamental principles for the formation of the "Dark Cloud" pattern include :
1.Two candles consisting of a positive candle (first candle) and a negative candle (second candle) whose main body should be above the halfway point of the first candle's main body but does not completely cover it.
2.The color of the main body of the second candle should be opposite to the color of the main body of the first candle.
Factors affecting the strength of the "Dark Cloud" pattern include :
1.The length of the bodies of both candles, especially the second candle, which increases the strength of the pattern.
2.The gap between the two bodies can also indicate the strength of the pattern.
3.The absence of a lower shadow in the second candle also indicates the strength of the pattern.
4.If the pattern forms in a price resistance range, it has more strength.
🔵 Piercing Line
The "Piercing Line" pattern occurs when, after a downward trend, sellers decrease the price by offering their shares on the first day. However, on the next day, with buyers entering and increasing demand, the price starts to increase compared to the close of the previous day.
This increase is significant enough that in the last candle, the price goes higher than the open of the previous day, serving as a warning sign for a reversal in the price trend. Overall, this pattern is the opposite of the "Dark Cloud" pattern and occurs under a bearish trend.
The fundamental principles for the formation of the "Piercing Line" pattern include :
1.Two candles consisting of a negative candle (first candle) and a positive candle (second candle) whose main body should be above the halfway point of the first candle's main body but does not completely cover it.
2.The color of the main body of the second candle should be opposite to the color of the main body of the first candle.
Factors affecting the strength of the "Piercing Line" pattern include :
1.The length of the bodies of both candles, especially the second candle, which increases the strength of the pattern.
2.The gap between the two bodies can also indicate the strength of the pattern.
3.The absence of an upper shadow in the second candle also indicates the strength of the pattern.
4.If the pattern forms in a price support range, it has more strength.
🔵 How to Use
The "green circle" symbol corresponds to the "Strong Piercing Line" signal, the "blue triangle" symbol corresponds to the "Weak Piercing Line" signal, the "red circle" symbol corresponds to the "Strong Dark Cloud" signal, and the "red triangle" symbol corresponds to the "Weak Dark Cloud" signal.
🔵 Setting
Using the "Show Dark Cloud" and "Show Piercing Line" buttons, you can enable or disable the display of Dark Cloud and Piercing Line.
Candle

CandleStick [TradingFinder] - All Reversal & Trend Patterns🔵 Introduction
"Candlesticks" patterns are used to predict price movements. We have included 5 of the best candlestick patterns that are common and very useful in "technical analysis" in this script to identify them automatically. The most important advantage of this indicator for users is saving time and high precision in identifying patterns.
These patterns are "Pin Bar," "Dark Cloud," "Piercing Line," "3 Inside Bar," and "Engulfing." By using these patterns, you can predict price movements more accurately and therefore make better decisions in your trades.
🔵 How to Use
Pin Bar : This pattern consists of a Candle where "Open Price," "Close Price," "High Price," and "Low Price" form the "Candle Body," and it also has "Long Shadow" and "Short Shadow." In the visual appearance of the Pin Bar pattern, we have a candle body and a pin bar shadow, where the candle body is smaller relative to the shadow.
Just as the candle body plays an important role in analysis, the pin bar shadow can also be influential. The larger the pin bar shadow, the stronger the expectation of a trend reversal.
When a "bearish pin bar" occurs at resistance or the chart ceiling, it can be predicted that the price trend will be downward. Similarly, at support points and the chart floor, a "bullish pin bar" can indicate an upward price movement.
Additionally, patterns like "Hammer," "Shooting Star," "Hanging Man," and "Inverted Hammer" are types of pin bars. Pin bars are formed in two ways: bullish pin bars have a long lower shadow, and bearish pin bars have a long upper shadow. Important: Displaying "Bullish Pin Bar" is labeled "BuPB," and "Bearish Pin Bar" is labeled "BePB."
Dark Cloud : The Dark Cloud pattern is one type of two-candle patterns that occurs at the end of an uptrend. The 2-candle pattern indicates the shape of this pattern, which actually consists of 2 candles, one bullish and one bearish. This pattern indicates a trend reversal and is quite powerful.
The Dark Cloud pattern is seen when, after a bullish candle at the end of an uptrend, a bearish candle opens at a higher level (weakly, equal, or higher) than the closing point of the bullish candle and finally closes at a point approximately in the middle of the previous candle. In this indicator, the Dark Cloud pattern is identified as "Wick" and "Strong" .
The difference between these two lies in the strictness of their conditions. Important: Strong Dark Cloud is labeled "SDC," and Weak Dark Cloud is labeled "WDC."
Piercing Line : The Piercing candlestick pattern consists of 2 candles, the first being bearish and consistent with the previous trend, and the second being bullish. The conditions of the pattern are such that the first candle is bearish and a price gap is created between the two candles upon the opening of the next candle because its opening price is below (weakly equal to or less than) the closing price of the previous candle.
Additionally, its closing price must be at least 50% above the red candle.
This means that the second candle must penetrate at least 50% into the first candle. Important: Strong Piercing Line is labeled "SPL," and Weak Piercing Line is labeled "WPL."
3 Inside Bar (3 Bar Reversal) : The 3 Inside Bar pattern is a reversal pattern. This pattern consists of 3 consecutive candles and can be either bullish or bearish. In the bullish pattern (Inside Up) formed at the end of a downtrend, the last candle must be bullish, and the third candle from the end must be bearish.
Additionally, the close price must be more than 50% of the third candle from the end. In the bearish pattern (Inside Down) formed at the end of an uptrend, the last candle must be bearish, and the third candle from the end must be bullish. Additionally, the close price must be less than 50% of the third candle from the end. Important: Bullish 3 Inside Bar is labeled "Bu3IB," and Bearish 3 Inside Bar is labeled "Be3IB."
Engulfing : The Engulfing candlestick pattern is a reversal pattern and consists of at least two candles, where one of them completely engulfs the body of the previous or following candle due to high volatility.
For this reason, the term "engulfing" is used for this pattern. This pattern occurs when the price body of a candle encompasses one or more candles before it. Engulfing candles can be bullish or bearish. Bullish Engulfing forms as a reversal candle at the end of a downtrend.
Bullish Engulfing indicates strong buying power and signals the beginning of an uptrend. This pattern is a bullish candle with a long upward body that completely covers the downward body before it. Bearish Engulfing, as a reversal pattern, is a long bearish candle that engulfs the upward candle before it.
Bearish Engulfing forms at the end of an uptrend and indicates the pressure of new sellers and their strong power. Additionally, forming this pattern at resistance levels and the absence of a lower shadow increases its credibility. Important: Bullish Engulfing is labeled "BuE," and Bearish Engulfing is labeled "BeE."
🔵 Settings
This section, you can use the buttons "Show Pin Bar," "Show Dark Cloud," "Show Piercing Line," "Show 3 Inside Bar," and "Show Engulfing" to enable or disable the display of each of these candlestick patterns.

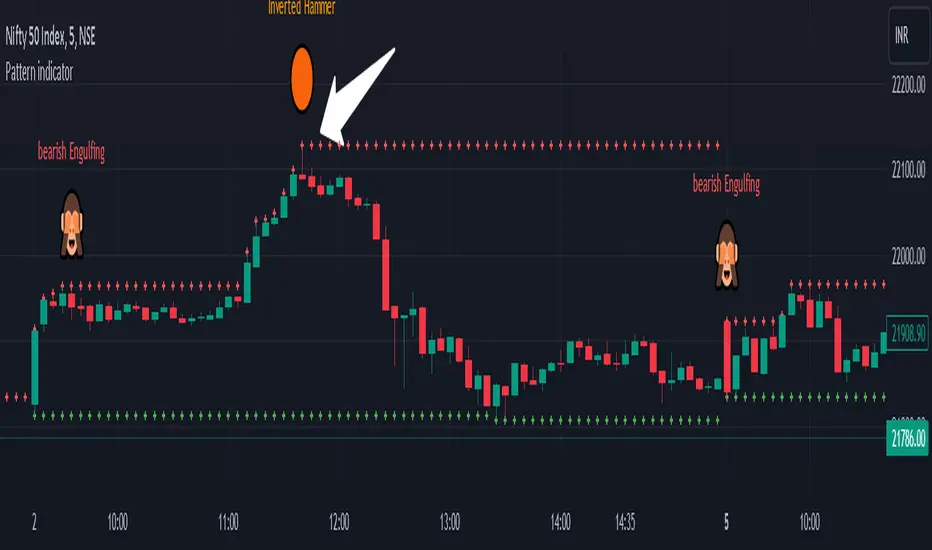
Pattern indicatorRules are pretty simple for this indicator .we are searching candlestick pattern on current day high and low ..
*** Candlestick we are looking for ***
1) Bullish/Bearish Engulfing 2) Bearish/Bullish Harami 3)Hammer/Inverted Hammer
Rule for searching bullish candlestick ====>
1) searching for current day high and day low
2) looking for candlestick as Bullish Engulfing or Bullish Harami or Hammer
3) if we got both rule 1 and rule 2 we are getting label ex- bullish engulfing
4) we can Enable/Disable Candlestick we don't want to search
Rule for bearish candles ====>
1) searching for current day high and day low
2) looking for candlestick as Bearish Engulfing or Bearish Harami or inverted hammer
3) if we got both rule 1 and rule 2 we are getting label ex- bullish engulfing
4) we can Enable/Disable Candlestick we don't want to search
Note -- i have created all indicator calculation ....
Disclaimer: market involves significant risks, including complete possible loss of funds. Consequently trading is not suitable for all investors and traders. By increasing leverage risk increases as well.With the demo account you can test any trading strategies you wish in a risk-free environment. Please bear in mind that the results of the transactions of the practice account are virtual, and do not reflect any real profit or loss or a real trading environment, whereas market conditions may affect both the quotation and execution
Candlesticks Patterns [TradingFinder] Pin Bar Hammer Shooting🔵 Introduction
Truly, the title "TradingView" doesn't do justice to this excellent website, and that's why I've written about its crucial aspect. In this indicator, the identification of all candlesticks known as "Pin bars" is explored.
These candlesticks include the following:
- Hammer : A Pin bar formed at the end of a bearish trend, with its body being either bearish or bullish.
- Shooting Star : Formed at the end of a bullish trend, with its body being either bearish or bullish.
- Hanging Man : Formed during an upward trend, characterized by a candle with a lower shadow.
- Inverted Hammer : Formed during a downward trend, characterized by a candle with an upper shadow.
🟣 Important : For ease of use, we refer to these four candlestick patterns as Pin Bars and categorize them into the main friends "Bullish" and "Bearish."
🟣 Important : In all sources, Hanging Man and Inverted Hammer are referred to as "Reversal candles." However, in reality, whenever they appear after breaking a significant area (Break Out), we expect these candles to signal a continuation of the trend and confirmation in the direction of the trend.
🟣 Important : One of the best signs of market manipulation and entry by market giants is the "Ice Berg." So, it provides one of the best trading opportunities.
🔵 Reason for Creation
Many traders, especially volume traders, use Pin bars as confirmation and enter the market after their occurrence. In this indicator, all four patterns are identified and displayed in a colored candle format, using "triangle" and "circle."
When they are evident on the chart, directly or by drawing a horizontal line, they give us good alerts for reversal or continuation areas.
🔵 Information Table
1. Red circle: Pin bars formed in a downtrend.
2. Blue circle: Bullish Pin bars formed in an uptrend.
3. Black triangle: Bearish Pin bar candle in an uptrend.
4. Blue triangle: Bullish Pin bar candle in a downtrend.
🔵 Settings
Trend Detection Period: A special feature that considers smaller or larger fluctuations. If individual price waves need to be considered, use lower numbers; if the overall trend direction is desired, use larger numbers (e.g., 5-7 or higher). This precisely sets the Zigzag or Pivot format, not displayed but considered in the indicator calculation.
Trend Effect : By changing the Trend Effect status to "Off," all Pin bars, whether bullish or bearish, are displayed regardless of the current market trend. If the status remains "On," only Pin bars in the direction of the main market trend are shown.
🟣 Important : Black triangles "Number 3" and blue triangles "Number 4" displayed in the information table section, as explained in the "Information Table" section.
Show Bullish Pin Bar : When set to "Yes," displays bullish Pin bars; when set to "No," does not display them.
Show Bearish Pin Bar : When set to "Yes," allows the display of bearish Pin bars; when set to "No," does not display them.
Bullish Pin Bar Setting : Using the "Ratio Lower Shadow to Body" and "Ratio Lower Shadow to Higher Shadow" settings, you can customize your bullish Pin bar candles. Larger numbers impose stricter conditions for identifying bullish Pin bars.
Bearish Pin Bar Setting : Using the "Ratio Higher Shadow to Body" and "Ratio Higher Shadow to Lower Shadow" settings, you can customize your bearish Pin bar candles. Larger numbers impose stricter conditions for identifying bearish Pin bars.
Show Info Table : Allows the display or non-display of the information table (located at the bottom of the page and on the right side).
🔵 How to Use
At the end of a downtrend, look for "Hammer" candles, easily identified one by one.
To identify the "Shooting Star" candle pattern at the end of an uptrend; expect a price reversal in the downtrend.
For trades in the downward direction, wait for the formation of an "Inverted Hammer" Pin bar.
And finally, in an uptrend, where a "Hanging Man" candle can form.
🔵 Features
For better visualization, triangles and circles are used above the candles, but they can be easily removed. All Pin bars are displayed in color with the following meanings:
- Black-bodied candle: Inverted Hammer
- Turquoise blue candle: Hammer
- Pink candle: Hanging Man
- Red candle: Shooting Star
🟣 Important : The capability to detect the powerful two-candle pattern "Tweezer Top" at the end of an uptrend emerges by forming two "Shooting Star" candles side by side.
Similarly, the two-candle pattern "Tweezer Bottom" is created at the end of a downtrend with the formation of two "Hammer" candles side by side. To identify the "Tweezer" pattern, make sure the settings in the "Trend Effect" section are set to "Off."
🟣 Auxiliary Indicators
During the start of trading sessions such as Asia, London, and New York, where the highest liquidity exists, alongside this indicator, you can use the Trading Sessions indicator.
Sessions
The combination of Order Blocks "-OB" and "+OB" with candles is one of the best trading methods. The indicator that identifies order blocks, along with this indicator, can yield remarkable results in the success of Pin bar candles.
Order Blocks Finder
The trading toolset "TFlab" presents this indicator. To benefit from all indicators, we invite you to visit our page " TFlab Scripts ".

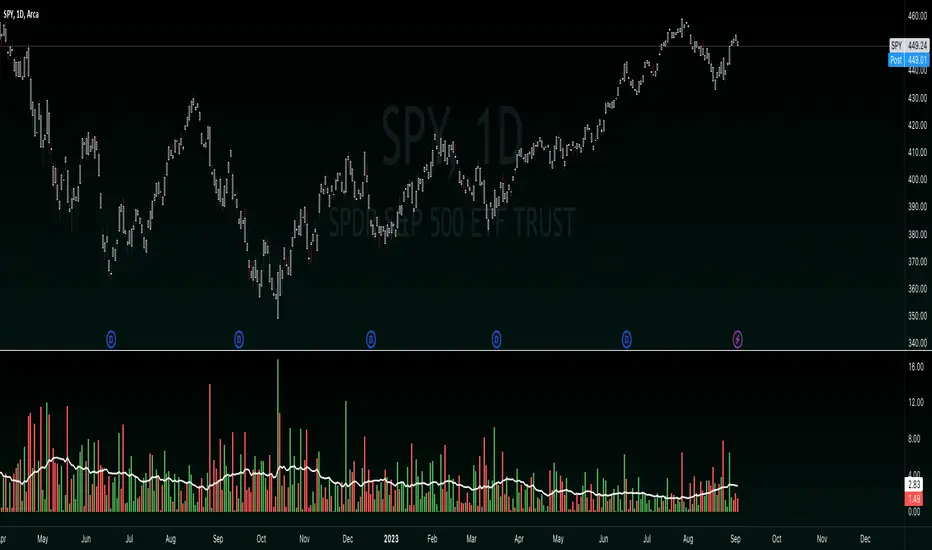
Candle Color By OHLC ComparisonThis indicator is designed to help you recognize the price movements within a candle/bar more quickly and easily. Typically, candle coloring is based on the opening and closing prices, but in this indicator, I followed the OHLC values in reverse order: starting with closing, low, high, and then opening. Each of these is compared with the value in the previous candle. I assigned the least importance to the opening, hence did not include it in the color determination. To make the colors memorable, I used a rainbow-like color scale; with purple representing the highest value and maroon the lowest. You can also change the colors if you wish. Additionally, if you want to set alarms, I assigned values to the candles; the highest being 16 and the lowest 1. A thicker barchart provides a better visual representation.
For instance, consider the monthly chart of the NASDAQ 100. After a prolonged positive trend, when our indicator shows a negative maroon bar (representing a low value) for the first time, it could signal a change in the trend direction. In this scenario, the appearance of the maroon bar serves as a crucial alert for investors to review their current positions or prepare for a potential downtrend. This indicator provides users with a significant advantage in identifying such critical turning points and assists them in quickly adapting to market dynamics.

Trailing Candle CounterThis script is for users who like to monitor and/or analyze a specified number of candles within the time the last candle closed. Al Brooks fans may enjoy this indicator.
While searching for an indicator that already had this functionality I found a script by @Steversteves which counted the candles/percentage within a set period of time. This let me know it could be done. In honor of Steversteves I kept the table the same colors - although, I added code to allow the table to be modified.
When opening the script the user will need to set a begin/end time to analyze – don't worry as you can set anything you want and it can be altered after the script is running.
This image shows the settings for a user to be able to set a begin time and have the indicator count all the candles from that time through to the current time and update at each candle close. The user can move the beginning time as needed. This is useful if the user is monitoring the length of a trend, wedge, channel, etc.:
If the indicator is in view and the beginning time is on the chart the user can select the table to view/select/change the beginning time.
This image shows the settings for a user to monitor the last set of candles since the last candle closed. This is useful if the user expects a pullback after a set number of candles or expects some alteration in a trend within a set number of candles. In this case the user setting is to watch five candles:
This setting is the reason for my creation of this indicator. This image shows the settings for a user to monitor two sets of candles. In this case an additional set of five candles has been added to the original set of five candles:
If one is watching for movements to last a certain number of bars when the first bar of the movement is exiting the background color the user can expect a change in the price momentum.
This image shows the same functionality as in Steversteves original script (although, I used almost none of his original code). The user can set a begin time and end time to analyze the number or red/green candles and the percentage of each within that time period.
If the indicator is in view and the beginning and end times are on the chart the user can select the table to view/select/change the times.
I hope you find this useful and if you have any questions/comments/suggestions for improvement please comment below.

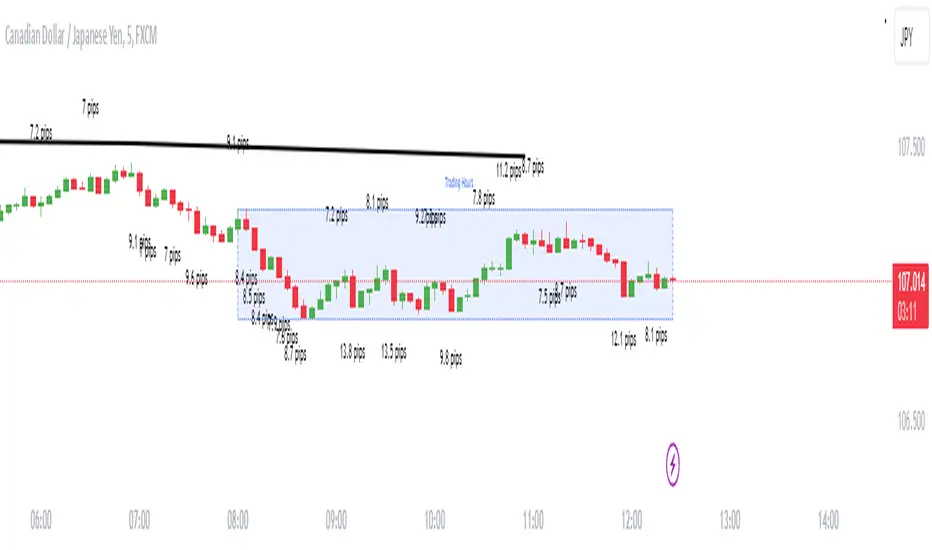
Candle size in pipsDescription
Enhance your trading strategy with precision using this script, designed to measure the range of a candle from wick to wick in pips. Whether you're implementing a specific pip requirement within a candle for your strategy, or simply seeking to better understand market dynamics, this tool provides valuable insights. The script is calculating the amount of pips between the high and the low then compares it to the minimal size you declared. If the amount of pips is more or equal to minimal size it will show the label.
Features
Alert Functionality: Opt to receive alerts by checking the checkbox (default: false).
Customizable Pip Threshold: Tailor the script to your needs by setting the minimum required pips to display on the screen (default: 12).
Different shape: circle, triangle up, triangle down, none
How to Use
Personalize your trading approach by integrating this script with your preferred strategy. For instance, in my strategy involving a 3M continuation, I leverage this tool to determine the pip count of the M15 candle before making entry decisions.
Note: Ensure you understand your strategy's requirements and adjust the script settings accordingly for optimal result s.
Feel free to reach out if you have any questions or require further assistance in maximizing the utility of this script.
Range Breakout Signals (Intrabar) [LuxAlgo]The Range Breakout Signals (Intrabar) is a novel indicator highlighting trending/ranging intrabar candles and providing signals when the price breaks the extremities of a ranging intrabar candles.
🔶 USAGE
The indicator highlights candles with trending intrabar prices, with uptrending candles being highlighted in green, and down-trending candles being highlighted in red.
This highlighting is affected by the selected intrabar timeframe, with a lower timeframe returning a more precise estimation of a candle trending/ranging state.
When a candle intrabar prices are ranging the body of the candle is hidden from the chart, and one upper & lower extremities are displayed, the upper extremity is equal to the candle high and the lower extremity to the candle low. Price breaking one of these extremities generates a signal.
The indicator comes with two modes, "Trend Following" and "Reversal", these modes determine the extremities that need to be broken in order to return a signal. The "Trend Following" mode as its name suggests will provide trend-following signals, while "Reversal" will aim at providing early signals suggesting a potential reversal.
🔶 DETAILS
To determine if intrabar prices are trending or ranging we calculate the r-squared of the intrabar data, if the r-squared is above 0.5 it would suggest that lower time frame prices are trending, else ranging.
This approach allows almost obtaining a "settings" free indicator, which is uncommon. The intrabar timeframe setting only controls the intrabar precision, with a timeframe significantly lower than the chart timeframe returning more intrabar data as a result, this however might not necessarily affect the displayed information by the indicator.
🔶 SETTINGS
Intrabar Timeframe: Timeframe used to retrieve the intrabar data within a chart candle. Must be lower than the user chart timeframe.
Auto: Select the intrabar timeframe automatically. This setting is more adapted to intraday charts.
Mode: Signal generation mode.
Filter Out Successive Signals: Allows removing successive signals of the same type, returning a more easily readable chart.

YinYang Bar ForecastOverview:
YinYang Bar Forecast is a prediction indicator. It predicts the movement for High, Low, Open and Close for up to 13 bars into the future. We created this Indicator as we felt the TradingView community could benefit from a bar forecast as there wasn’t any currently available.
Our YinYang Bar Forecast is something we plan on continuously working on to better improve it, but at its current state it is still very useful and decently accurate. It features many calculations to derive what it thinks the future bars will hold. Let’s discuss some of the logic behind it:
Each bar has its High, Low, Open and Close calculated individually for highest accuracy. Within these calculations we first check which bar it is we are calculating and base our span back length that we are getting our data from based on the bar index we are generating. This helps us get a Moving Average for this bar index.
We take this MA and we apply our Custom Volume Filter calculation on it, which is essentially us dividing the current bars volume over the average volume in the last ‘Filtered Length’ (Setting) length. We take this decimal and multiply it on our MA and smooth it out with a VWMA.
We take the new Volume Filtered MA and apply a RSI Filter calculation on it. RSI Filter is where we take the difference between the high and low of this bar and we multiply it with an RSI calculation using our Volume Filtered MA. We take the result of that multiplication and either add or subtract it from the Volume Filtered MA based on if close > open. This makes our RSI Filtered MA.
Next, we do an EMA Strength Calculation which is where we check if close > ema(close, ‘EMA Averaged Length’) (Setting). Based on this condition we assign a multiplier that is applied to our RSI Filtered MA. We divide by how many bars we are predicting and add a bit to each predictive bar so that the further we go into the future the stronger the strength is.
Next we check RSI and RSI MA levels and apply multiplications based on its RSI levels and if it is greater than or less than the MA. Also it is affected by if the RSI is <= 30 and >= 70.
Finally we check the MFI and MFI MA levels and like RSI we apply multiplications based on its MFI levels and if it is greater than or less than the MA. It is also affected by if the MFI is <= 30 and >= 70.
Please note the way we calculate this may change in the future, this is just currently what we deemed works best for forecasting the future bars. Also note this script uses MA calculations out of scope for efficiency but there is potential for inconsistencies.
Innately it’s main use is the projection it provides. It only draws the bars for realtime bars and not historical ones, so the best way to backtest it is with TradingView’s Replay Tool.
Well, enough of the logic behind it, let's get to understanding how to use it:
Tutorial:
So unfortunately we aren’t able to plot legit bars/candles into the future so we’ve had to do a bit of a work around using lines and fills. As you can see here we have 4 Lines and 3 Zones:
Lines:
Green: Represents the High
Orange: Represents the Open
Teal: Represents the Close
Red: Represents the Low
Zones:
High Zone: This zone is from either Open or Close to the High and is ALWAYS filled with Green.
Open/Close Zone: This zone is from the Open to the Close and is filled with either Green or Red based on if it's greater than the previous bar (real or forecasted).
Low Zone: This zone is from either Open or Close to the Low and is ALWAYS filled with Red.
As you can see generally the Forecasted bars are generally within strong pivot locations and are a good estimation of what will likely go on. Please note, the WHOLE structure of the prediction can change based on the current bars movements and the way it affects the calculations.
Let's look 1 bar back from the current bar just so we can see what it used to Forecast:
As you can see it has changed quite a bit from the previous bar, but if you look close, we drew horizontal lines around where its projecting the next bar to be (our current realtime bar), if we go back to the live chart:
Its projections were pretty close for the high and low. Generally, right now at least, it does a much better job at predicting the high and low than it does the open and close, however we will do our best to fine tune that in future updates.
Remember, this indicator is not meant to base your trades on, but rather give you a Forecast towards the general direction of the next few bars. Somewhat like weather, the farther the bar (or day for weather), the harder it is to predict. For this reason we recommend you focusing on the first few bars as they are more accurate, but review the further ones as they may help show the trend and the way that pair will move.
We will conclude this tutorial here, hopefully this Predictive Indicator can be of some help and use to you. If you have any questions, comments, ideas or concerns please let us know.
Settings:
Forecast Length: How many bars should we predict into the Future? Max 13
Each Bar Length Multiplier: For each new Forecast bar, how many more bars are averaged? Min 2
VWMA Averaged Length: All Forecast bars are put into a VWMA, what length should we use?
EMA Averaged Length: All Forecast bars are put into a EMA, what length should we use?
Filtered Length: What length should we use for Filtered Volume and RSI?
EMA Strength Length: What length should we use for the EMA Strength
HAPPY TRADING!

Candle Size w/ SMAThis simple indicator calculates the absolute size of the candle by the open and close or high and low values and then plots it on a histogram. It also features a simple moving average with a customizable lookback to track the average candle size based on your lookback.
This indicator can be used to spot unusually large or small candles. And can also be used for testing other strategies or indicators related to candle sizes.
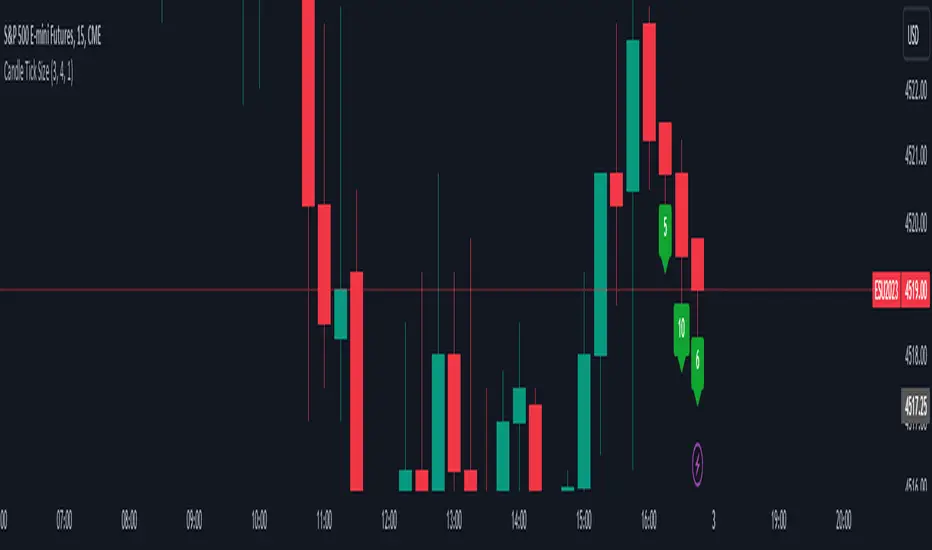
Candle Tick SizeHello everyone!
I dont think it exists, I couldnt find it any way I searched, maybe it is part of a bigger indicator. This is a really basic code, all it does, it shows the tick/pip size of the candles forming. You can adjust on how many candles should it show. Also because the code counts the point size of the candles from high to low, you can adjust that how many ticks are in one point, like for ES and NQ 4 ticks to a point, which is the basic setting. It helps me with entrys when I calculate the contract size so my risk/reward stays pretty much the same depending on the candle size for my entrys.
Boring Candles by BitcoinBailyBoring candlestick is a candlestick whose body is less than 50% of its total candlestick range, this candle is usually small in size.
This indicates that the price range between the open and close of this candle was relatively small, and that there was not a lot of volatility during that time period.

Lower timeframe chartHi all!
I've made this script to help with my laziness (and to help me (and now you) with efficiency). It's purpose is to, without having to change the chart timeframe, being able to view the lower timeframe bars (and trend) within the last chart bar. The defaults are just my settings (It's based on daily bars), so feel free to change them and maybe share yours! It's also based on stocks, which have limited trading hours, but if you want to view this for forex trading I suggest changing the 'lower time frame' to a higher value since it has more trading hours.
The script prints a label chart (ASCII) based on your chosen timeframe and the trend, based on @KivancOzbilgic script SuperTrend The printed ASCII chart has rows (slots) that are based on ATR (14 bars) and empty gaps are removed. The current trend is decided by a percentage of bars (user defined but defaults to 80%, which is really big but let's you be very conservative in defining a trend to be bullish. Set to 50% to have the trend being decided equally or lower to be more conservative in defining a trend to be bearish) that must have a bullish SuperTrend, it's considered to be bearish otherwise. Big price range (based on the ATR for 14 bars) and big volume (true if the volume is bigger than a user defined simple moving average (defaults to 20 bars)) can be disabled for faster execution.
The chart displayed will consist of bars and thicker bars that has a higher volume than the defined simple moving average. The bars that has a 'big range' (user defined value of ATR (14 days) factor that defaults to 0.5) will also have a wick. The characters used are the following:
Green bar = ┼
Green bar with large volume = ╪
Green bar wick = │
Red bar = ╋
Red bar with large volume = ╬
Red bar wick = ┃
Bar with no range = ─
Bar with no range and high volume = ═
Best of trading!

Hide Active Candle [SteinG]Hide Active Candle
An essential tool for disciplined traders seeking to avoid making hasty decisions based on active bars that have not yet closed.
Have you ever found yourself eagerly anticipating an entry, only to be tempted by an active candle that starts to pull away? Or perhaps you've been caught in a trade where an active candle pushes against you, stirring unease and uncertainty. Fear not, for we have a solution!
"Hide Active Candle" is a simple Pine Script indicator designed to ghost the active bar on your chart, reinforcing the importance of patiently waiting for its closure before making any trading decisions. By masking the active candle, this indicator serves as a constant reminder to exercise caution and to base your actions on solid, confirmed information.
To make the most of this powerful tool, ensure that you are using a candlestick chart, as this script operates optimally within that framework. Follow these simple steps to get started:
1. Right-click on your chart and select "Settings..."
2. From the drop-down menu, choose "Symbol" under the "Chart Settings" section.
3. Disable every item in the list to fully utilize the capabilities of "Hide Active Candle."
But wait, there's more! We understand that each trader has unique preferences and requirements. That's why we've included customizable settings within the script to tailor it to your specific needs. You have the option to adjust the following parameters:
- Countdown seconds left : Specify the number of seconds before the bar closes when the current candle becomes visible.
- Bull candle color : Select the color that represents bullish candles on your chart.
- Bear candle color : Choose the color that indicates bearish candles.
- Equal candle color : Define the color for Doji star candles.
- Theme : Opt for a dark or light theme, as the active candle mask will be based on your chosen theme.
- Custom hidden color : Personalize the mask color according to your preferences.
By fine-tuning these settings, you can create a trading environment that perfectly suits your style and enhances your decision-making process.

ATR VisualizerAdvance Your Market Analysis with the True Range Indicator
The True Range Indicator is a sophisticated screener meticulously developed to bolster your trading execution by presenting an exceptional understanding of the market direction. The centerpiece of this instrument is a distinctive candle configuration depicting the Average True Range (ATR) and the Bear/Bull range. However, it traverses beyond the conventional channels to offer specific market settings to boost your trading decisions.
User-Defined Settings
Broadly, the indicator offers five dynamic settings:
Bear/Bull Range
The Bear/Bull Range outlines the ATR for each candle type - bearish and bullish - and then smartly opts for the pertinent one based on the prevalent market circumstances. This feature aids in comparing the range of bullish and bearish candlesticks, which deepens your understanding of the price action and volatility.
Bearish Range
The Bearish Range isolates and computes the ATR for bearish candles solely. Utilizing this option spots the bear-dominated periods and provides insights about potential market reversals or downward continuations.
Bullish Range
Opposite to the Bearish Range, the Bullish Range setting tabulates the ATR exclusively for bullish candles. It assists in tracking the periods when bulls control, enlightening traders about the possibility of upward continuations or trend reversals.
Average Range
The Average Range provides an unbiased measure of range without prioritizing either bull or bear trends. This model is ideal for traders looking for a holistic interpretation of market behavior, regardless of direction.
Cumulative Average Range
Equally significant is the Cumulative Average Range which calculates the aggregate moving average of the true ranges for an expressed period. This setting is extremely valuable when evaluating the long-term volatility and spotting potential breakouts.
Dual Candle Configuration
Going a step ahead, the True Range Indicator uniquely offers the possibility to incorporate more than one candle estimate on your screen. This ensures simultaneous analysis of multiple market dynamics, thereby enhancing your trading precision multifold.
Concluding Thoughts
In essence, the True Range Indicator is an indispensable companion for traders looking to not only leverage market volatility but also make educated predictions. Equipped with an array of insightful market settings and the ability to display dual candle estimates on-screen, you can customize the functionality to suit your unique trading style and magnify your market performance dramatically.

Period Candle CounterThis is a very simple utility indicator.
Shockingly nothing similar was available and I really needed something to quickly count period lengths by candles (to make adjustments to indicators based on a desired lookback timeframe), so I created this.
I thought I would share it because chances are if I needed something like this, other people may need it, too.
What it does:
Its really simple and this really truly is just a utility indicator that gives you raw information to make adjustments to other indicators. It just counts the number of candles in a user defined period of time.
It will count the number of red candles, green candles and then display the total candle count.
It will also display in percent (i.e. 52% green candles vs 48% red candles, etc.).
Its point and click, so once launched you just click the area you want to start the count and click the area you want to end the count.
Purpose:
Personally, I use it to make adjustments to timeframe lengths on indicators that look at averages and also on my time series indicator. If I want the price average or range for a specific period in time (say, the past 1.5 days of an uptrend), I will use this to count the candles in that period so that I can manually adjust whichever indicator to the correct lookback length, as most indicators are adjusted by candle length (i.e. 1 candle, 2 candles, 3 candles, etc.)
And that's it, pretty straight forward. Honestly pretty boring but its actually really pivotal for me to make adjustments to certain indicators.
Hope you find it helpful, too!
Safe trades!

The Golden Candlestick PatternThe Golden pattern is a three-candlestick configuration based on a variation of the golden ratio (2.618) from the Fibonacci sequence.
The bullish Golden pattern is composed of a normal bullish candlestick with any type of body, followed by a bigger bullish candlestick with a close price that is at least 2.618 times the size of the first candlestick (high to low). Finally, there must be an important condition that is, a third candlestick that comes back to test the open of the second candlestick from where the entry is given.
The bearish Golden pattern is composed of a normal bearish candlestick with any type of body, followed by a bigger bearish candlestick with a close price that is at least 2.618 times the size of the first candlestick (high to low). Finally, there must be an important condition that is, a third candlestick that comes back to test the open of the second candlestick from where the entry is given.

50% candlestick closeThis indicator is useful at important level, when you want to see some bullish or bearish signs in candlestick.
At your important support level you can buy, if candlestick close is above 50% of its range, with low of this candlestick as SL.
At your important resistance level you can sell, if candlestick close is below 50% of its range, with high of this candlestick as SL.

Period OpenA very simple indicator that displays the Open of the specified Timeframe
How to use this indicator?
1. Directional Bias
Bullish => Closing Price > Period Open
Bearish => Closing Price < Period Open
2. Support / Resistance
Each Period Open can be used as Support or Resistance
3. Take Profit Targets
Each Period Open can be used as targets for taking profit

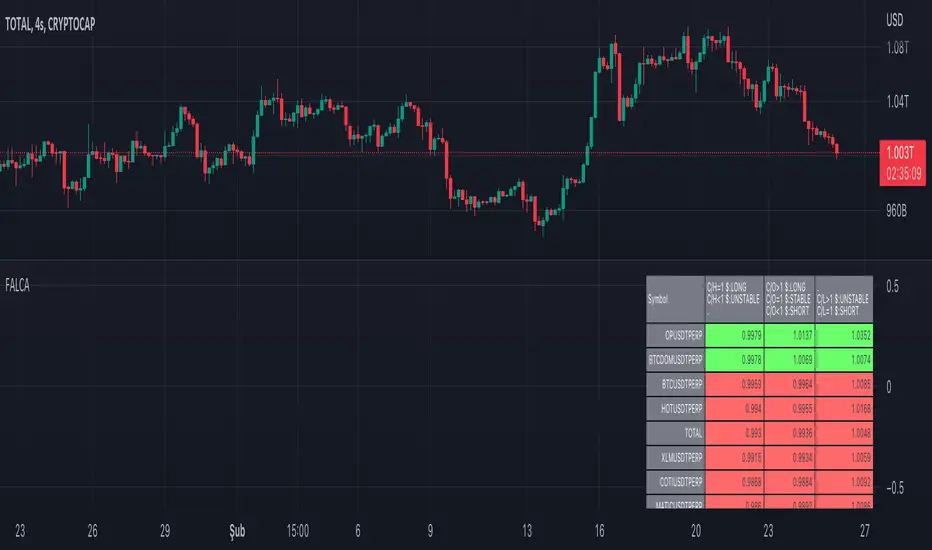
Futures All List Candle Analysis - FALCAIn this command; There is an alphabetical list of USDS-M coins with the USDT PERP extension on the Binance Futures side.
There are 13 lists in total. Each list contains 39 data. Due to data limitation, 13 lists are formed. There are 13 coins in the first 11 of the lists. The 12th list contains 3 coins. The last list (FAVORITE LIST) is CRYPTOCAP:TOTAL, BINANCE:BTCUSDTPERP, BINANCE:BTCDOMUSDTPERP as standard. You must add 10 coins to the final list.
The lists show data for the time period you selected.
Explanation of the (C/H) header: Close /High takes a maximum value of 1. As long as this value is 1, a price increase is observed.
Explanation of the (C/O) header:
Close /Open can be greater than ,1. In this case, a price increase is observed.
Close /Open can be less than 1. In this case, a price decrease is observed.
The value Close /Open can be equal to 1. In this case, price stability is observed.
Explanation of the (C/L) header: Close /Low takes a minimum value of 1. As long as this value is 1, a price decrease is observed.
Coins with a price decrease are shown in red.
Coins with a price increase will turn green.
***NOTE: For this command to work, you must first add 10 favorite coins to the "FAVORITE LIST".
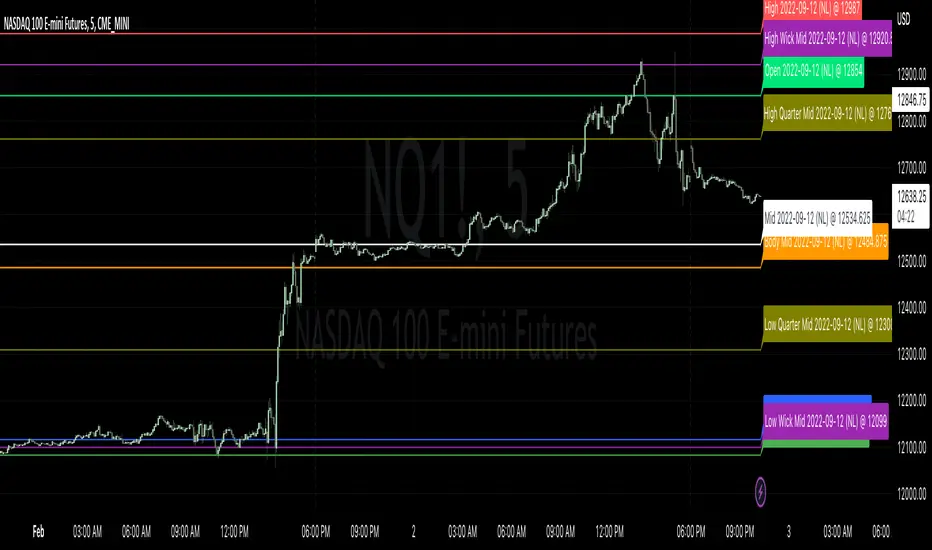
Candle LevelsCandle Levels
Allows chart levels to be plotted automatically, simply add tool to chart and the interactive mode will prompt for candle selection, timeframe anchor and some label choices such as displaying time, price or disabling labels altogether.
Also a note can be supplied that will be shown in the labels if they're displayed, if not it'll be up in the indicator values if those are enabled. Colors and individual labels can be customized, encourage saving over defaults for repeated usage.
Levels calculated:
Standard OHLC
Close to open mid point
High to low mid point
High wick mid point (either between close or open, whichever is higher)
Low wick mid point (either between close or open, whichever is lower)
I have plans to better detected levels and labels overlap to perhaps do something with that, for now manually toggling display of label should suffice.
I've tested with various markets such as futures, standard stock markets and also various higher and lower timeframes, if something is found to not be working please let me know.
Enjoy!
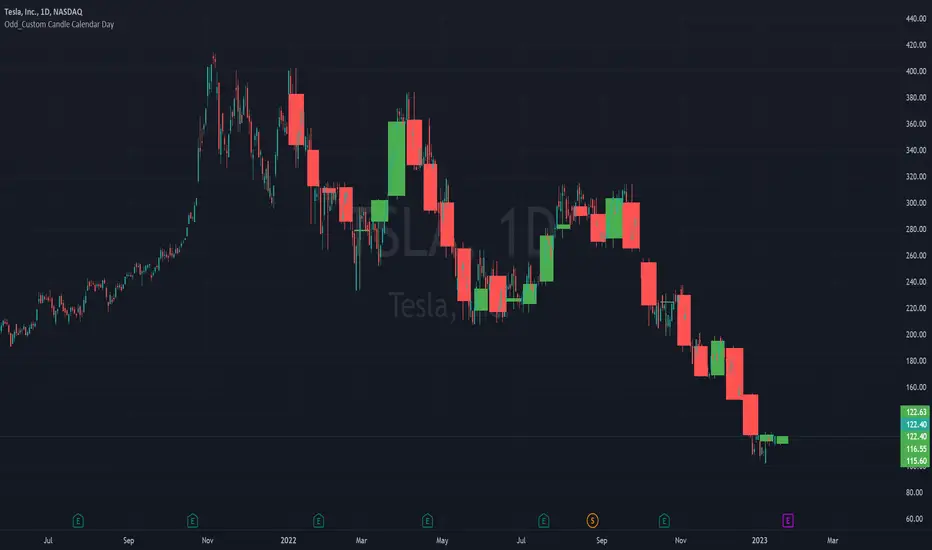
Odd_Custom Candle Calendar DayEver wonder how candles would look on a chart if they were tracked by calendar day instead of market days?
Option(s)-
📅Custom start date for candle formation
✖️Candle multiplier
🌈Up / Down Colors
Features-
📋Displays candle data with invisible plots
Use Move to Existing Pane to Overlay on chart.
Can only display a max of 500 candles!
RSI Candle Advanced V2RSI Advanced
As the period value is longer than 14, the RSI value sticks to the value of 50 and becomes useless.
Also, when the period value is less than 14, it moves excessively, so it is difficult for us to see the movement of the RSI .
So, using the period value and the RSI value as variables, I tried to make it easier to identify the RSI value through a new function expression.
This is how RSI Advanced was developed.
Period below 14 reduce the volatility of RSI , and period above 14 increase the volatility of RSI, allowing overbought and oversold zones to work properly and give you a better view of the trend.
By applying the custom algorithm so that the 'RSI Advanced' with period on a 5-minute timeframe has the same value as the 'original RSI' with period on a 60-minute timeframe.
As another example, an 'RSI Advanced' with a period in a 60-minute time frame has the same value as an 'original RSI' with a period in a 240-minute time frame.
Compare the difference in the RSI with a period value of 200 in the snapshot.
------------------------------------------------------------------------------------------
RSI Candlestick
RSI derives its value using only the closing price as a variable.
I solved the RSI equation in reverse and tried to include the high and low prices of candlesticks in the equation.
As a result, 'if the high or low was the closing price, the value of RSI would be like this' was implemented.
Just like when a candle comes down after setting a high price, an upper tail is formed when RSI Candle goes down after setting a high price!!
In divergence, we had to look only at the relationship between closing prices, but if we use RSI candles, we can find divergences in highs and highs, and lows and lows.
Existing indicators could not express "gap", but Version 2 made it possible to express "gap"!!!!!!
RSI can be displayed as candlesticks, bars and lines
Then enjoy my RSI!
----------------------------------------------------------------------------------------
RSI Advanced
기간값이 14보다 길어질수록 RSI값은 50값에 달라붙게 되어서 쓸모가 없어집니다.
또 기간값이 14보다 줄어들수록 과도하게 움직여서 우리는 RSI의 움직임을 보기가 힘듭니다.
그래서 기간 값과 RSI 값을 변수로 사용하여 새로운 함수 식을 통해 RSI 값을 식별하기 편하도록 해보았습니다.
이렇게 RSI Advanced가 개발되었습니다.
기간값이 14보다 낮으면 rsi의 변동폭이 줄어들고, 기간값이 14보다 크면 변동폭이 넓어져 과매수 및 과매도 영역이 제대로 작동하여 추세를 더 잘 볼 수 있습니다.
또한 저는 5분 타임프레임의 기간값이 168(=14*12)인 RSI가 주기 값이 14인 60분 타임프레임의 RSI와 동일한 값을 갖도록 적절한 함수 표현식을 적용하여 RSI를 변경했습니다.
다른 예로, 15분 시간 프레임에서 기간값이 56(=14*4)인 RSI는 60분 시간 프레임의 기간값이 14인 RSI와 동일한 값을 갖습니다.
기간값이 200인 RSI의 차이를 스냅샷에서 비교해보십시오.
-----------------------------
RSI Candlestick
RSI는 종가만을 변수로 사용하여 값을 도출해냅니다.
저는 RSI 식을 역으로 풀어내어서 캔들스틱의 고가와 저가, 시가를 식에 포함시켜보았습니다.
결과적으로, '만약 고가나 저가가 종가였다면 RSI의 값이 이럴것이다'를 구현해내었습니다.
캔들이 고가를 찍고 내려오면 윗꼬리가 생기듯 RSI Candle에서도 고가를 찍고 내려오면 윗꼬리가 생기는겁니다!!
다이버전스 또한 원래는 종가끼리의 관계만 봐야했지만 RSI 캔들을 이용한다면 고가와 고가, 저가와 저가에서도 다이버전스를 발견할 수 있습니다.
기존의 지표는 "갭"을 표현하지 못했지만 Version 2 에서는 "갭"을 표현할 수 있게 만들었습니다!!!!!!
그럼 잘 사용해주십시오!!!
