MicroX- in side bar 4-7In Side bar
Shading the range of the host candle for a group of 4-7 candles makes it easier to read the movement.
تظليل نطاق الشمعة الحاضنة لمجموعة من الشموع 4-7 لتسهيل قراءة الحركة
Phân tích Đồ thị Nến

Candle day/hourThis indicator displays a short label on each bar showing the day of week on daily charts and the hour on hourly charts. It supports multiple timezones and allows customization of label color, background, and font size.

HalfTrend + Trend AliThis indicator combines the structural logic of the HalfTrend system with a trend filter built on the Hull Moving Average to provide a clearer view of potential market turning points.
The HalfTrend method reacts to price extremes using adaptive deviations, offering a dynamic representation of local highs and lows. By integrating a Hull MA trend filter, the script focuses only on signals that appear in harmony with the prevailing directional bias, helping reduce noise that may occur during counter-trend fluctuations.
🔹 How It Works
The HalfTrend algorithm tracks price swings using amplitude-based detection and ATR-derived channel deviation.
A trend switch is detected when price moves beyond the boundaries of the current swing structure.
The Hull Moving Average acts as a fast-reacting trend reference. Only signals that align with the Hull direction are highlighted.
To maintain clarity and avoid clustered notifications, the script displays only one signal per confirmed trend phase.
🔹 What the Signals Represent
Buy signals appear when the HalfTrend structure shifts upward and the Hull MA confirms an uptrend.
Sell signals appear when the structure shifts downward and the Hull MA confirms a downtrend.
Both signal types include optional alerts for traders who want to be notified immediately when conditions change.
🔹 Purpose
This tool is intended for traders who want to observe structural trend shifts together with a clean and responsive trend filter. It does not attempt to predict the market; instead, it highlights moments when short-term reversals and broader trend direction are aligned.
🔹 Notes
The indicator does not repaint the signals once confirmed.
It can be applied to any market or timeframe.
Users may combine it with their own risk management or additional confirmation tools.

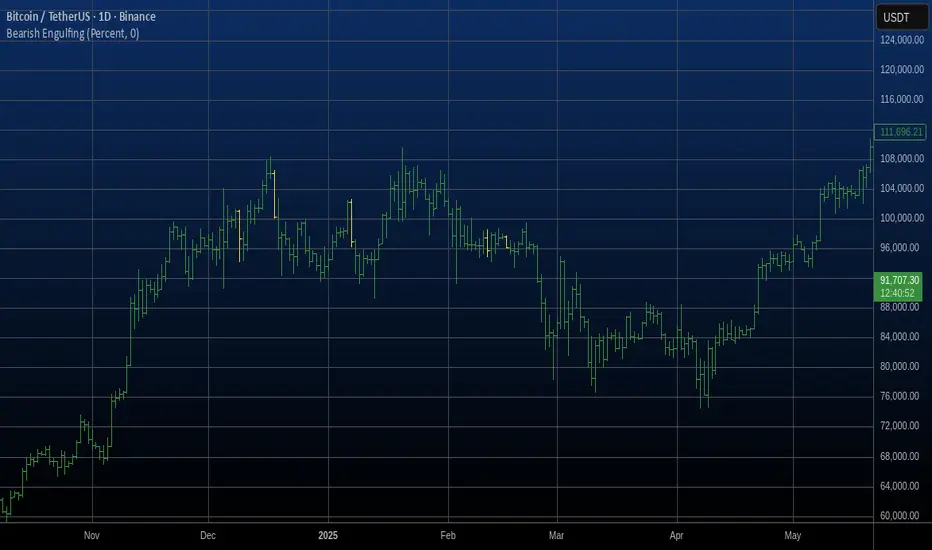
Bearish Engulfing Automatic Finding Script This is a bearish pattern formed by three candlesticks.
The pattern is based on the fact that the last candlestick must
completely engulf the previous two and be downward. The two preceding
candlesticks must also be upward. Candlestick wicks are not taken
into account.
Daily Candle by NatantiaIntroduction to the Daily Candle Indicator
The Daily Candle Indicator is a powerful and customizable tool designed for traders to visualize daily price action on any chart timeframe.
This Pine Script (version 5) indicator, built for platforms like TradingView, overlays a single candle representing the day's open, high, low, and close prices, with options to adjust its appearance and session focus.
Key Features:
Customizable Appearance: Users can set the colors for bullish (default green) and bearish (default white) candles, as well as the wick color (default white). The horizontal offset and candle thickness can also be adjusted to fit the chart layout.
Dynamic Updates: The candle updates on the last bar, with wicks drawn to reflect the daily high and low, providing a clear snapshot of the day's price movement.
This is the same version as before, but we had to republish it because the chart contained other indicators, which violated the publication rules. We apologize for the inconvenience.
Have a nice trades!
-Natantia

Smart Levels📊 SMART LEVELS - Dynamic Support & Resistance Indicator
═══════════════════════════════════════════════════════════════
🎯 OVERVIEW
Smart Levels is an advanced support and resistance indicator that automatically identifies and displays the most significant price levels based on historical pivot points. Unlike simple pivot indicators, Smart Levels uses intelligent clustering and weighting algorithms to merge nearby extremums and highlight only the most reliable levels that matter for trading decisions.
This indicator emphasizes identifying key price levels where multiple pivot points converge, creating zones of increased probability for price reactions.
═══════════════════════════════════════════════════════════════
🔧 HOW IT WORKS
1. PIVOT POINT DETECTION
The indicator scans historical price data to identify pivot highs and pivot lows using configurable left/right bar parameters. Each detected extremum represents a potential support or resistance point where price previously reversed.
2. INTELLIGENT LEVEL CLUSTERING
KEY INNOVATION: Instead of drawing a line at every pivot point, Smart Levels uses an ATR-based clustering algorithm to merge nearby extremums into consolidated levels.
• Extremums within a specified percentage of ATR are grouped together
• The level price is calculated as a weighted average of all contributing pivot points
• This eliminates visual clutter and focuses on truly significant zones
3. TOUCH-BASED LEVEL RANKING
Levels are ranked by the number of pivot points (touches) that contributed to them:
• 5+ touches: Strong levels (solid lines, thicker width)
• 2-4 touches: Moderate levels (dashed lines, standard width)
• Only levels meeting the minimum touch threshold are displayed
4. LEVEL CLASSIFICATION
Each level is automatically classified based on the types of extremums it contains:
• 🟢 SUPPORT - Contains only pivot lows (green)
• 🔴 RESISTANCE - Contains only pivot highs (red)
• 🔵 MIRROR LEVEL - Contains both highs and lows, indicating a level that has acted as both support and resistance (blue)
═══════════════════════════════════════════════════════════════
📋 KEY FEATURES
✨ SMART LEVEL DETECTION
• ATR-Adaptive Clustering: Automatically adjusts merge zones based on market volatility
• Configurable History: Look back 50-500 bars to find relevant levels
• Touch-Based Filtering: Only show levels with minimum confirmation (2-10 touches)
• Top N Display: Automatically displays the strongest 3-20 levels to avoid clutter
📊 DETAILED PRICE INFORMATION
• Multi-Line Price Labels: Each level shows ALL contributing pivot prices in a vertical list
• Labels display the exact historical prices that formed the level
• Visual classification icons (↑ support, ↓ resistance, 🔄 mirror)
• Labels positioned to the right of current price for clear visibility
🎨 VISUAL CUSTOMIZATION
• Customizable colors for support, resistance, and mirror levels
• Automatic line styling based on level strength
• Optional debug mode showing all detected pivot points
• Highlight feature that marks which extremums contributed to displayed levels
📈 REAL-TIME UPDATES
• Levels recalculate on every bar for dynamic adaptation
• Lines extend into the future for forward-looking analysis
• Information table shows current ATR, merge zone, and level statistics
═══════════════════════════════════════════════════════════════
⚙️ INPUT PARAMETERS
EXTREMUM DETECTION
• Bars Left (7) - Number of bars to the left for pivot detection (2-20)
• Bars Right (7) - Number of bars to the right for pivot detection (2-20)
• Lookback History (200) - How many bars back to analyze for levels (50-500)
LEVEL SETTINGS
• Merge Percent (0.8% ATR) - Maximum distance to cluster extremums (0.2-3.0%)
• Minimum Touches (2) - Minimum pivot points required to display a level (2-10)
• Maximum Levels (10) - How many top levels to display (3-20)
VISUAL OPTIONS
• Support Color (Green) - Color for support levels
• Resistance Color (Red) - Color for resistance levels
• Mirror Color (Blue) - Color for mirror levels
• Show Debug Pivots - Display all detected pivot points
• Highlight Used Extremums - Mark extremums that form displayed levels
═══════════════════════════════════════════════════════════════
📖 HOW TO USE
BASIC SETUP
1. Add the indicator to your chart (works on any timeframe)
2. Start with default parameters and observe the detected levels
3. Adjust "Minimum Touches" to filter more/less levels
4. Tune "Merge Percent" based on your timeframe and instrument volatility
TRADING APPLICATIONS
1. Entry Timing: Watch for price reactions at identified levels for potential entry points
2. Stop Loss Placement: Place stops beyond strong levels (5+ touches)
3. Target Selection: Use the next significant level as a profit target
4. Breakout Confirmation: Monitor for decisive breaks of strong resistance/support levels
5. Mirror Level Strategy: Blue levels that flip from support to resistance (or vice versa) can provide high-probability setups
INTERPRETATION TIPS
• Solid thick lines (5+ touches) = Extremely reliable levels with strong historical significance
• Dashed lines (2-4 touches) = Valid levels but with less confirmation
• Mirror levels (blue) = Highest probability zones as they've worked in both directions
• Check the price labels to see the exact historical prices that formed each level
RECOMMENDED SETTINGS BY TIMEFRAME
• Scalping (1m-5m): Lookback 100-150, Merge 0.5-0.8%, Min Touches 2-3
• Intraday (15m-1h): Lookback 150-200, Merge 0.8-1.2%, Min Touches 3-4
• Swing (4h-1D): Lookback 200-300, Merge 1.0-1.5%, Min Touches 3-5
• Position (1D-1W): Lookback 300-500, Merge 1.5-2.0%, Min Touches 4-6
═══════════════════════════════════════════════════════════════
🔍 DEBUG FEATURES
Enable the debug options to understand how the indicator works:
• Show Debug Pivots: Displays small triangles at all detected pivot points (faded)
• Highlight Used Extremums: Bright colored triangles show which pivots contributed to displayed levels
• Info Table: Shows current ATR, merge zone size, number of detected extremums, and active levels
These features help you fine-tune parameters and understand why certain levels appear or disappear.
═══════════════════════════════════════════════════════════════
⚡ TECHNICAL DETAILS
• Version: Pine Script v5
• Overlay: Yes (draws directly on price chart)
• Maximum Lines: 50 (configurable limit)
• Maximum Labels: 50 (configurable limit)
• ATR Period: 14 bars (standard volatility measurement)
• Calculation Method: Weighted average of clustered pivot points
• Update Frequency: Every bar (dynamic recalculation)
═══════════════════════════════════════════════════════════════
💡 WHAT MAKES THIS INDICATOR ORIGINAL
1. INTELLIGENT CLUSTERING ALGORITHM
Unlike basic pivot indicators that draw every level, Smart Levels uses ATR-adaptive clustering to merge nearby extremums, highlighting only the most significant zones
2. DETAILED PRICE HISTORY
Multi-line labels show ALL historical prices that formed each level, providing transparency about level formation
3. DYNAMIC STRENGTH VISUALIZATION
Automatic line styling (solid vs dashed, thickness) based on level confirmation strength
4. MIRROR LEVEL DETECTION
Identifies zones that have acted as both support AND resistance, which are statistically more reliable
5. REAL-TIME ADAPTATION
Continuous recalculation ensures levels remain relevant as new price action develops
6. VISUAL DEBUGGING SYSTEM
Comprehensive tools to understand level formation and tune parameters effectively
═══════════════════════════════════════════════════════════════
⚠️ IMPORTANT NOTES
• This indicator identifies historical support/resistance zones - it does NOT predict future price movements
• Always combine with other forms of analysis (trend, volume, fundamentals) for trading decisions
• Levels can break - use proper risk management and stop losses
• Higher timeframes generally produce more reliable levels
• On first load, the indicator needs leftBars + rightBars bars to detect the first pivots
═══════════════════════════════════════════════════════════════
📚 METHODOLOGY BACKGROUND
This indicator implements a clustering-based approach to support and resistance analysis, which emphasizes:
• Identifying price levels where multiple extremums converge
• Focusing on the strongest, most tested levels rather than every minor pivot
• Using historical price behavior to anticipate future support/resistance
• Combining level analysis with proper risk management and position sizing
The clustering approach ensures that levels represent genuine zones of supply/demand accumulation rather than isolated price spikes, making them more reliable for trading decisions.
═══════════════════════════════════════════════════════════════

powell's key openskey open levels that powell teaches and uses
6 pm, 12 am and 10 am EST opening pricing

A2Z Session First Candle High/LowThis indicator plots the High and Low of the 1st 1 minute candle of any underlying.

MultiAlgo - ScoutMultiAlgo Scout is a helper tool that shows you when market conditions are favorable and when you should stay patient. It is built to support the MultiAlgo system and works for both long and short trading.
What it helps you do:
Filter the current trend so you know if you should focus on longs or shorts
Highlight potential entry candles and continuation candles
Mark swing points and structure zones that matter for decision making
Dynamically show areas where you can place your stop loss based on volatility
Scout does not give buy or sell signals. It gives you clean visual guidance so you can make your own trading decisions with more confidence and consistency.
[AutoZone_mrkim]- Use wisely
- The indicator will automatically draw the Order Block zone for each timeframe
- It will change color if a zone is broken out
- Each timeframe will have different zone levels depending on the timeframe used

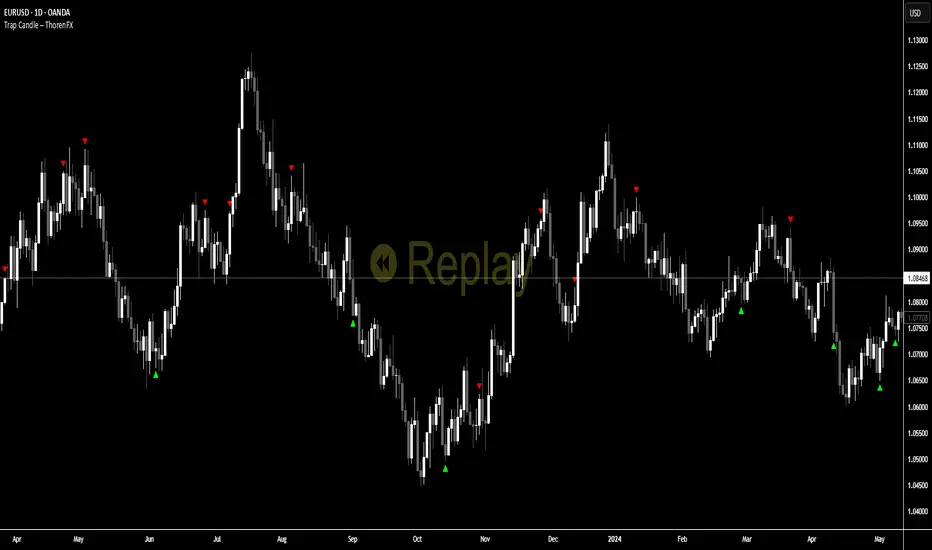
Trap Candle ThorenFXThis tool identifies Trap Candles by combining swing structure, bias shifts, and momentum shifts. The indicator evaluates recent highs and lows to define directional bias, tracks consecutive momentum candles using a custom AO-based sequence, and triggers signals only when the trend bias flips and momentum contradicts the prevailing direction.
The script uses a 20-candle swing lookback to detect the most recent Highest High and Lowest Low. When the market touches these swing extremes, the bias is updated (bullish or bearish). After a bias is confirmed, the indicator waits for a sequence of momentum candles in favor of the trend and then looks for an opposing candle to identify a trap.
Trap signals are only valid if they occur away from current swing extremes, filtering noise and late entries.
BUY Signal logic
Price touches a swing Low to set bullish bias
A minimum sequence of green momentum candles forms
First red momentum candle after the sequence triggers a BUY trap
Signal only prints if the swing Low is not hit again
SELL Signal logic
Price touches a swing High to set bearish bias
A minimum sequence of red momentum candles forms
First green momentum candle after the sequence triggers a SELL trap
Signal only prints if the swing High is not hit again
A compact table display highlights the latest active signal for quick visualization.
How to use
Use in trending or post-liquidity grab environments
BUY traps indicate potential bearish exhaustion followed by bullish reversal
SELL traps indicate potential bullish exhaustion followed by bearish reversal
Combine with structure confirmation and lower-timeframe entry techniques
Works best when aligned with swing bias and momentum context
Avoid signals that form directly at swing extremes; this filter is already built-in but additional confluence improves reliability
No indicator is 100% accurate — it’s all about understanding the logic behind the signals.
Breakout ScannerThis is a Breakout Scanner that shows you the immediate trend across 4 higher timeframes for up to 10 different tickers. It calculates a score from 1 to 3 for bullish and -1 to -3 for bearish based on where price is currently at compared to the previous higher timeframe’s candle levels.
When price is breaking out of the previous higher timeframe candle’s range, then it will have a score of 3 for bullish breakout or -3 for bearish breakout. When price is above the high or below the low of multiple different higher timeframe candles, you can expect price to continue the breakout and move to a new area of price range.
The brighter red or green the color is, the stronger the trend is on that timeframe. When it shows a bright green or red box on the far right side of a ticker, it is notifying you that the ticker is bullish or bearish on all timeframes and trending strongly, so switch over to that chart and look to trade in the direction of that trend.
The tickers, colors and time frames can be customized to suit your preference and you can also turn off as many tickers or time frames as you’d like if you want less tickers or time frames to show up on the indicator. It also includes alerts for when all timeframes are bullish or all timeframes are bearish for one ticker.
Make sure to keep each timeframe set to a timeframe that is higher than your chart timeframe.
Bullish Scoring & Colors
If the current candle close is above the midline of the higher time frame candle, it is given a score of 1 and a dark green background. If the current candle close is above the higher timeframe candle body, then it is given a score of 2 and a medium green background. If the current candle close is above the high of the higher time frame candle, it is given a score of 3 and a bright green background.
The higher the score the stronger the bullish trend and the brighter green the color will be.
Bearish Scoring & Colors
If the current candle close is below the midline of the higher timeframe candle, it is given a score of -1 and a dark red background. If the current candle close is below the higher timeframe candle body, then it is given a score of -2 and a medium red background. If the current candle close is below the low of the higher timeframe candle, it is given a score of -3 and a bright red background.
The lower the score, the stronger the bearish trend and the brighter red the color will be.
Total Score Display
On the right side of the indicator table, there is a column that displays the total score by adding all the scores together so you can easily tell the overall strength of the trend across all timeframes. Wait for the trend score to be at least 75% of the possible score to trade so you can ensure you are only trading very strong trends and increase your probability of winning your trade. The total score will update according to how many time frames you have enabled in the settings. You can also turn on or off the total score count if you prefer. The default setting is off.
All Timeframe Trends Agree
When all of the timeframes that you have turned on are in the same direction at the same time, a green or red box will appear on the far right side of the scanner. This is a visual cue that lets you know the strongest trending markets without having to read any of the numbers. Make sure to check out the charts for the markets that have a green or red box on the far right side and look for potential trend trading opportunities.
Alerts
You can set alerts for when all time frames for a certain ticker are bullish or bearish. If you have some time frames turned off at the time of creating your alerts, then it will only require all time frames that are on to be all bullish or bearish to generate an alert. Make sure to set your alerts to once per bar close to ensure you don’t get premature alerts that aren’t yet valid.
Best Way To Use The Scanner
For best results, make sure you wait for the trend to show all bullish or all bearish at the same time and then look to trade in the direction of the strong trend. If you can be patient enough to do that, you will increase the probability of winning your trade because you are trading with the direction of the overall higher timeframe trend when the market is trending strongly and making new highs or lows.
When one of the markets in the scanner shows all timeframes trending, go to that chart and see how price action is reacting to the previous higher timeframe candle levels. You can see those levels easily by adding our Higher Timeframe Candle Levels indicator to your chart and using the same timeframes as your Breakout Scanner is using.
If price is holding the higher timeframe candle levels well, then look to place trades in the direction of the trend that the Breakout Scanner is showing.
Other Indicators To Pair This With
Use this in combination with our Higher Timeframe Candle Levels indicator so you can see all of these levels being used to calculate the trend strength scores and watch how price reacts to those levels. You should also use our Trend Strength Indicator to easily read the historical trends of price compared to the higher timeframes and use those trends to guide you on when to trade and which direction to trade.
Trend Strength Indicator, Higher Timeframe Candle Levels and the Breakout Scanner all use the same levels to calculate the trend scores so they are designed to work all together to help you quickly be able to read a chart and find what direction to trade in.

3D Cube Projection - √3 Diagonal3D Cube Projection - √3 Diagonal
OVERVIEW
This indicator implements Bradley F. Cowan's cube projection methodology from his "Four Dimensional Stock Market Structures & Cycles" work. It visualizes a 3D cube projected onto the 2D price-time chart, using the √3 (square root of 3) body diagonal as the primary analytical tool for identifying market structure and potential cycle termination points.
METHODOLOGY
The cube is constructed by selecting two pivot points (A and E) which form the body diagonal - the longest diagonal running through the cube's interior from one corner to the diagonally opposite corner. According to Cowan's geometric approach:
- Point A = Starting pivot (low or high)
- Point E = Ending pivot (opposite extreme)
- Body Diagonal (A→E) = √3 × cube side length
- Face Diagonal (A→C) = √2 × cube side length
The script calculates the cube dimensions by:
1. Measuring the total price range from A to E
2. Dividing by √3 to determine the cube side length in price
3. Distributing the time component across three equal segments
4. Projecting the 3D structure onto the 2D chart plane
FEATURES
✓ Interactive date selection for points A and E
✓ Automatic UPLEG/DOWNLEG detection
✓ All 8 cube vertices labeled (A-H)
✓ All 6 cube faces with independent color/opacity controls
✓ √3 body diagonal (red line by default)
✓ √2 face diagonal (orange line by default)
✓ Customizable cube lines, fills, and labels
✓ Information table showing key measurements
VISUAL CUSTOMIZATION
- Front & Back faces: Box fills for the two square faces
- Side faces: Left and right vertical faces
- Top & Bottom faces: Horizontal connecting faces
- Each group has independent color and opacity settings
- Label size and transparency fully adjustable
- Cube line styles (solid, dashed, dotted) for depth perception
IMPORTANT LIMITATIONS & DISCLOSURES
This indicator works within the inherent constraints of projecting 3D geometry onto a 2D price-time chart:
⚠️ VISUAL APPROXIMATION: This is a visual projection tool, not a mathematically perfect 3D cube. True 3D geometry cannot be accurately represented on a 2D plane without distortion.
⚠️ TIME DISTRIBUTION: The script divides the time axis into three equal segments (total bars ÷ 3) for practical visualization. This is an approximation that prioritizes visual coherence over strict geometric accuracy.
⚠️ UNIT SCALING: Price and time use different units (dollars vs. bars), making true isometric projection impossible. The cube appears proportional on screen but the dimensions are not directly comparable.
⚠️ 2D CONSTRAINT: We only have X (time) and Y (price) axes available. The Z-axis (depth) is simulated through visual projection techniques (line styles, shading).
INTENDED USE
This tool is designed for traders and analysts who study Bradley Cowan's geometric market analysis methods. It helps visualize:
- Market structure in geometric terms
- Potential support/resistance zones at cube edges
- Cycle timing relationships using √2 and √3 ratios
- Harmonic price-time relationships
The cube projection should be used as one component of a comprehensive analysis approach, combined with other technical tools and fundamental analysis.
MATHEMATICAL FOUNDATION
While the visual representation involves approximations, the core √3 relationship is mathematically sound:
- For any cube, the body diagonal = √3 × side length
- The face diagonal = √2 × side length
- These ratios are preserved in the price dimension calculations
HOW TO USE
1. Select your starting date (Point A) - typically a significant low or high
2. Select your ending date (Point E) - the opposite extreme pivot
3. The indicator automatically constructs the cube geometry
4. Analyze the cube edges, diagonals, and faces for market structure insights
5. Adjust colors and opacity to suit your chart aesthetic
TECHNICAL NOTES
- Works on all timeframes and instruments
- Best viewed on charts with sufficient historical data
- Cube updates in real-time as new bars form
- Range selection is marked with vertical lines and shading
- Calculator table shows Point A, Point E, side length, and bar measurements
ACKNOWLEDGMENT
This indicator is based on the geometric market analysis principles developed by Bradley F. Cowan. Users are encouraged to study Cowan's original works for deeper understanding of the theoretical framework.
DISCLAIMER
This indicator is for educational and analytical purposes only. It does not constitute financial advice. Past performance does not guarantee future results. Always conduct your own research and risk management before making trading decisions.

Doctor Analytics – EMERSON >🜂 Doctor Analytics – EMERSON >
“Where probability replaces emotion.”
Doctor Analytics – EMERSON > isn’t a tool — it’s a behavioral correction system for traders who refuse to gamble.
Built on the Kulture Metrics / Emerson Moss framework, it combines the raw aggression of momentum with the cold precision of mathematical expectancy.
This isn’t signal-hunting; it’s surgical probability alignment.
Inside every calculation beats the Path-Integral Engine — Linetsky-inspired stochastic modeling that measures the expected payoff of all recent price paths, weighted by volatility and discounted through time. It watches volatility breathe, measures it, and only moves when mathematics agrees with momentum.
The Kulture Metrics Dashboard transforms trading discipline into data:
Tracks your live balance, dynamic risk %, and target %.
Computes exact dollar risk and payoff values in real time.
Enforces drawdown protection with an automatic Loss Halt Flag after two consecutive hits.
Embeds compliance awareness through a Trust Bank audit watermark.
While others chase trends, EMERSON > calculates the probability of continuation.
Each signal passes through layered verification — trend integrity, volatility gate, and path-integral confirmation — filtering out emotional noise until only certainty remains.
Benefits that dominate the screen:
⚙️ Real-time equity evolution and risk-to-reward feedback.
⚙️ Path-integral logic that aligns with professional option-pricing models.
⚙️ Adaptive volatility gating for ultra-clean confirmations.
⚙️ Visual dashboard — no spreadsheets, no hesitation, no excuses.
Doctor Analytics – EMERSON > is more than an indicator; it’s a trading philosophy encoded in Pine v6.
For those who understand that discipline and mathematics are the last forms of rebellion.
Kulture Metrics | EMERSON — When logic meets inevitability.

Quantura - Supply & Demand Zone DetectionIntroduction
“Quantura – Supply & Demand Zone Detection” is an advanced indicator designed to automatically detect and visualize institutional supply and demand zones, as well as breaker blocks, directly on the chart. The tool helps traders identify key areas of market imbalance and potential reversal or continuation zones, based on price structure, volume, and ATR dynamics.
Originality & Value
This indicator provides a unique and adaptive method of zone detection that goes beyond simple pivot or candle-based logic. It merges multiple layers of confirmation—volume sensitivity, ATR filters, and swing structure—while dynamically tracking how zones evolve as the market progresses. Unlike traditional supply and demand indicators, this script also detects and plots Breaker Zones when previous imbalances are violated, giving traders an extra layer of market context.
The key values of this tool include:
Automated detection of high-probability supply and demand zones.
Integration of both volume and ATR filters for precision and adaptability.
Dynamic zone merging and updating based on price evolution.
Identification of breaker blocks (invalidated zones) to visualize market structure shifts.
Optional bullish and bearish trade signals when zones are retested.
Clear, visually optimized plotting for efficient chart interpretation.
Functionality & Core Logic
The indicator continuously scans recent price data for swing highs/lows and combines them with optional volume and ATR conditions to validate potential zones.
Demand Zones are formed when price action indicates accumulation or a strong bullish rejection from a low area.
Supply Zones are created when distribution or strong bearish rejection occurs near local highs.
Breaker Blocks appear when existing zones are invalidated by price, helping traders visualize potential market structure shifts.
Bullish and bearish signals appear when price re-enters an active zone or breaks through a breaker block.
Parameters & Customization
Demand Zones / Supply Zones: Enable or disable each individually.
Breaker Zones: Activate breaker block detection for invalidated zones.
Volume Filter: Optional filter to only confirm zones when volume exceeds its long-term average by a user-defined multiplier.
ATR Filter: Optional filter for volatility confirmation, ensuring zones form under strong momentum conditions.
Swing Length: Controls the number of bars used to detect structural pivots.
Sensitivity Controls: Adjustable ATR and volume multipliers to fine-tune detection responsiveness.
Signals: Toggle for on-chart bullish (▲) and bearish (▼) signal plotting when price interacts with zones.
Color Customization: User-defined bullish and bearish colors for both standard and breaker zones.
Core Calculations
Zones are detected using pivot highs and lows with a defined lookback and lookahead period.
Additional filters apply if ATR and volume are enabled, requiring conditions like “ATR > average * multiplier” and “Volume > average * multiplier.”
Detected zones are merged if overlapping, keeping the chart clean and logical.
When price breaks through a zone, the original box is closed, and a new breaker zone is plotted automatically.
Bullish and bearish markers appear when zones are retested from the opposite side.
Visualization & Display
Demand zones are shaded in semi-transparent bullish color (default: blue).
Supply zones are shaded in semi-transparent bearish color (default: red).
Breaker zones appear when previous imbalances are broken, helping to spot structural shifts.
Optional arrows (▲ / ▼) indicate potential buy or sell reactions on zone interaction.
Use Cases
Identify institutional areas of accumulation (demand) or distribution (supply).
Detect potential breakout traps and market structure shifts using breaker zones.
Combine with other tools such as volume profile, EMA, or liquidity indicators for deeper confirmation.
Observe retests and reactions of zones to anticipate possible reversals or continuations.
Apply multi-timeframe analysis to align higher timeframe zones with lower timeframe entries.
Limitations & Recommendations
The indicator does not predict future price movement; it highlights structural imbalances only.
Performance depends on chosen swing length and sensitivity—users should optimize parameters for each market.
Works best in volatile markets where supply and demand imbalances are clearly expressed.
Should be used as part of a broader trading framework, not as a standalone signal generator.
Markets & Timeframes
The “Quantura – Supply & Demand Zone Detection” indicator is suitable for all asset classes including cryptocurrencies, Forex, indices, commodities, and equities. It performs reliably across multiple timeframes, from intraday scalping to higher timeframe swing analysis.
Author & Access
Developed 100% by Quantura. Published as a Open-source script indicator. Access is free.
Important
This description complies with TradingView’s Script Publishing and House Rules. It clearly explains the indicator’s originality, underlying logic, functionality, and intended use without unrealistic claims or performance guarantees.

SMC ORB vs Pre-Market SPY/IWMStacks institutional confluences such as Smart Money Concepts, Inner Circle Trading, volatility, and structure.
Plots Premarket high/low and 15 minute Opening range
Plots the first sweep of Premarket high/low and any subsequent orb breaks

SMC ORB vs PM ALPHADesigned to stack institutional confluences such as Smart Money Concepts, Inner Circle Trading, volatility, and market structure.
Plots pre-market high/low and 15 Opening Range.
Plots first sweep of Pre-market high/low as well as orb break/holds.
TP of Previous high/low & SL optional

REJECTION DETECTOR🔥 CTR (Candle Terjepit - Rejection)
This indicator is specifically designed to detect Rejection Candles, which are moments when the price rejects a certain level and has the potential to form a strong reversal or rapid reaction — an important signal for scalpers and price action traders.
💡 Key Concept:
Rejection is a form of market reaction to areas of liquidity, support-resistance, or order block zones. Candles with long tails and small bodies indicate an imbalance between buyers and sellers, providing an early indication that the price may soon reverse.
⚙️ Key Features
🔍 Automatic Rejection Candle Detection (Buy & Sell)
🧠 Body-to-tail ratio filter for more precise signal validation
🎨 Customizable candle colors and appearance
📊 Suitable for all pairs and timeframes

Strategy Builder v1.0.0 [BigBeluga]🔵 OVERVIEW
The Strategy Builder combines advanced price-action logic, smart-money concepts, and volatility-adaptive momentum signals to automate high-quality entries and exits across any market. It blends trend recognition, market structure shifts, order block reactions, imbalance (FVG) signals, liquidity sweeps, candlestick confirmations, and oscillator-powered divergences into one cohesive engine.
Whether used as a full automation workflow or as a structured confirmation framework, this strategy provides a disciplined, rules-driven method to trade with logic — not emotion.
🔵 BACKTEST WINDOW CONTROL
This module allows you to restrict strategy execution to a specific historical period.
Ideal for performance isolation, regime testing, and forward-walk validation.
Limit Backtest Window
Enabling this option activates custom date filters for the backtest engine.
Start — Define the starting date & time for backtesting
End — Define the ending date & time for backtesting
Only trades and signals inside this window are executed
Reduces computation load on large datasets
Useful for testing specific market environments (e.g., bull cycles, crash periods, sideways regimes)
🔵 SIGNAL GLOSSARY (Advanced Technical Explanation)
Traders can build long and short setups using up to 6 configurable entry conditions for each direction.
Every condition can be set as Bullish or Bearish and mapped to any signal source — allowing deep customization
Below is the full internal logic overview of every signal available in the Strategy Builder.
Signals are based on trend models, volatility structures, liquidity logic, oscillator behavior, and market structure mapping.
Trend Signals (Low-Lag Trend Engine)
Uses a proprietary low-lag baseline + momentum gradient model to detect directional bias.
Trend Signal — Momentum breaks above/below adaptive trend baseline.
Trend Signal+ — Stronger trend confirmation using volatility-weighted momentum.
Trend Signal Any — Triggers when any bullish/bearish trend signal appears.
SmartBand & Retests (Adaptive Volatility Bands)
Dynamic envelope that contracts/expands with volatility & trend strength.
SmartBand Retest — Price retests dynamic band and rejects, confirming continuation.
ActionWave Signals (Impulse-Pullback Engine)
Tracks wave behavior, acceleration and deceleration in price.
ActionWave — Detects directional impulse strength vs pullback weakness.
ActionWave Cross — Momentum acceleration threshold crossed → trend ignition.
Magnet Signals (Liquidity Gravity + Mean Reversion Bias)
Detects zones where price is being drawn due to liquidity voids or imbalance.
Magnet — Trend and liquidity pressure align, creating directional “pull.”
MagnetBar Low Momentum — Low-volatility compression → pre-breakout condition.
Flow Trend (Directional Flow State + ATR Envelope)
Higher-timeframe bias confirmation + dynamic volatility filter.
FlowTrend — Confirms major directional bias (uptrend or downtrend).
FlowTrend Retest — Price tests HTF flow band and rejects → trend resume.
Voltix (Volatility Expansion Pulse)
Detects regime shift from quiet accumulation → trending expansion.
Voltix — Breakout volatility signature, trend acceleration trigger.
Candlestick Pattern (Algorithmic Price Action Recognition)
Auto-recognizes meaningful reversal or continuation candle formations.
Candlestick Pattern — Confirms momentum reversal/continuation via candle logic.
OrderBlock Logic (Institutional Footprint System)
Institutional demand/supply zone tracking with mitigation logic.
Order Block Touch — Price taps institutional zone → reaction filter.
Order Block Break — OB invalidation → institutional flow shift.
Market Structure Engine (Swing Logic + Volume Confirmation)
Tracks major swing breaks and structural reversals.
BoS — Break of Structure in trend direction (continuation bias).
ChoCh — Change of Character — early reversal marker.
Fair Value Gaps (Imbalance & Volume Displacement)
Identifies inefficiencies caused by rapid displacement moves.
FVG Created — Price leaves inefficiency behind.
FVG Retest — Price returns to rebalance inefficiency → reaction zone.
Liquidity Events (Stop-Run & Reversal Logic)
Detects stop-hunt events and liquidity sweeps.
SFP — Swing failure & wick sweep → reversal confirmation.
Liquidity Created — New equal highs/lows form liquidity pool.
Liquidity Grab — Sweep through liquidity line followed by rejection.
Support / Resistance Break Logic
Adaptive zone recognition + momentum confirmation.
Support/Resistance Cross — Zone decisively broken → structural shift.
Pattern Breakouts (Market Geometry Engine)
Tracks breakout from compression & expansion formations.
Channel Break — Channel breakout → trend acceleration.
Wedge Break — Break from contraction wedge → burst of momentum.
Session Logic (Opening Range Behavior)
Session-based volatility trigger.
Session Break — Break above/below session opening range.
Momentum / Reversal Oscillator Suite
Oscillator-driven exhaustion & reversal signals.
Nautilus Signals — Momentum reversal signature (oscillator shift).
Nautilus Peak — Momentum peak → exhaustion risk.
OverSold/Overbought ❖ — Extreme exhaustion zones → reversal setup.
DipX Signals ✦ — Dip buy / Dip sell timing, micro-reversal engine.
Advanced Divergence Engine
Momentum/price disagreement layer with multi-trigger confirmation.
Normal Divergence — Classic divergence reversal.
Hidden Divergence — Trend continuation divergence.
Multiple Divergence — Multiple divergence confirmations stacked → high confidence.
🔧 Adjustable Signal Logic
Some signals in this system can be additionally refined through the strategy settings panel.
This allows traders to tune internal behavior for different market regimes, assets, and volatility conditions.
🔵 LONG / SHORT EXIT CONDITIONS
This section allows you to automate exits using the same advanced market conditions available for entries.
Each exit rule consists of:
Toggle — Enable/disable individual exit rule.
Direction Filter — Trigger exit only if selected market bias appears (Bullish/Bearish).
Signal Type — Choose which market event triggers the exit (same list as entry conditions).
When the active conditions are met, the strategy automatically closes the current position — ensuring emotion-free risk management and systematic trade control.
🔵 TAKE PROFIT & STOP LOSS SYSTEM
This strategy builder provides a fully dynamic risk-management engine designed for both systematic traders and discretionary confirmation users.
Take Profit Logic
Scale out of trades progressively or exit fully using algorithmic TP levels.
Up to 3 Take-Profit targets available
Choose TP calculation method:
• ATR-based distance (volatility-adaptive targets)
• %-based distance (fixed percentage from entry)
Define Size — ATR multiplier or % value
Custom Exit Size per TP (e.g., 25% / 25% / 50%)
Visual TP plotting on chart for clarity
Stop Loss Logic
Automated protection logic for every trade.
Two SL Modes:
• Fixed Stop Loss — static SL from entry
• Trailing Stop Loss — SL follows price as trade progresses
Distance options:
• ATR multiplier (adapts to volatility)
• %-based from entry (fixed distance)
SL dynamically draws on chart for transparency
Trailing SL behavior:
Follows price only in profitable direction
Never moves against the trade
Locks profits as trend develops
🔵 Strategy Dashboard
A compact on-chart performance dashboard is included to help monitor live trade status and backtest results in real time.
It displays key metrics:
Start Capital — Initial account balance used in simulation.
Position Size — % of capital allocated per trade based on user settings (It changes if the trade hits take profits, when more than one take profit is selected).
Current Trade — Shows active trade direction (Long / Short) and real-time % return from entry.
Closed Trades — Counter of completed positions, useful for reading sample size during testing.
🔵 CONCLUSION
The Strategy Builder brings together a powerful suite of smart-money and momentum-driven signals, allowing traders to automate robust trade logic built on modern market structure concepts. With access to trend filters, order blocks, liquidity events, divergence signals, volatility cues, and session-based triggers, it provides a deeply adaptive trade engine capable of fitting many market environments.

Geometric Price-Time Triangle Calculator═══════════════════════════════════════════════════
GEOMETRIC PRICE-TIME TRIANGLE CALCULATOR
═══════════════════════════════════════════════════
Calculates Point C of a geometric triangle using different rotation angles from any selected price swing. Based on Bradley F. Cowan's Price-Time Vector (PTV) methods from "Four-Dimensional Stock Market Structures and Cycles."
📐 WHAT IT DOES
────────────────────────────────────────────────────
Select two points (A and B) on any swing, choose an angle, and the indicator calculates where Point C would be mathematically. It's just vector rotation applied to price charts.
This shows you where Point C lands in both price AND time based on pure geometry - not a prediction, just a calculation.
🎯 FEATURES
────────────────────────────────────────────────────
✓ 10 Different Angles
• Gann ratios: 18.435° (1x3), 26.565° (1x2), 45° (1x1), 63.435° (2x1), 71.565° (3x1)
• Other angles: 30°, 60°, 90°, 120°, 150°
✓ Visual Triangle
• Adjustable colors and opacity for points A, B, C
• Line styles: Solid, Dashed, Dotted
• Extend lines: None, Left, Right, Both
✓ Crosshair at Point C
• Shows where Point C is located
• Vertical line = bar position
• Horizontal line = price level
✓ Data Table
• Shows all calculations
• Price-to-Bar ratio
• Point C location (price and bars from A/B)
• Toggle on/off
🔧 HOW TO USE
────────────────────────────────────────────────────
1. Pick your swing start date (Point A)
2. Pick your swing end date (Point B) - make sure these dates capture the actual high/low of your swing
3. Choose an angle from the dropdown
4. Look at Point C - that's where the geometry puts it
Different angles = different Point C locations. Whether price actually goes there is up to the market.
📊 THE ANGLES
────────────────────────────────────────────────────
- 18.435° (1x3) - Shallow rotation
- 26.565° (1x2) - Moderate rotation
- 45° (1x1) - Gann's balanced ratio
- 60° - Equilateral triangle (default)
- 63.435° (2x1) - Steeper rotation
- 71.565° (3x1) - Very steep rotation
- 90° - Right angle
- 120°-150° - Obtuse angles
💡 PRACTICAL USE
────────────────────────────────────────────────────
→ See where geometric patterns would complete
→ Test if your market respects certain angles
→ Find where multiple angles converge
→ Compare projected Point C to actual price action
→ Use 90° to see symmetrical price/time relationships
→ Backtest historical swings to see what worked
⚙️ HOW IT WORKS
────────────────────────────────────────────────────
1. Takes your AB swing
2. Calculates the BA vector (reverse direction)
3. Normalizes price and time using Price-to-Bar ratio
4. Rotates the vector by your selected angle
5. Converts back to chart coordinates
Basic trigonometry. That's all it is.
📚 BACKGROUND
────────────────────────────────────────────────────
Based on Bradley F. Cowan's Price-Time Vector (PTV) concept from "Four-Dimensional Stock Market Structures and Cycles" and W.D. Gann's geometric angle analysis. Cowan observed that markets sometimes complete geometric patterns. This tool calculates where those patterns would complete mathematically. Whether price actually respects these geometric relationships is something you need to test yourself.
⚠️ IMPORTANT
────────────────────────────────────────────────────
- This is geometric calculation, not prediction
- Point C shows where the math puts it, not where price will go
- Some angles might work for your market, some won't
- Test it yourself on historical data
- Price-to-Bar Ratio stays constant regardless of angle
- Don't trade based on this alone
- Works on all timeframes and assets
🎨 CUSTOMIZATION
────────────────────────────────────────────────────
- Show/hide triangle
- Individual colors for A, B, C points
- Adjust opacity (0-100)
- Line styles for each triangle side
- Extend lines left/right/both/none
- Show/hide data table
- Crosshair color and width
- Customizable table colors
═══════════════════════════════════════════════════

Higher Timeframe Box & Divider - All Candles [GoldnHunt]The Higher Timeframe Box & Divider – All Candles indicator visually maps higher timeframe candles onto lower timeframe charts.
It highlights the open and close range of each higher timeframe candle as a box, along with a vertical divider marking the start of each new period.
This helps traders clearly see higher timeframe structure and momentum flow without switching charts.
Features:
Draws a box showing only the body (open to close) of each higher timeframe candle.
Uses candle color to represent bullish and bearish momentum.
Adds a divider line for each new higher timeframe candle.
Works across all symbols and timeframes.
Lightweight and optimized for performance.
Use case:
Perfect for traders using multi-timeframe (MTF) analysis who want to visualize higher timeframe candle progression while observing lower timeframe price action.

Actionable Signals: Hammers, Shooters, and Inside Bars#TheStrat Actionable Signals
This indicator automatically detects hammers, shooters, and inside bars, which are key reversal and continuation patterns that can signal actionable trading opportunities. These 'Actionable Signals' are based on #TheStrat methodology developed by Rob Smith.
This indicator allows you to use a 'Classic' hammer/shooter definition as well as to customize hammer/shooter candle proportions to your liking.
Pattern Types
Classic Hammer/Shooter - Traditional pin bar pattern featuring a small body (≤30% of range) positioned at the extreme with a long dominant wick (3x+ body ratio). The most widely recognized reversal signal.
Custom Hammer/Shooter - Fully adjustable pattern parameters allowing you to fine-tune detection criteria for your specific trading strategy and timeframe preferences.
Paddle - Strong momentum bar with a large body (up to 85%) closing within 5% of the extreme. Identifies continuation moves with conviction. Color-validated (green hammers, red shooters).
Rejection - Wick-dominant pattern showing price rejection at extremes. Features moderate body (≤60%) with strong rejection wick (≥40%). Color-agnostic for flexibility.
Inside Bar - Bar contained entirely within the previous bar's range, signaling consolidation and potential breakout setups.
Key Features
Multi-Pattern Detection: Enable multiple pattern types simultaneously to capture different market structures
Pivot Validation: Optional swing high/low requirement ensures patterns occur at meaningful inflection points
Session Filtering: Restrict signals to specific trading sessions across multiple timezones
Visual Clarity: Color-coded markers distinguish between pattern types (customize via Style settings)
Testing Panel: Built-in debugging tool displays detailed bar analysis for fine-tuning detection parameters
How to Use
Default Settings: Start with Classic, Paddle, and Rejection patterns enabled for balanced signal generation
Pivot Filter: Keep "Require Swing High/Low" enabled to focus on patterns at key support/resistance levels
Customization: Adjust pattern strictness parameters based on your timeframe and trading style
Colors: Modify marker colors and styles through the Style tab for optimal chart visibility
Testing Panel: Enable to see why patterns are or aren't triggering on specific bars
Please share any issues you encounter, it will help improve the script for everyone!
Note: This indicator displays historical patterns and should be used as part of a comprehensive trading strategy. Past performance does not guarantee future results.

Opposing Candle V2🟩 OC (Opposing Candle) Multi–Timeframe Framework
🔍 Overview
The OC Indicator automatically detects and displays Opposing Candles (OCs) across up to three timeframes.
An Opposing Candle is a candle that fully engulfs the previous one, signaling a potential shift in control — either a trend continuation or a trend reversal.
This multi–timeframe framework gives traders a structured way to visualize displacement, pullbacks, and momentum shifts between timeframes.
⚙️ How It Works
Each OC is drawn as a box showing:
High & Low → The candle’s full range
Open Line (black) → Key control level
Midline (white) → Candle equilibrium
Optional labels for timeframe and session
You can enable up to 3 timeframes (e.g., 30m / 1H / 4H) and adjust how many OCs to display for each.
📈 Trading Framework
🔹 Continuation Setup (Trend Following)
1. 4H Bias → Bullish or Bearish
Identify clear trend structure (HH/HL = bullish, LH/LL = bearish).
Confirm strong displacement and visible gaps between OCs — signs of momentum and healthy trend continuation.
2. 1H Confirmation OC
OC forms in the direction of the 4H bias, confirming control.
3. 30min Pullback OC
Opposite–colored OC appears → represents the pullback.
4. Entry Trigger
A yellow candle closes beyond the 30min OC open line, confirming the end of the pullback.
→ Enter in trend direction.
🎯 Targets
Target 1: Next 1H OC high or low (in trend direction)
Target 2: Next 4H OC high or low
🛑 Stop: Beyond the 30min OC’s opposite wick
🔹 Reversal Setup (Trend Shift)
1. 4H Structure → Extended or Losing Momentum
When there are no higher–timeframe gaps and no displacement, momentum weakens — often a sign of potential reversal.
2. Opposing OC Forms on HTF
A strong engulfing OC appears against the previous trend at a key structural level.
3. Lower–Timeframe Alignment
1H and 30min OCs begin forming in the new direction, confirming control shift.
4. Entry Trigger
Break of the lower–timeframe OC open line signals the reversal confirmation.
🟢 Example: Bullish Reversal
4H downtrend shows compression (no displacement)
4H bullish OC forms at support
30min breaks above a bearish OC’s open line → Go long
🔴 Example: Bearish Reversal
4H uptrend stalls at resistance
4H bearish OC forms
30min breaks below a bullish OC’s open line → Go short
🎯 Targets
Target 1: Nearest opposing 1H OC high/low
Target 2: Major 4H structural high/low
🛑 Stop: Beyond the reversal OC wick
🧠 Key Concepts
Displacement = Strength. Strong, impulsive moves with clear gaps between OCs show continuation.
Compression = Weakness. Overlapping candles and no HTF displacement often hint at reversal.
OC = Control Candle. The open line is the “line in the sand” — when price breaks it, control flips.
Multi–TF Confluence = Precision. 4H → 1H → 30m gives you structure → confirmation → entry accuracy.
🎨 Features
✅ Multi–Timeframe OC detection (default: 30m / 1H / 4H)
✅ Bullish & Bearish boxes with open and midlines
✅ Break candles highlighted yellow
✅ Optional labels (timeframe + session)
✅ Session filters (Asia, London, NYAM, NYPM)
✅ Fully customizable visuals and extension lengths
