CHOP Zone Entry Strategy + DMI/PSAR ExitThis is a Strategy with associated visual indicators and Long/Short and Reverse/Close Position Alerts for the Choppiness Index (CHOP) . It is used to determine if the market is choppy (trading sideways) or not choppy (trading within a trend in either direction). CHOP is not directional, so a DMI script was ported into this strategy to allow for trend confirmation and direction determination; it consists of an Average Directional Index (ADX) , Plus Directional Indicator (+DI) and Minus Directional Indicator (-DI) . In addition, a Parabolic SAR is also included to act as a trailing stop during any strong trends.
Development Notes
---------------------------
This indicator, and most of the descriptions below, were derived largely from the TradingView reference manual. Feedback and suggestions for improvement are more than welcome, as well are recommended Input settings and best practices for use.
www.tradingview.com
www.tradingview.com
www.tradingview.com
Recommend using the below DMI and PSAR indicators in conjunction with this script to fully visualize and understand how entry and exit conditions are chosen. Variable inputs should correlate between the scripts for uniformity and visual compatibility.
THANKS to LazyBear and his Momentum Squeeze script for helping me quickly develop a momentum state model for coloring the Chop line by trend.
Strategy Description
---------------------------
CHOP produces values that determine whether the market is choppy or trending . The closer the value is to 100 , the higher the choppiness levels , while the closer it is to 0 , the stronger the market is trending . Territories for both levels, and their associated upper and lower thresholds, are popularly defined using the Fibonacci Retracements, 61.8 and 38.2.
Basic Use
---------------------------
CHOP is often used to confirm the market condition to help you stay out of sideways markets and only enter when there is movement or imminent explosions. When readings are above the upper threshold, continued sideways movement may be expected, while readings below the lower threshold are typically indicative of a continuing trend. It is also used to anticipate upcoming trendiness changes, with the general belief that extended periods of consolidation (sideways movement) are followed by extended periods of strong, trending, directional movement, and vice versa.
One limitation in this index is that you must be cautious in deciding whether the range or trend will likely continue, or if it will reverse.
Confidence in price action and trend is higher when two or more indicators are in agreement -- while this strategy combines CHOP with both DMI and PSAR, we would still recommend pairing with other indicators to determine entry or exit trade opportunities.
Recommend also choosing 'Once Per Bar Close' when creating alerts.
Inputs
---------------------------
Strategy Direction - an option to only trade Short, Long, Both, or only in the direction of the Trend (Follow Trend is the Default).
Sensitivity - an incremental variable to test whether the past n candles are in the same trend state before triggering a delayed long or short alert (1 is the Default). Can help filter out noise and reduces active alerts.
Show Chop Index - two visual styles are provided for user preference, a visible Chop line with a background overlay, or a compact column and label only view.
Chop Lookback Period - the time period to be used in calculating CHOP (14 is the Default).
Chop Offset - changing this number will move the CHOP either forwards or backwards relative to the current market (0 is the Default).
Smooth Chop Line and Length - if enabled, the entered time period will be used in calculating a smooth average of the index (Enabled and 4 are the Defaults).
Color Line to Trend Direction - toggles whether the index line is colored to visually depict the current trend direction (Enabled is the Default).
Color Background - toggles the visibility of a background color based on the index state (Enabled is the Default).
Enable DMI Option - if enabled, then entry will be confirmed by and dependent on the ADX Key Level, with any close or reversal confirmed by both ADX and +/-DI to determine whether there is a strong trend present or not (Enabled is the Default).
ADX Smoothing - the time period to be used in calculating the ADX which has a smoothing component (14 is the Default).
DI Length - the time period to be used in calculating the DI (14 is the Default).
ADX Key Level - any trade with the ADX above the key level is a strong indicator that it is trending (23 to 25 is the suggested setting).
Enable PSAR Option - enables trailing stop loss orders (Enabled is the Default).
PSAR Start - the starting value for the Acceleration Force (0.015 is our chosen Default, 0.02 is more common).
PSAR Increment - the increment in which the Acceleration Force will move (0.001 is our chosen Default, 0.02 is more common).
PSAR Max Value - the maximum value of the Acceleration Factor (0.2 is the Default).
Color Candles Option - an option to transpose the CHOP condition levels to the main candle bars. Note that the outer red and green border will still be distinguished by whether each individual candle is bearish or bullish during the specified timeframe.
Note too that if both DMI and PSAR are deselected, then close determinations will default to a CHOP reversal strategy (e.g., close long when below 38.2 and close short when above 61.8). Though if either DMI or PSAR are enabled, then the CHOP reversal for close determination will automatically be disabled.
Indicator Visuals
---------------------------
For the candle colors, black indicates tight chop (45 to 55), yellow is loose chop (38.2 to 45 and 55 to 61.8), dark purple is trending down (< 38.2), and dark blue is trending up (> 61.8).
The background color has additional shades to differentiate a wider range of more levels…
• < 30 is dark purple
• 30 to 38.2 is purple
• 38.2 to 45 is light purple
• 45 to 55 is black
• 55 to 61.8 is light blue
• 61.8 to 70 is blue
• > 70 is dark blue
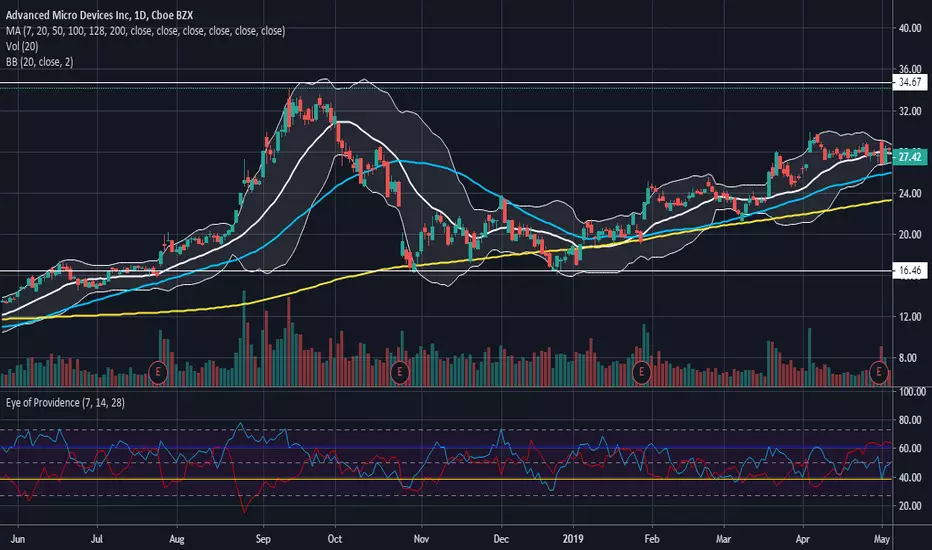
Long, Short, Close, and Reverse labels are plotted on the Chop line, which itself can be colored based on the trend. The chop line can also be hidden for a clean and compact, columnar view, which is my preferred option (see example image below).
Visual cues are intended to improve analysis and decrease interpretation time during trading, as well as to aid in understanding the purpose of this strategy and how its inclusion can benefit a comprehensive trading plan.
DMI and Trend Strength
---------------------------
To analyze trend strength, the focus should be on the ADX line and not the +DI or -DI lines. An ADX reading above 25 indicates a strong trend , while a reading below 20 indicates a weak or non-existent trend . A reading between those two values would be considered indeterminable. Though what is truly a strong trend or a weak trend depends on the financial instrument being examined; historical analysis can assist in determining appropriate values.
DMI exits trade when ADX is below the user selected key level (e.g., default is 25) and when the +/- DI lines cross (e.g., -DI > +DI exits long position and +DI > -DI exits short position).
PSAR and Trailing Stop
---------------------------
PSAR is a time and price based indicator that excels at measuring direction and duration, though not the actual strength of a trend, which is why we use this in conjunction with DMI. It is also included in this script as a trailing stop option to maximize gains during strong trends and to mitigate any false ADX strengthening signals.
This creates a parabola that is located below the candle during a Bullish trend and above during a Bearish trend. A buy or reversal is signaled when the price crosses above or below the Parabolic SAR.
Long/Short Entry
---------------------------
1. CHOP must be over 61.8 (long) or under 38.2 (short).
2. If DMI is enabled, then the ADX signal line must be above the user selected Key Level (default is 25).
3. If Sensitivity is selected, then that past candle must meet the criteria in step 1, as well as all the intermediate candles in between.
4. If "Follow Trend" is selected and PSAR is enabled, then a long position can only open when the momentum and PSAR are in an uptrend, or short when both are in a downtrend, to include all intermediate candles if the Sensitivity option is set on a past candle.
Close/Reverse
---------------------------
1. If DMI is enabled, then a close flag will be raised when the ADX signal drops below the Key Level (of 25), and -DI crosses over +DI (if long), or +DI crosses over -DI (if short).
2. If PSAR is enabled, then a close flag will be raised when the current trend state is opposite the last state.
3. If both DMI and PSAR are disabled, then a close flag will be raised if the Chop line drops under 38.2 (if long) or goes over 61.8 (if short).
4. If a Long or Short Entry is triggered on the same candle as any of the above close flags, then the position will be reversed, else the position will be closed.
Strategy Alerts
---------------------------
1. Long Entry
2. Short Entry
3. Reverse
4. Close
The provided backtest result is based on a position sizing of 10% equity with 100k initial capital. When testing SPX, disabling the DMI performed the best, but EURUSD performed poorly without it enabled, and TSLA had a small reduction in net profit. Timeframe likewise differed between commodities with TSLA performing best at 30M, SPX at 15M, and EURUSD at 4H. I do not plan on using this as a standalone strategy, but I also was expecting better results with the inclusion of EMI and PSAR to compliment the CHOP. Key elements of this script will likely be included in future, more holistic strategies.
Disclaimer
---------------------------
Past performance may not be indicative of future results. Due to various factors, including changing market conditions, the strategy may no longer perform as well as in historical backtesting. This post and the script are not intended to provide any financial advice. Trade at your own risk.
No known repainting, though there may be if an offset is introduced in the Inputs. I did my best not to code any other variables that repaint, but cannot fully attest to this fact.
CHOP

Choppiness Index and RSI by ceyhun
Choppiness Index and RSI by ceyhun
This indicator is based on the inverse relationship between CHOP and RSI.
Bar color
If the RSI is greater than CHOP, the Bar color will be blue.
If CHOP is greater than RSI, the bar color will be red.
CHOP
If CHOP is less than 38.2, the color will turn blue. positive
If the CHOP is between 38.2 and 61.8, the color will be yellow and neutral.
If CHOP is greater than 61.8, the color will turn red. negative
Rsi
If Rsi is greater than 61.8, the color will turn blue, positive
If Rsi is between 38.2 and 61.8, the color will be hexagonal and neutral
If Rsi is less than 38.2 the color will be red, negative
The Choppiness Index (CHOP) is an indicator designed to determine if the market is choppy (trading sideways) or not choppy (trading within a trend in either direction). The Choppiness Index is an example of an indicator that is not directional at all. CHOP is not meant to predict future market direction, it is a metric to be used to for defining the market's trendiness only. A basic understanding of the indicator would be; higher values equal more choppiness, while lower values indicate directional trending.
Relative Strength Index (RSI)
The Relative Strength Index (RSI) is a well versed momentum based oscillator which is used to measure the speed (velocity) as well as the change (magnitude) of directional price movements. Essentially the RSI, when graphed, provides a visual mean to monitor both the current, as well as historical, strength and weakness of a particular market. The strength or weakness is based on closing prices over the duration of a specified trading period creating a reliable metric of price and momentum changes. Given the popularity of cash settled instruments (stock indexes) and leveraged financial products (the entire field of derivatives); RSI has proven to be a viable indicator of price movements.

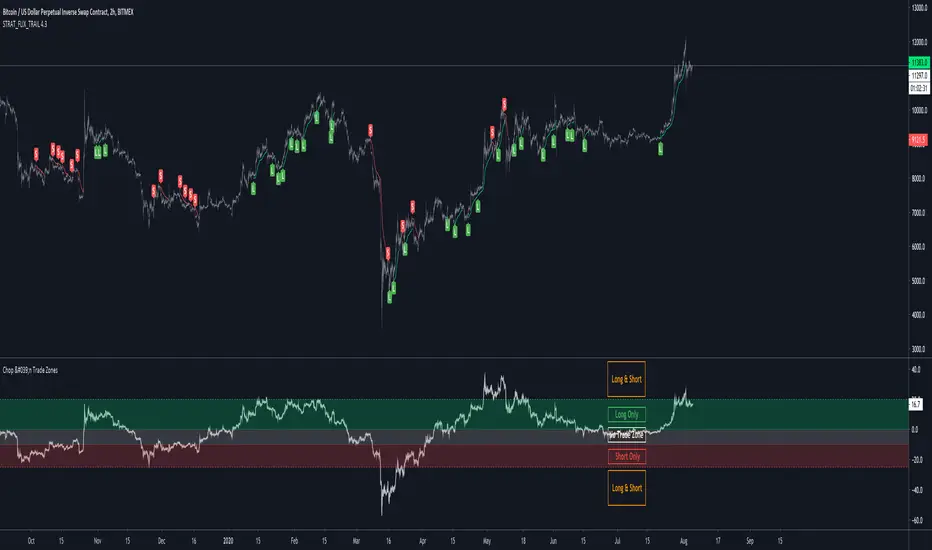
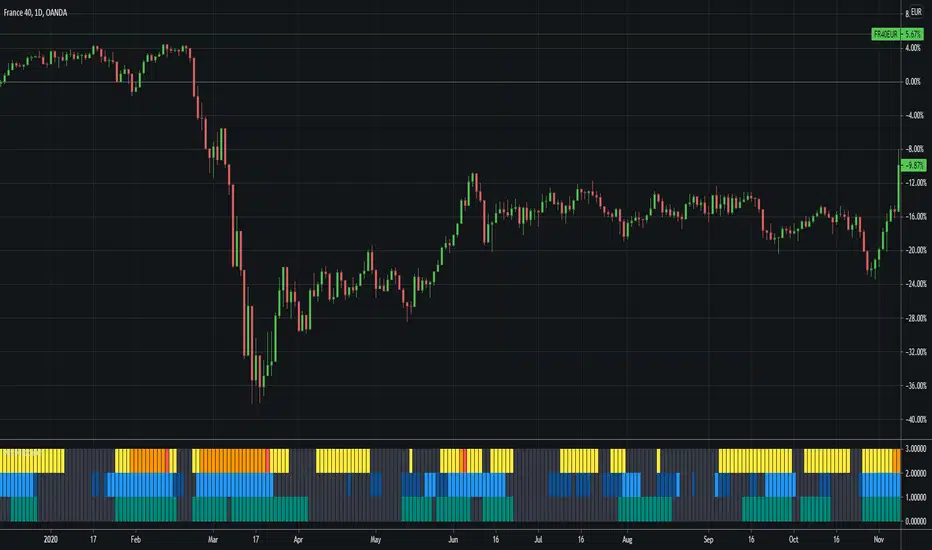
Tool: Chop and Trade Zones (v2)This is a refactored and advanced version of my filter tool "Chop and Trade Zones"
A simple yet powerful way to filter out choppy ranges or sideways moves without missing out on good trades.
It calculates the %-distance of the price to a moving average so you can ignore buy/sell signals around the center line.
The upper and lower line are thresholds to catch reversals of the trend when the distance to moving average is increasing.
New Features:
More than 60+ Moving Averages to choose from
Multi-Timeframe Selection with Repaint Protection
Signal Plot so you can access the signal from another TradingView study/strategy (0 = No Trade Zone / 1 = Long Only / 2 = Short Only / 3 = Long & Short Allowed)
Alerts for Long/Short Zones (you could enable/disable your trading bots automatically)

Tool: Chop & Trade ZonesA simple yet powerful way to filter out choppy ranges or sideways moves without missing out on good trades
It calculates the %-distance of the price to a moving average so you can ignore buy/sell signals around the center line.
The upper and lower line are thresholds to catch reversals of the trend when the distance to moving average is increasing.
Thanks @dgtrd and @imzeeshan for the inspiration 🙏
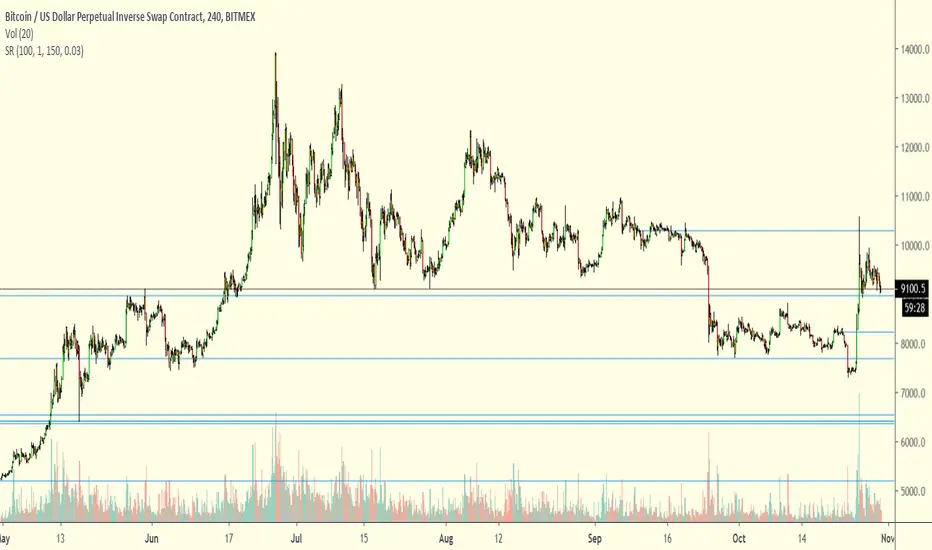
Chop Zone 9000 Chop Zone 9000 is based off Chop Zone by E.W Dreiss. Unlike the original Chop Zone, the main use for this iteration is support and resistance. There are 5 bars and each one represents a line of resistance. There will be areas where all red bars seem to clear up magically— this is due to gap ups or breakouts. The greatest benefit from this indicator is the ability to see if breakout attempts are successful. If the indicator sinks back into the red, then it is obvious that the trade should be abandoned.
I have implemented several alerts in this script. The most important alerts are the level 5 break, where the 5th bar is blue. It is common for price to stagnate if only the first few rows are blue. Therefore, I suggest it is certainly valuable to simply wait for all levels to clear before entering a trade.

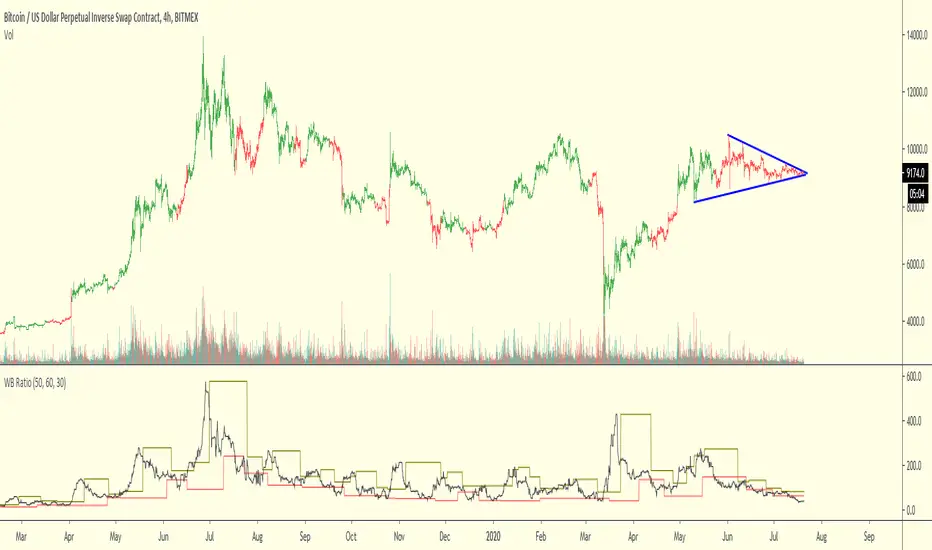
WB RatioThis oscillator should help identify when the price is chopping or trending.
It may be used as a filter for other strategies
The first input is a smoother while the second and third determine the reaction speed
Chop & Trend===========
Chop & Trend
===========
A handy little indicator illustrating not only areas of Chop or "flat" market conditions, but also to indicate the start of a new trend and the new trend's direction.
-----------
Using just a few algorithms to indicate the aforementioned (RSI, Jurik Moving Average and Angle of MA) we've tried to keep it simple as we believe adding too many variables can only degrade a good indicator, and not enhance it, as many would lead you to believe.
There's a few settings to play with regarding Relative Strength, Jurik MA and the ability to set an angle to determine when chop/trend starts or ends.
Good Luck and Happy Trading!
-theCrypster
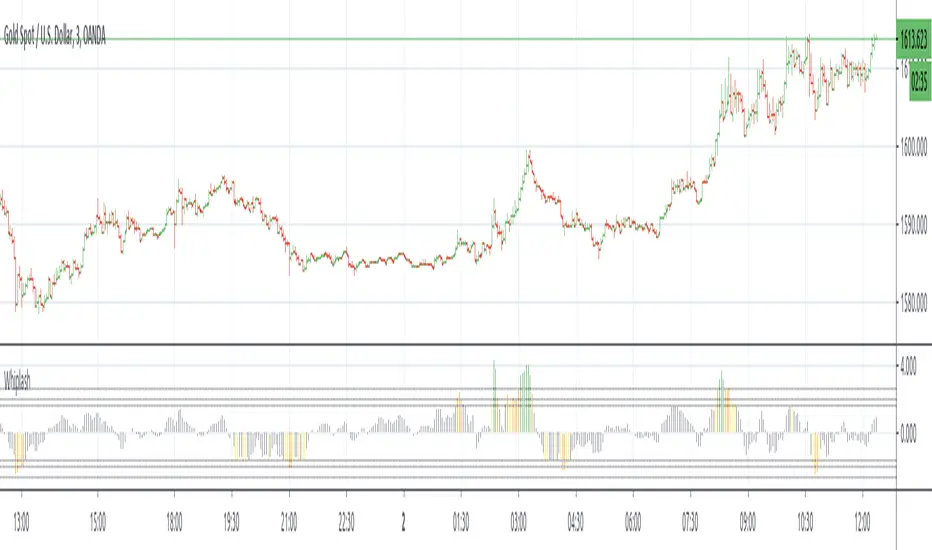
WhipLashThis is a study to determine if small candle bodies (little difference between open and close), regardless of overall candle length (high/low), can be used to filter choppy markets.
The indicator will calculate the selected average "MA Mode" of (close-open). To standardize this result and ensure any filters/thresholds do not need to be recalculated for each instrument the result will be used to calculate the Z Score.
The idea is that when candle bodies are small there is very little actual price movement, and therefore price is choppy. When considering the Z Score of that result, any outliers ie larger candle bodies, could show a potential trend forming. This indicator is similar to QStick but allows more customization by the user.
MA Mode determines which MA is used to smooth the results of (close-open)
Price Smoothing is the number of running periods the MA Mode is calculated for.
The three Thresholds are preset to the 90%, 95%, and 99% levels for Z Score. If these thresholds are altered you may wish to also alter the horizontal lines programmed for each level on the positive and negative sides.
The Z Length is the period for which the Z Score is calculated
Multiple MA Options Credits to @Fractured
Bits and Pieces from @AlexGrover, @Montyjus, and @Jiehonglim
As always, trade at your own risk.
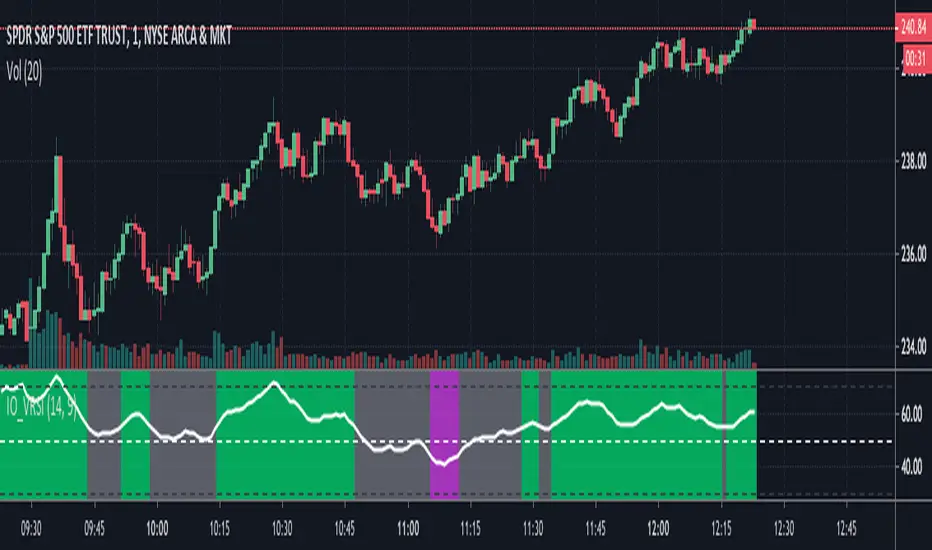
IO_VRSIOriginal Idea by Invsto
In this indicator, I explore the core concepts of RSI and extend it with smoothening to determine volatility.
Usage:
LIME/GREEN : High Volatility and BULLISH trend
RED/FUCHSIA : High Volatility and BEARISH trend
GRAY: Low volatility/Potential Chop Zone
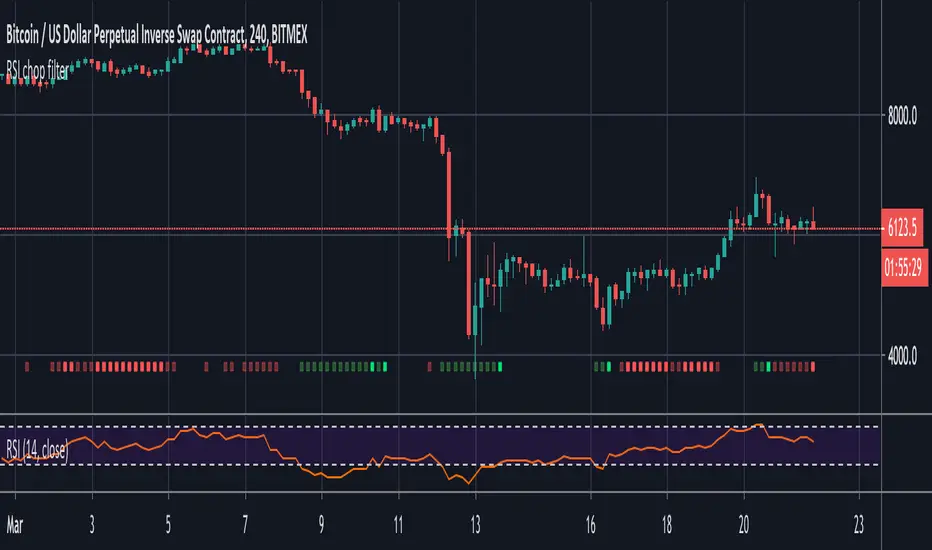
RSI chop filterThis demonstrates how you might filter your signals using RSI, but the same technique could be applied to Stochastic RSI and any other oscillator that has overbought and oversold conditions.
Use it as a visual indicator to determine when to enter a trade:
Red = Chop zone (no trade)
Bright red = Tight chop (dear god stay away)
Green = Overbought or oversold (signals permitted)
Bright green = Crossing up/down (take the trade)
To apply the filter, simply add 'and not chop' after your conditions as seen in the commented out example.
Gordon-RMATRENDTrend Indicator displaying signals for SHORT/LONG. Good results for Low Timeframe (1H) Crypto/FIAT pairs.
Use of CHOP, RMA & Volume indicators.
Have had success using it on XBT/USD & BTC/USD Pairs.

VQZL Z-ScoreVolatility Qaulity Zero Line attempts to keep a trader out of ranging markets, but the original calculation on TradingView had to be adjusted for each instrument. To avoid this issue, I have applied a z-score calculation to the VQZL so the result is standardized for all instruments. A Z-Score is simply a value's relationship to the mean (average) of a group of values, measured in terms of standard deviations from the mean.
This calculation allows us to compare current volatility to the mean (moving average) of the population (Z-Length). The closer the VQZL Z-Score is to the mean, the closer it will be to the Zero Line and therefore price is likely consolidating and choppy. The farther VQZL Z-Score is from the mean, the more likely price is trending.
The MA Mode determines the Moving Average used to calculate VQZL itself. The Z-Score is ALWAYS calculated with a simple moving average (as that is the standard calculation for Z-Score).
The Threshold Levels are the levels at which VQZL Z-Score will change from gray to yellow, orange, green (bullish), or red (bearish). These levels can be adjusted but you should adjust the Threshold Lines as well (in the style section), so they line up with your adjusted values.
Statistically speaking, confidence levels in relation to Z-Score are noted below. The built in Threshold Levels are the positive and negative values for 90%, 95%, and 99%. This would indicate when volatility is greater than these values they are out of the ordinary from the standard range. You may wish to adjust these levels for VQZL Z-Score to be more responsive to your trading need
80% :: 1.28
85% :: 1.44
90% :: 1.64
95% :: 1.96
99% :: 2.58
As always, trade at your own risk.
VQZL Created by Investo And Adapted From @sarangab
Multiple MA Options Credits to @Fractured
Bits and Pieces from @AlexGrover and @Montyjus

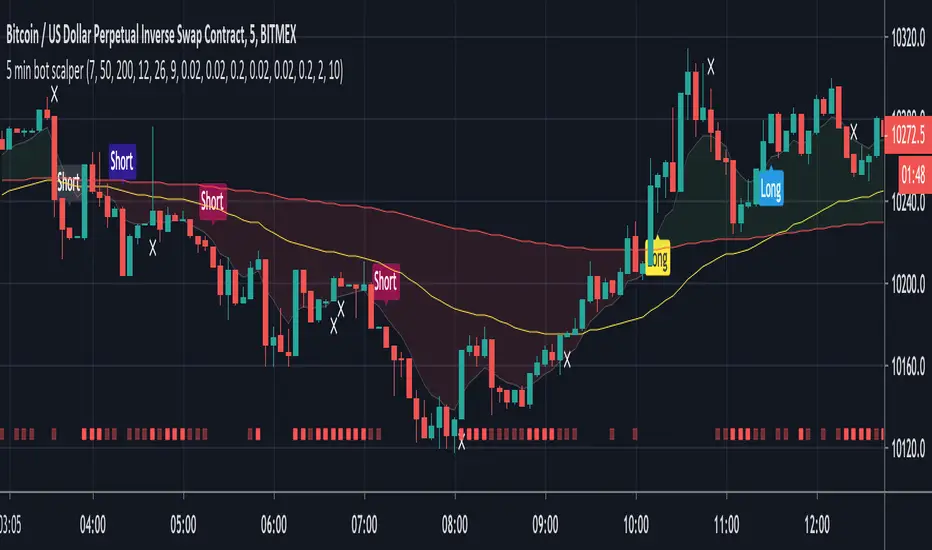
5 min bot scalperSAR signals (Parabolic and Lucid) combined with UT pivots, all filtered by the 200 MA. Golden and death crosses are also included to catch larger moves out-with long/short trends. These are filtered by my chop indicator to remove sideways signals.
This is designed for the 5 minute chart but may be useful elsewhere with some tweaking.
Alerts are included for long, short and exit signals.
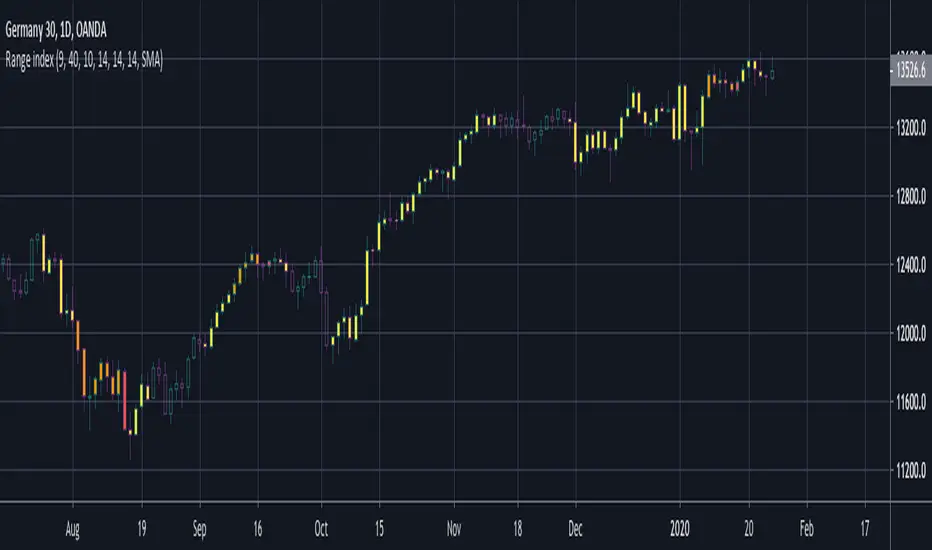
BERLIN Range Index | Panel versionThe original problem: The choppiness index is great at finding ranging markets, but it is sometimes very slow, which means most of the time it only catches the end of a trend.
This indicator tries to solve this. It uses the choppiness index and filters it using a factor that is based on the standard deviation of the ATR.
The ATR based filter is calculated by first calculating the running standard deviation of the ATR, and then looking at that in relation to its recent low to find a filtering factor to use on the choppiness index. This makes the choppiness index more reactive to trends, but also slightly more likely to missidentify ranges.
This is the panel version of the indicator. It plots the index and min/max values, as well as background colors to tell you when it thinks the market is ranging or trending.
Yellow = Trending
Transparent gray = Ranging

BERLIN Range Index | Bar color versionThe original problem: The choppiness index is great at finding ranging markets, but it is sometimes very slow, which means most of the time it only catches the end of a trend.
This indicator tries to solve this. It uses the choppiness index and filters it using a factor that is based on the standard deviation of the ATR.
The ATR based filter is calculated by first calculating the running standard deviation of the ATR, and then looking at that in relation to its recent low to find a filtering factor to use on the choppiness index. This makes the choppiness index more reactive to trends, but also slightly more likely to missidentify ranges.
This is the bar color version of the indicator. It changes the color of the bars when it it thinks the market is ranging and when it thinks it is trending.
Yellow = Trending
Transparent gray = Ranging
ACTION Locator v2.0The indicator is based on making the standard deviation (where the mean is a moving average) a two-lines cross indicator, by applying an MA over it. When the standard deviation is above the MA, there is considered to be enough volatility in the market for trends to form.
Blue background = There is ACTION in the market -- signals it should be safe to trade
Gray background = No ACTION - DO NOT TRADE!
Support Resistance IV FinderUseful to find Support/Resistance levels in chop markets.
Developed on 15min BTCUSD chart
On different timeframes/trading pairs it must be used and tweaked with EMA Slope and Inverse Volatility for optimal results
Scroll back on the chart to load older lines
Phantom Trader -- BTC -- OnlyPhantom Trader is a "counter-trend" strategy built to take advantage of non-linear trading ranges and heavy chop zones.
Phantom Script is forward-thinking, and will project the next possible reversal zone (PRZ) well head of the move.
This script can be utilized for :
Hedging
Swing trading
Scalping
---------------------------------------------------------------------------------
Most reliable time frames are the 60-30-and 15
Green line indicates hidden support levels
Purple line Hidden resistance levels.
When price comes in contact with our PRZ "Potential Reversal Zone"
It is wise to take up a hedge position.
BITMEX:XBTUSD"
BITMEX:XBT
BITSTAMP:BTCUSD
BITSTAMP:BTCEUR
COINBASE:BTCUSD
COINBASE:BTCUSDC
COINBASE:BTCEUR
COINBASE:BTCGB
BITFINEX:BTCUSD
BITFINEX:BTCEUR
BITFINEX:BTCGBP
BINANCE:BTCUSD
BINANCE:BTCUSDC
BINANCE:BTCUSDT
BINANCE:BTCUSDC
BYBIT:BTCUSD
GEMINI:BTCUSD
KRKN:XBTUSD
----------------Impulse Rejection----------------------
Bullish Impulse
WEAK SELL SIGNAL: If Price is closing above Purple Phantom PRZ during bullish impulse, then likely a bullish impulse continuation is to take place.
STRONG SELL SIGNAL: If Price is failing to close above Purple Phantom PRZ Line after a bullish impulse, then look to hedge the short, or to take up a short position.
Bearish Impulse:
WEAK BUY SIGNAL: If Price is closing below Green Phantom PRZ line, after a bearish impulse, then maintain short position.
STRONG BUY SIGNAL: Once Price starts closing above Green Phantom PRZ line, look to hedge a long against a short, take profit the short, or net long the asset.
-------------------------------------------------------------------
Signal Invalidation
Close and continuation above Purple PRZ would invalidate short signal
Close and continuation below Green PRZ would invalidate the long signal
If the same above PRZ is rung once again, then that was likely a stop hunt.
Another close above, and signal should be retaken.
-----------------------------------------------------------------------
Midline Signals
Rejection at Midlines, during a bullish impulse, is bearish:
-Entering a short position or profit-taking current long is advised.
-A net-long trader not wanting to profit take their long can hedge an equal-sized short there.
Rejection at Midlines, during a bearish impulse, could signal trend change:
-A net-short trader should hedge a long position against their short.
-A net-long trader can add to their long on the second or third bounce
Continued rejection at midline, one should take up a net position in the direction of which the chart is rejecting.
-----------------------------------------------------------------------
For Test Access Please use the following GOOGLE form:
forms.gle
For monthly licensing:
https://coin-observatory.chargifypay.com...
$75/month licensing fee
To obtain a lifetime license
And
For SCRIPT SUPPORT please join our discord:
discord.gg
For ALL ASSET Classes

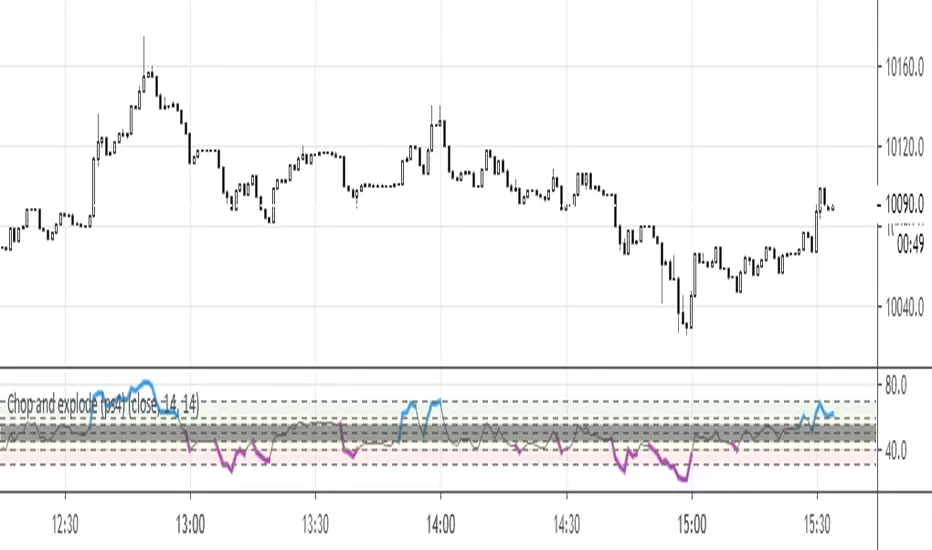
Chop and explode (ps4) UPD for XBTUSD, etc.This is an update that resolves rendering problems with XBTUSD.

Chop and explode (ps4)The purpose of this script is to decipher chop zones from runs/movement/explosion. See description in the code.
Added scaler to remove indicator rendering problems.

The All Seeing EyeThe All Seeing Eye is the Logarithmic Ultimate Oscillator (marked blue) interposed with a special Choppiness Index I call the "Trend Energy Index" (marked red) that has been averaged over multiple time frames. Key levels are set at the 50 center line, and then 1 and 2 standard deviations from the center line. This oscillator is intended for use in the standard stock market but can very likely be applied to the Forex market as well.
The 50 center line indicates the beginning or end of a trend based on the direction of the cross of the Ultimate Oscillator . Trend Strength is indicated by the position of the Trend Energy Index. Use this oscillator in the same way you would use the Ultimate Oscillator while considering the strength of the trend via the multiple Trend Energy Index. Entry and exit points are identified when the Trend Energy Index is in a trending state or spikes sharply downwards from an energy level near 61.8 and higher than 50. When the Trend Energy Index crosses above the 50 center line, it indicates the trend has ended. When it crosses below the 50 center line, it indicates a trend is beginning. Sharp changes in the direction of the Trend Energy Index at the 1 and 2 standard deviation key levels are usually accompanied by the same reaction from the Ultimate Oscillator indicating the trend may be entering a pullback or consolidation period. The Ultimate Oscillator will tell you the likely direction of the trend based on its slope between time intervals, as well as its position being above or below 50. Again, use the Ultimate Oscillator as you would RSI . Overbought and Oversold levels are indicated at the 2 standard deviation levels from the center line in relation to the Ultimate Oscillator . These levels are 27.2 for oversold and 72.8 for overbought.
The power of this oscillator comes from the reactivity of the Trend Energy Index in alerting you of trend strengthening or weakening of the predominant trend indicated by the Ultimate Oscillator . Pairing these two together produces great accuracy in Identifying reversals, exit points, and entry points. Additionally, the Ultimate Oscillator gives much less false divergence readings than standard RSI , and pairing with the ability of the Trend Energy Index to identify trend strength on any time frame allows great versatility while maintaining accuracy.
Because of the nature of this oscillators design, it is suited for use under any time frame and any volatility level. However, I personally have found it to be most accurate under low to medium-high volatility levels in a weekly time frame or shorter. Accuracy begins to be lost once the time frames are monthly or higher. It is recommended to use this oscillator with a volume indicator and a secondary momentum indicator such as MACD to verify signals from the All Seeing Eye for the highest degree of accuracy to be achieved.
Easy to read and notable trend states to get you started:
Blue line above 50 and red line below 50 = Uptrend
Both blue line and red line below 50 = Downtrend
Blue line 2 standard deviations above 50 and red line 2 standard deviations below 50 = Strong uptrend
Both blue line and red line 2 standard deviations below 50 = Strong downtrend
Red line at 1 standard deviation below 50 = weak trend
Red line at 2 standard deviations below 50 = strong trend
Red line at 1 standard deviation above 50 = consolidation phase (very weak or no trend)
Red line at 2 standard deviations above 50 = dead in the water (no trend at all)
My #1 tip: Pay close attention to the slopes of both lines in this oscillator and their relationship to each other!
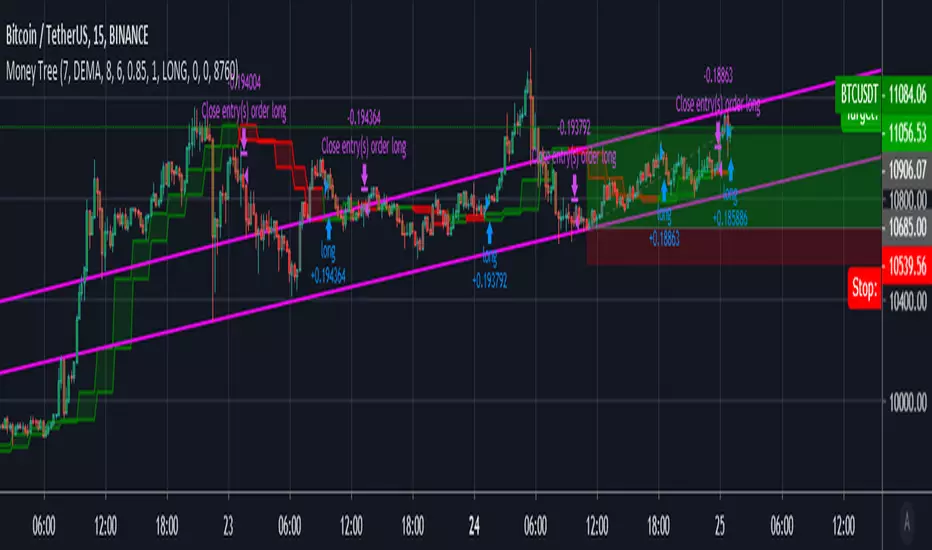
Money TreeDisclaimer Use at your own risk, this is not financial advice!
Based on:
OCC v5.1 by JustUncleL and the Tradeview built in Chop Zone indicator
Merging both the OCC and chopzone allows to filter out some unprofitable trades during choppy times.
You can filter out the zones using the checkboxes in the settings.
Works well on 15min and 30min candles