VW EMA CCI + TTM Volume Weighted EMA CCI + TTM squeeze in one indicator
Credit goes to SpreadEagle 71 for the CCI and Greeny for the TTM
Chỉ số Kênh hàng hóa (CCI)

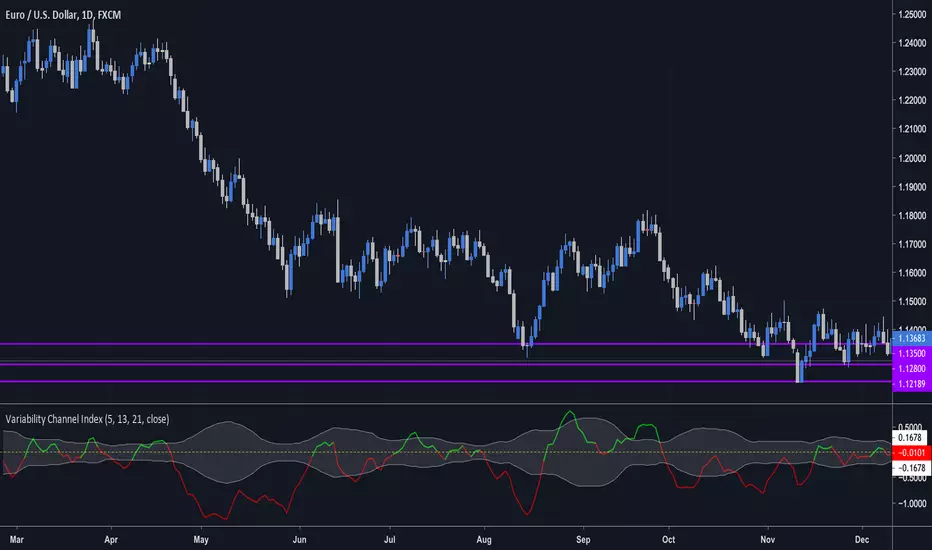
Variability Channel Index (by vitelot)This is a momentum, trend, as well as a divergence indicator.
It is similar to CCI, though it is based on a slow and fast EMA in connection to ATR, which
allows to interprete it easily.
Both EMAs and ATR have customisable period.
Further explanation and basic usage can be found in the comment section inside the script.
CCI AnalysesThis script analyses the CCI indicator values, showing when a fall in price or a rise in price may happen, or when the CCI is confirming the trend.
The user can personalize:
The period to be used and the range of the CCI bands ( by default)
The slow SMA period to be used and the price percentage variation to react for bullish/bearish
Consecutive number of bullish/bearish in order to consider the CCI as a trend confirmation rather than a price reversal

MultiCCIBased on Pinks Multi RSI Script, , I've adapted it to fit CCI. This offers an at a glance look at overbought and oversold CCI levels.
You can adjust the length as well as the overbought and oversold levels (default overbought and oversold levels are 100 and -100). As with Pinks' indicator, it is recommended that you use it on the log scale.
Timeframes provided are: 15m, 30m, 45m, 1h, 2h, 3h, 4h, 5h, 6h, 12h, 18h, 1D.

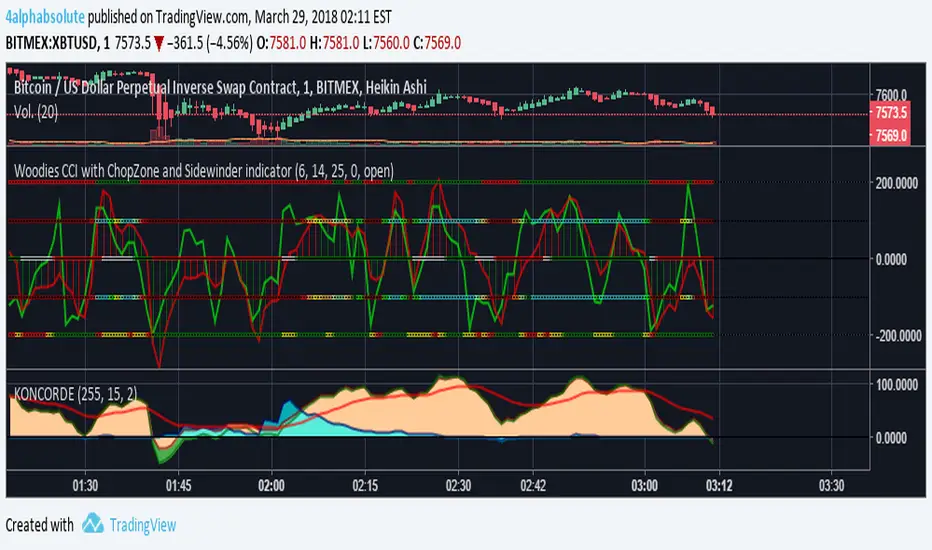
Woodies CCI with ChopZone and Sidewinder indicatorExcelente indicador a mi parecer, bastante complejo pero muy bien acoplado; dejo aquí las fuentes para aprender a utilizarlo:
www.x-trader.net
www.x-trader.net www.x-trader.net www.x-trader.net
RSI + Stoch RSI + CCI [PrimeTrading]RSI + Stoch RSI + CCI alerts overlay (3 in one)
Blue alert = CCI crossover bullish
Red Alert = CCI crossover Bearish
-----
How to use it?
You can compare the alerts with RSI and Stoch RSI conditions to see if its reliable, check my vertical lines on the chart
Feel free to contact me anytime, good luck!
PrimeTrading

CCI_three_timeframesThis script shows three CCIs in one frame, three different frames (20,140,3360) on the same chart.
Purely for for visual purposes values multiplied with e.
CCI is using simple moving average and mean deviation, a basic versatile momentum oscillator-indicator.
Useful for 2h charts.

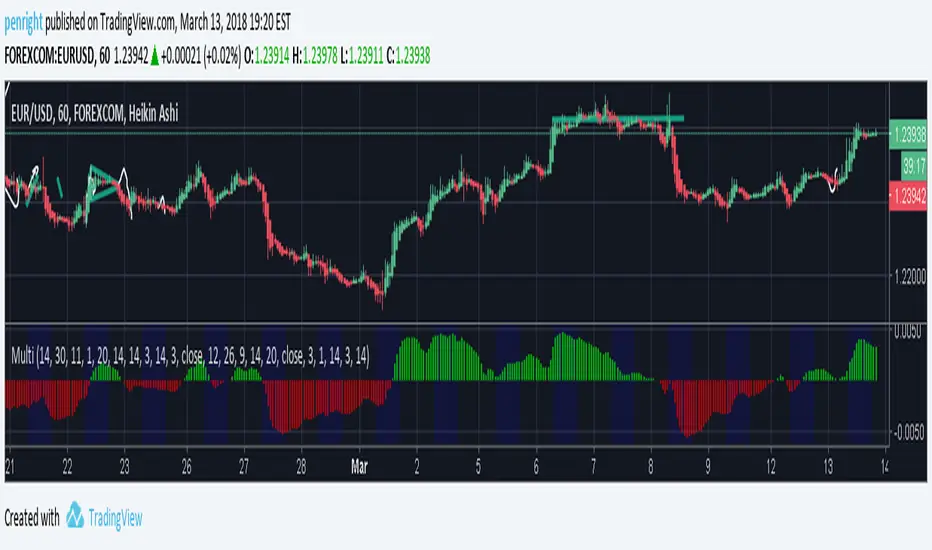
A Multi 10 indicatorREAD NOTE BEFORE APPLYING or you may think indicator doesnt work.
This indicator is a revise of another i made and contains 10 Optional Indicators allowing you to load more then 3 indicators at once if you so choose and dont pay for the platform!
Hopefully someone will find use for this script besides me :) I dont suggest turning all on at once because it
will not look right. Alot will overlap if you wish but i only use the Session and trend bar at once in
conjuction with a Oscillator setting like MacD , RSI , Stoch , Aroon or CCI .
In the chart you see i only have a few indicators active ENJOY!!
---------- NOTE ----------- ( Everything is OFF by default and indicator SHOULD show up BLANK when loaded) ------------ NOTE -------------
(Can turn EVERYTHING on AND change any values in the format tab once indicator loads)
Indicators included are listed below
Sessions, including, NY session, Aussie session, Asian session, and Europe market sessions.
MacD Split Colored , aroon oscillator
CCI Oscillator , classic aroon
RSI Oscillator , Elliot wave
Stoch RSI Oscillator , ATR%
My own Trend bar
---------- NOTE ----------- ( Everything is OFF by default and indicator SHOULD show up BLANK when loaded) ------------ NOTE -------------
(Can turn EVERYTHING on AND change any values in the format tab once indicator loads) CODE probably looks messey but this is something i made for me so i didnt really care lol
Commodity Channel Index + 2 EMAsThis cript is from CCI chart with 2 aditional Exponential Mean Average from CCI. The default setup works better on H1 graph.
The EMAs are from CCI.

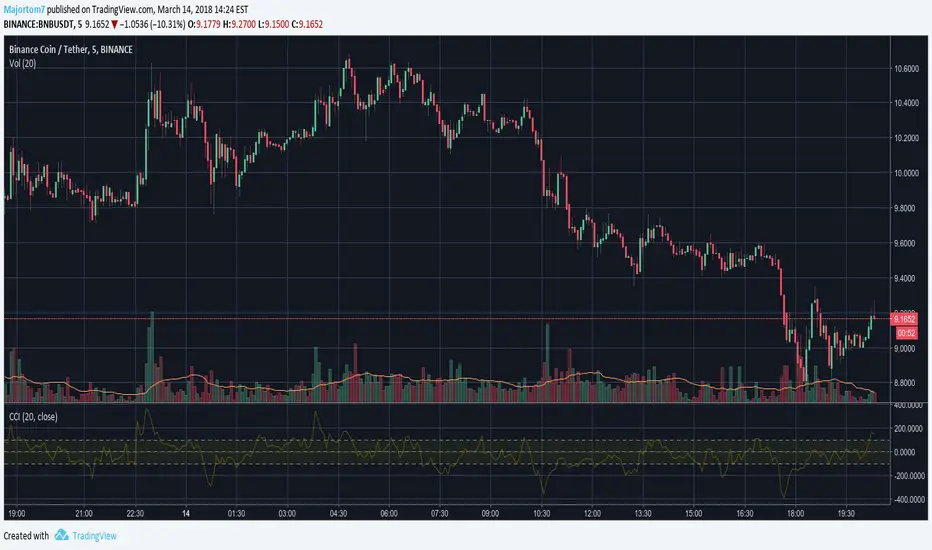
Color Coded Commodity Channel IndexThis is a simple CCI that has the levels needed marked and color coded based on the place it sits on the zones. The CCI is one of the best tools you can use to identify which side of the market is in control at the moment.

SB_CCI coded OBV StrategyStrategy-
Buy Order: Previous obv value is green and obv_cci coded line crosses over ema line
Sell Order: Previous obv value is red and obv_cci coded line crosses under ema line.
Original Idea:
Preferable for day/week intervals.
For Tips to continue :) -
BTC: 1BjswGcRR6c23pka7qh5t5k56j46cuyyy2
ETH: 0x64fed71c9d6c931639c7ba4671aeb6b05e6b3781
LTC: LKT2ykQ8QSzzfTDB6Tnsf12xwYPjgq95h4

CCI Moonhopping [Draft v1]CCI-based Moonhopping Script
When can this indicator be used?
1. There must be a 1D CCI upward trend
2. There must be a 1D downward trend (divergence)
3. There must be a 4H CCI upward trend
4. There must be a 4H downward trend (divergence)
5. The indcators are only valid for the duration of a 4H CCI upwards trend.
What do I want this Script to do?
1. Provide a Start Signal on a 4H chart (Orange)
2. Provide Accumulation Signals on a 4H chart (Blue)
3. Provide a potential Moon Signal on a 4H chart (Lime)
4. Provide a potential Sell Signal on a 2H/4H chart (Red)
N.B.
Sharper 4H Trends reduce potential of the uptrend being swept sideways (resulting in a slower ROI).

FX Sniper: T3-CCI Strategy - With 100 IndicatorsEntry signal when moving above -100, sell signal when going below 100


Seve AltCoin CCI / EMA IndicatorCustom CCI and EMA alert script developed as a service. Published for verification and acceptance.
CCI / EMA Indicator
Full inputs for all Indicators
Inputs to control plotting
Flag CCI Crossing a threshold with price closing above EMA1 and EMA1 > EMA2
Flag CCI Crossing a threshold with price closing
CCI Crossing a upper / lower boundaries and price closing above EMA
Opposite markers for shorts

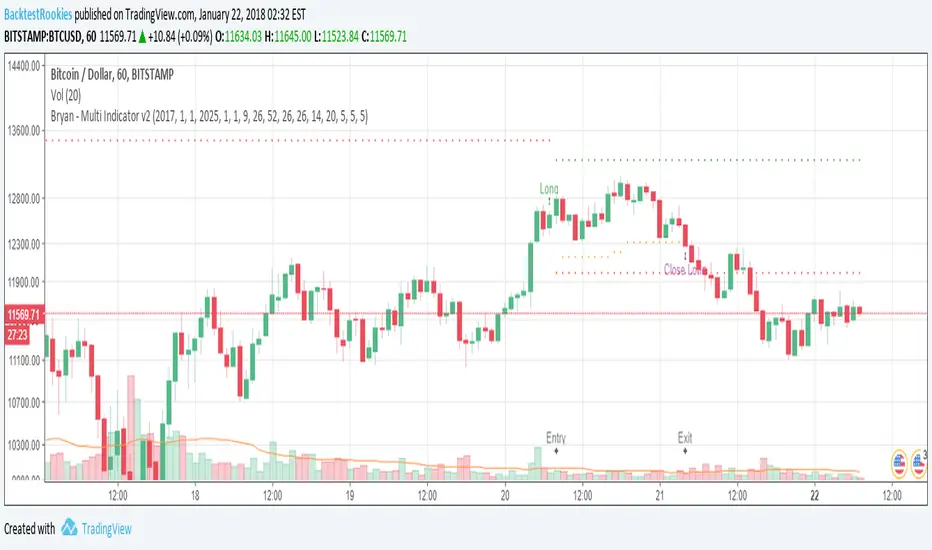
Bryan - Multi Indicator v2Developed as a professional service and published for customer acceptance/verification.
Notes
Ichimoku and ADX combined strategy.
Strategy logic ported to the indicator to allow automation through 3rd party services. (Position management, orders etc)
Long and exit long alert conditions created
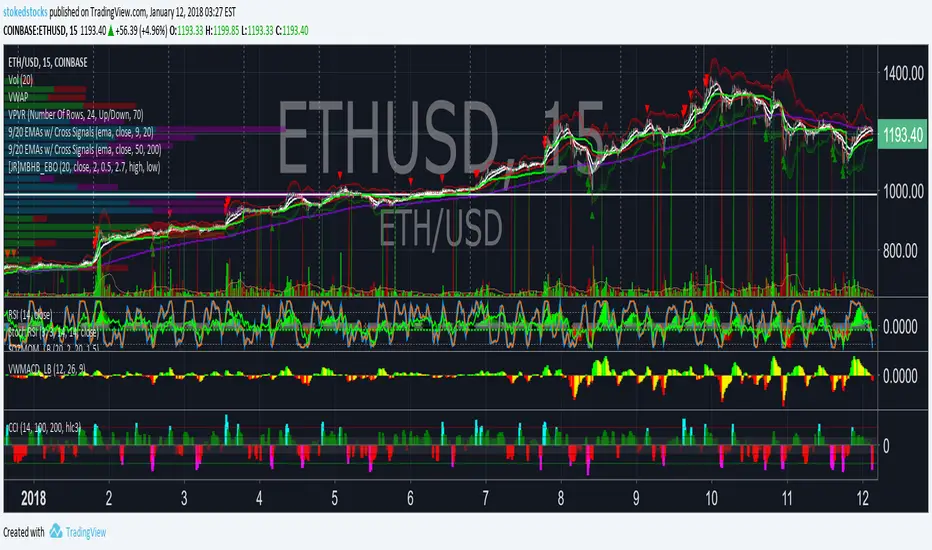
CCI Histogram w/ Color STOKEDSTOCKSCCI Histogram w/ Color Has EMA option to calculate CCI STOKEDSTOCKS
Finds oversold and Overbought conditions
Seve AltCoin Alerts v2Republished due to Tradingview issue. Updates not appearing for users on managed access list.

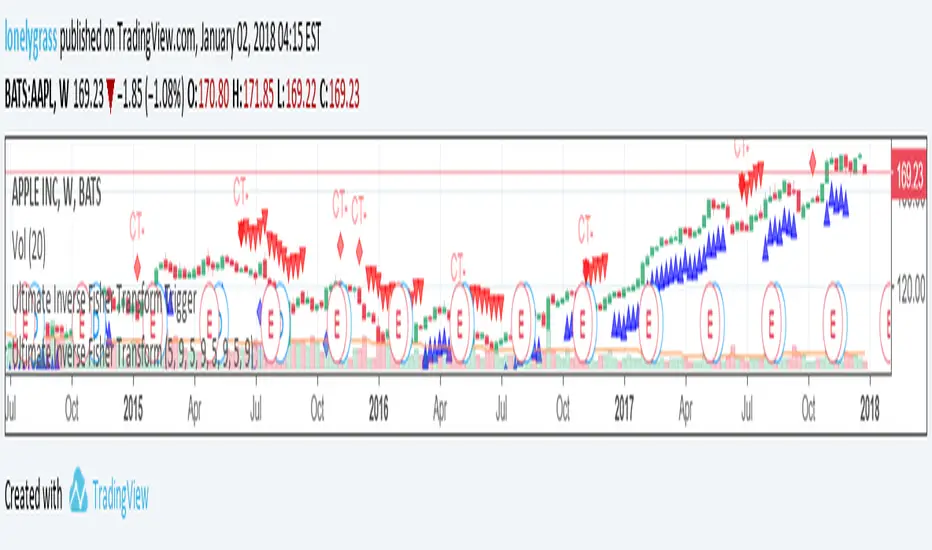
Ultimate Inverse Fisher TransformRecap :::
This is called "Ultimate Inverse Fisher Transform Trigger" , which integrates inverse fisher rsi , cci , stochastic and mfi to trigger trade signals.
This Inverse Fisher Transform TA is refined for purpose of getting signals more frequently than the normal inverse fisher indicators do, but also sacrifice a bit accuracy. This should also be used along with my "Ultimate Inverse Fisher Transform" , to get an idea of whenever to initiate trades and occasions to hold onto positions.
Guide:
IFISH values above 0.5 are considered to be overbought and therefore offer an opportunity to sell. IFISH values below -0.5 are considered oversold and present an opportunity to buy. If the IFISH peaks above the top guide a sell signal will be generated. Conversely, if the IFISH troughs below the bottom guide a buy signal will be given. The 0 line divides the bulls above from the bears below.
Add this to your favorite and use along with the "Ultimate Inverse Fisher Transform Trigger" . Thanks for support.
Ultimate Inverse Fisher Transform TriggerThis is called "Ultimate Inverse Fisher Transform Trigger" , which integrates inverse fisher rsi, cci, stochastic and mfi to trigger trade signals.
This Inverse Fisher Transform TA is refined for purpose of getting signals more frequently than the normal inverse fisher indicators do, but also sacrifice a bit accuracy. This should also be used along with my "Ultimate Inverse Fisher Transform" , to get an idea of whenever to initiate trades and occasions to hold onto positions.
Guide:
IFISH values above 0.5 are considered to be overbought and therefore offer an opportunity to sell. IFISH values below -0.5 are considered oversold and present an opportunity to buy. If the IFISH peaks above the top guide a sell signal will be generated. Conversely, if the IFISH troughs below the bottom guide a buy signal will be given. The 0 line divides the bulls above from the bears below.
Hope you would enjoy it and have a fabulous start of the year.
Lonelygrass

Seve's AltCoin AlertsAlt Coin Alerts Script
Script to track specific CCI and EMA setups for a list of up to 5 user selectable altcoins (or any other instrument).
Published for customer verification.

Inverse Fisher Transform on CCIAbout John EHLERS:
From California, USA, John is a veteran trader. With 35 years trading experience he has seen it all. John has an engineering background that led to his technical approach to trading ignoring fundamental analysis (with one important exception).
John strongly believes in cycles. He’d rather exit a trade when the cycle ends or a new one starts. He uses the MESA principle to make predictions about cycles in the market and trades one hundred percent automatically.
In the show John reveals:
• What is more appropriate than trading individual stocks
• The one thing he relies upon in his approach to the market
• The detail surrounding his unique trading style
• What important thing underpins the market and gives every trader an edge
About INVERSE FISHER TRANSFORM:
The purpose of technical indicators is to help with your timing decisions to buy or
sell. Hopefully, the signals are clear and unequivocal. However, more often than
not your decision to pull the trigger is accompanied by crossing your fingers.
Even if you have placed only a few trades you know the drill.
In this article I will show you a way to make your oscillator-type indicators make
clear black-or-white indication of the time to buy or sell. I will do this by using the
Inverse Fisher Transform to alter the Probability Distribution Function (PDF) of
your indicators. In the past12 I have noted that the PDF of price and indicators do
not have a Gaussian, or Normal, probability distribution. A Gaussian PDF is the
familiar bell-shaped curve where the long “tails” mean that wide deviations from
the mean occur with relatively low probability. The Fisher Transform can be
applied to almost any normalized data set to make the resulting PDF nearly
Gaussian, with the result that the turning points are sharply peaked and easy to
identify. The Fisher Transform is defined by the equation
1)
Whereas the Fisher Transform is expansive, the Inverse Fisher Transform is
compressive. The Inverse Fisher Transform is found by solving equation 1 for x
in terms of y. The Inverse Fisher Transform is:
2)
The transfer response of the Inverse Fisher Transform is shown in Figure 1. If
the input falls between –0.5 and +0.5, the output is nearly the same as the input.
For larger absolute values (say, larger than 2), the output is compressed to be no
larger than unity. The result of using the Inverse Fisher Transform is that the
output has a very high probability of being either +1 or –1. This bipolar
probability distribution makes the Inverse Fisher Transform ideal for generating
an indicator that provides clear buy and sell signals.
