SnR Double Breakout Level Detector by RWBTradeLabSnR Double Breakout Level Detector by RWBTradeLab
A clean, non-repainting breakout-confirmation indicator designed for price action traders who want high-confidence Support/Resistance breakouts, based on double structure logic and confirmed candle closes only.
What this indicator does
This script automatically detects Double Breakout key levels using CLOSED candles only (no running-candle logic, no repainting).
1. Base Structure Levels (internal logic)
The indicator internally identifies two structural levels before confirming a breakout:
* A Level (Resistance structure)
Green → Red
Level = 1st Green candle Close
* V Level (Support structure)
Red → Green
Level = 1st Red candle Close
These base levels are used to build Double Breakout conditions.
2. Double Breakout Confirmation Levels
Only when two valid structures form first, and then price breaks correctly, a breakout is confirmed.
* Double A Breakout (DBO A)
- Two A Levels form, where the 2nd A Level is lower than the 1st
- After that, no new A Level forms
- A candle CLOSES above the 1st A Level
- Result:
→ A confirmed Double A Breakout Level is drawn at the 2nd A Level
* Double V Breakout (DBO V)
- Two V Levels form, where the 2nd V Level is higher than the 1st
- After that, no new V Level forms
- A candle CLOSES below the 1st V Level
- Result:
→ A confirmed Double V Breakout Level is drawn at the 2nd V Level
This logic filters weak breakouts and focuses only on structure-validated breakouts.
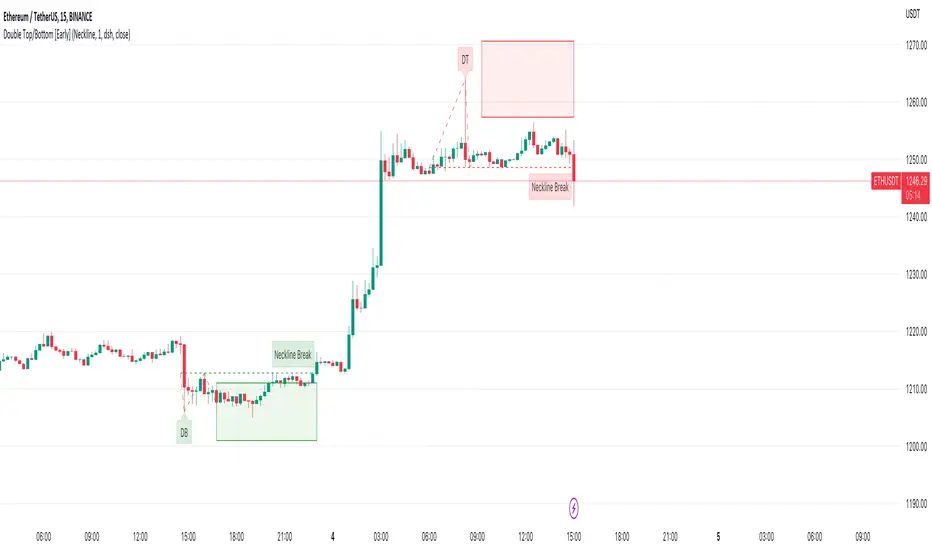
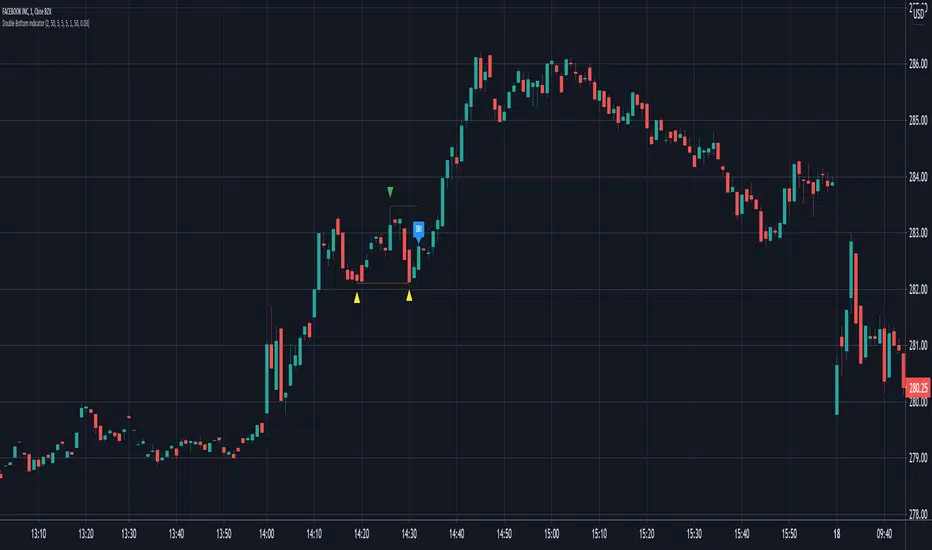
Visuals on chart
* Each confirmed Double Breakout level is drawn as a horizontal Ray extended to the right.
* Text labels:
- DBO A → shown above the level, Green background with White text
- DBO V → shown below the level, Red background with White text
* Adjustable Label Offset (ticks) to keep the chart clean.
* Only recent market levels are displayed based on the selected Candle Length.
Alerts (bar-close only)
Built-in alerts trigger only on confirmed candles:
* Double A Breakout
* Double V Breakout
Each alert includes symbol, price, and time — no repainting, no early signals.
Key settings
* Candle Length (closed candles)
Scans the last N confirmed candles only (running candle excluded).
* On/Off toggles
Enable or disable:
- Double A Breakout
- Double V Breakout
- Text Labels
* Label Offset (ticks)
Controls the vertical distance between the level line and text.
Non-repainting confirmation
All calculations and alerts are based strictly on confirmed bar closes.
No repainting. No intrabar repaint tricks.
What you see on the chart is fixed and reliable.
Best use
Works on any market and timeframe.
For best results, combine with:
* Higher timeframe structure
* Supply & Demand zones
* Liquidity sweeps
* Trend context and session highs/lows
Disclaimer
This indicator is a technical level-detection tool, not financial advice.
Trading involves risk. Always use proper risk management and confirm signals with your own analysis.
Creator: RWBTradeLab
If you find this indicator useful, please leave a like ⭐ and share your feedback.
Chỉ báo Pine Script®