Ichimoku EMA RSI - Crypto only long StrategyHey there!
Here I show you an Ichimoku Cloud Strategy.
I discovered the strategy on a YouTube channel and tried to transfer it as a strategy into a script.
He said in his video that you would make more profit with this strategy than holding the coin.
Tested with the crypto pair ETH/USDT in the four hour chart.
Period: beginning of 2017 until today.
The strategy should also work with foreign exchange. But then the settings have to be adjusted.
There is the possibility to activate two EMA's and a Stochastic RSI .
-----------------------------------------------------------------------------------
How does the strategy work?
ENTRY
The green Ichimoku lead line must above the red Ichimoku lead line - only the two lead lines are activated.
A green candle must closed above the green lead line.
EXIT
A red candle must close below the green Ichimoku lead line.
OPTIONAL ENTRY
EMA
Once you activate the EMA , long positions will only be taken once the EMA1 is above the EMA2.
Thereby I could observe a significant increase of the profit as well as a decrease of the maximum drawdown.
RSI
As soon as you activate the Stochastic RSI , long positions are only taken when the K line is above the D line.
In the future, I may add an oversold - undersold parameter.
The results of the strategy are without commissions and levers.
If you have any questions or feedback, please let me know in the comments.
If you need more information about the strategy and want to know exactly how to apply it, check out my profile.
I wish you good luck with the strategy!
Đường Trung bình trượt Hàm mũ (EMA)

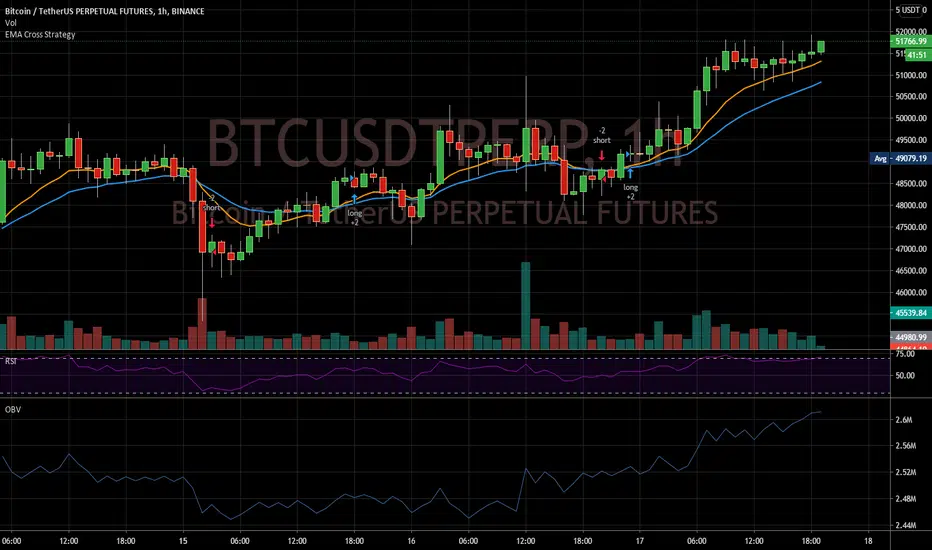
EMA+RSI Pump & Drop Swing Sniper (SL+TP) - StrategyThis is the strategy version of the 'EMA-RSI-Pump-Drop-Swing-Sniper-With-Alerts':
Some additions with this strategy:
~Added Stop loss & Take profit control. In Settings > Inputs if the Stop Loss is at .051 that means it's 5.1% and the Take Profit at .096 is 9.6%. If you wish to remove the TP and SL just change the value to 1.00 and it would be the same as it being 100% TP and SL which is likely to never be hit.
~Added Backtesting by changing the month/date/year in Settings > Inputs
~Added a 2nd EMA line to assist with the long entry signals. I only use this for long entry & exits, though you could use the long exits as Short entries too. I just personally don't do short trading on Bitcoin.
This is using an EMA and RSI with slightly modified settings to give good entry and exit points while looking at Bitcoin. I use this on a 1-hour and 4-hour chart and with other indicators to find good positions to enter a trade or exit if things are turning red.
It's important to know this strategy was made as a request by another user that was using the indicator version. I don't use this as a trading strategy by itself, I use the visuals it gives as a confirmation with other indicators to find the best possible entry and exit positions.
If you click on the EMA line it will color the bars of the chart based on if they are above or below the EMA - This is just visually helpful for me to see the active trend.
Make sure you hover over or click on the EMA line to see the colors of the candles change - it's not visible by default or without doing this.

Tripple super Trend + EMA + RSI StrategyGreetings!
Here I show you the Tripple Super Trend Strategy.
I discovered the strategy on a YouTube channel and tried to transfer it as a strategy into a script.
Tested with the currency pair EUR/USD in the one hour chart.
Period: beginning of 2020 until today.
The strategy should also work with cryptocurrencies. But then the settings have to be adjusted.
There is the possibility to activate only long or only short position.
The EMA can be used in a time different from the chart.
-----------------------------------------------------------------------------------
How does the strategy work?
For long positions, the candle must be above the EMA .
The candle must be closed above at least two of the supertrend lines.
The stochastic RSI must show oversold and the k line must cross over the D line.
For short positions, the candle must be below the EMA .
The candle must be closed below at least two of the supertrend lines.
The stochastic RSI must indicate overbought and the K line must cross below the D line.
The stop loss is determined with the "lowest low/highest high lookback".
The profit factor is multiplied by the value of the lowest low/highest high lookback.
The results of the strategy are without commissions and levers.
If you have any questions or feedback, please let me know in the comments.
In the future I will add other types of stop loss / take profits. (ATR; %; eg.)
If you need more information about the strategy and want to know exactly how to apply it, check out my profile.
I wish you good luck with the strategy!

[EURUSD60] BB Expansion StrategyOverview
This is a strategy that can be used in the EURUSD 60 time frame.
It is a trend-following method that uses Bollinger Bands Expansions.
The idea of using Bollinger Bands expansion is well known to the general public, but I don’t know any strategy that this idea has been PINE coded.
The three main components of this strategy are as follows.
・Long term BB and Short term BB : When the short term BB expands more than the long term BB, it suggests the occurrence of a trend.
・14EMA of 240 t/f : The direction of 14EMA of the upper time frame is used as the trend direction.
・ATR lines : As a stop-loss line and a take-profit line.
Description
Fig. Long entry pattern
Fig. Short entry pattern
・Description of lines
Gray : Large BB (=Long term BB)
White : Small BB (=Short term BB)
Blue or Red line : Upper t/f EMA(default: 14EMA), blue is up-trend, red is down-trend
Yellow : Stop loss line by ATR(the term is 14)
Purple : Take profit line by ATR(the term is 14)
・Description of strategy
First of all, when the small BB expands more than the large BB, this strategy detects the occurrence of a trend.
Second, When the price crosses over or crosses under small BB basis, this strategy entries long or short to trend direction (by upper time frame 14EMA).
The default stop-loss range is three times ATR value, and the default take-profit target is 1.5 times the stop-loss range (=risk reward ratio is 1.5).

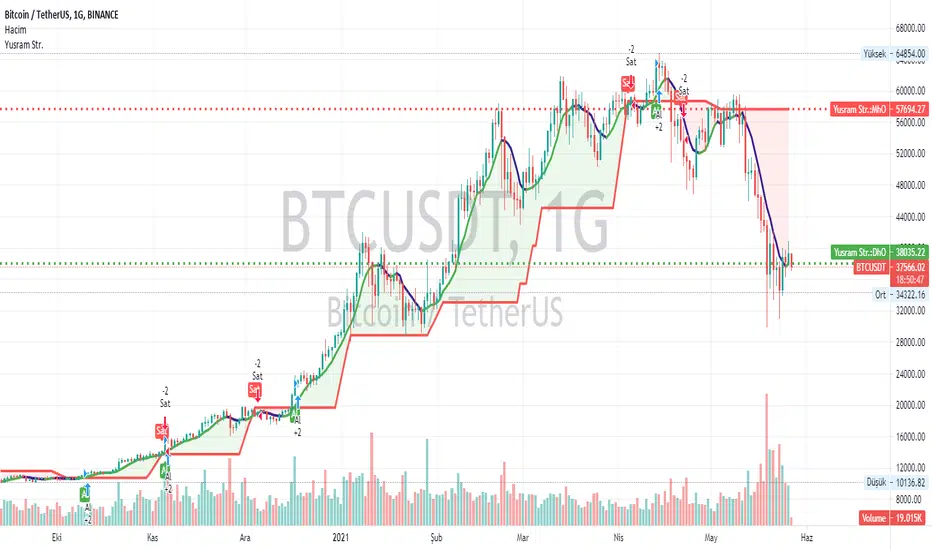
Yusram Mount MaV - Day MaV CrossOver Strgty
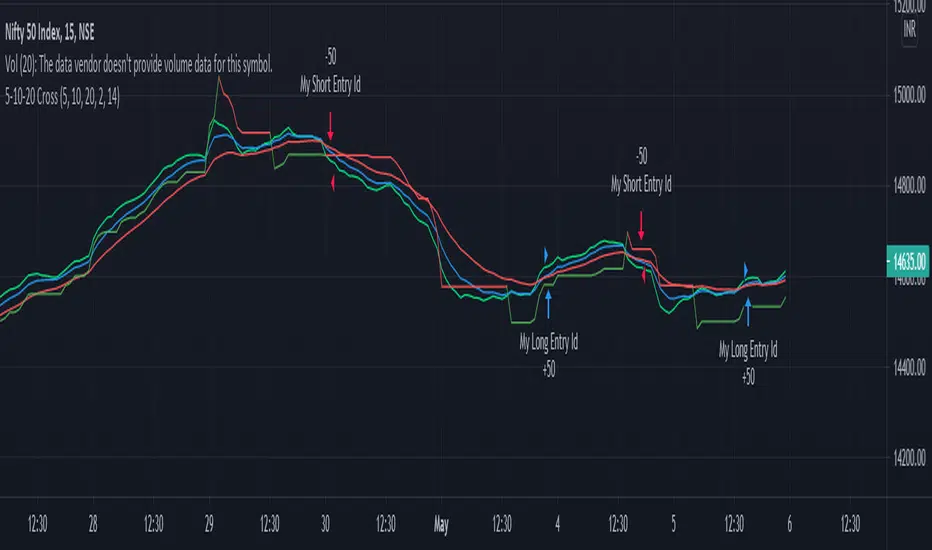
This indicator shows the comparison between the 7-day fast simple average and the monthly slow average of 5 bars. The red line indicates the monthly green and blue lines the daily average. If the Green-Blue line crosses the red upwards, it is a buy signal and the opposite is a sell signal. As soon as it turns green blue without waiting for the sell signal, a sell signal is created. If you are trading fast, you can consider turning green to blue as an opportunity. In the long run, the red intersection can be interpreted as a Stop point.
I hope it will be useful to everyone.
You can also find the strategy indicator with the same name.
I got the name of this indicator from my daughter's name. The meaning of the name Yüsra means "convenience". I hope this indicator will help you.Yüsram Mount HO - Day HO
Fibonacci EMA averages (21, 34, 55, 89, 144)Just a simple script that plots the following EMA averages that are based on the fibonacci sequence: 21, 34, 55, 89, 144

Crypto momentum strategyThis strategy is based on LazyBear's Squeeze Momentum indicator. It analyzes when the trend in the momentum is shifting, locating the peaks and the valleys, and takes those as sell and buy signals respectively. This is a long strategy, so it also takes into consideration the 50 period Exponential Moving Average to identify upward trends. If the closing price of the candle is above the 50EMA, and the slope of the 50EMA is trending upwards, then the buy signal is executed. If these conditions are not met, the buy signal is ignored.
This strategy works well with crypto trading on the day/week charts.
It has a profit ratio of 4:1 on average, and roughly half of the trades are profitable.

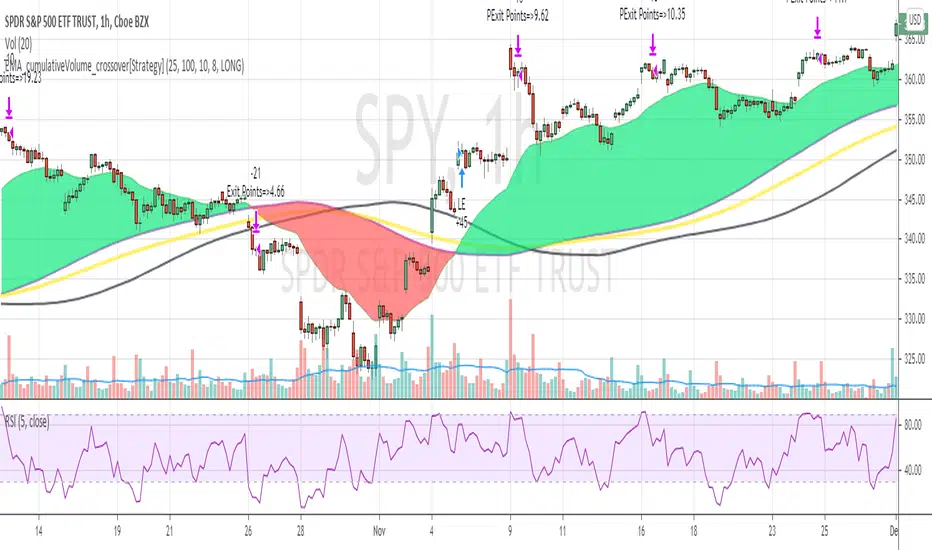
EMA_cumulativeVolume_crossover[Strategy V2]This is variation of EMA_cumulativeVolume_crossover strategy.
instead of cumulative volume crossover, I have added the EMA to cumulative volume of same EMA length.
when EMA crossover EMACumulativeVolume , BUY
when already in LONG position and price crossing over EMACumulativeVolume*2 (orange line in the chart) , Add more
Partial Exit , when RSI 5 crossdown 90
Close All when EMA cross down EMACumulativeVolume
Note
Black Line on the chart is the historical value of EMACumulativeVolume . when EMA area is green and price touch this line closes above it , you can consider consider BUY
I have tested it on SPY , QQQ and UDOW on hourly chart.
EMA setting 25 is working for all of these.
but SPY produces better results on EMA 35 setting
warning
This strategy is published educational purposes only.
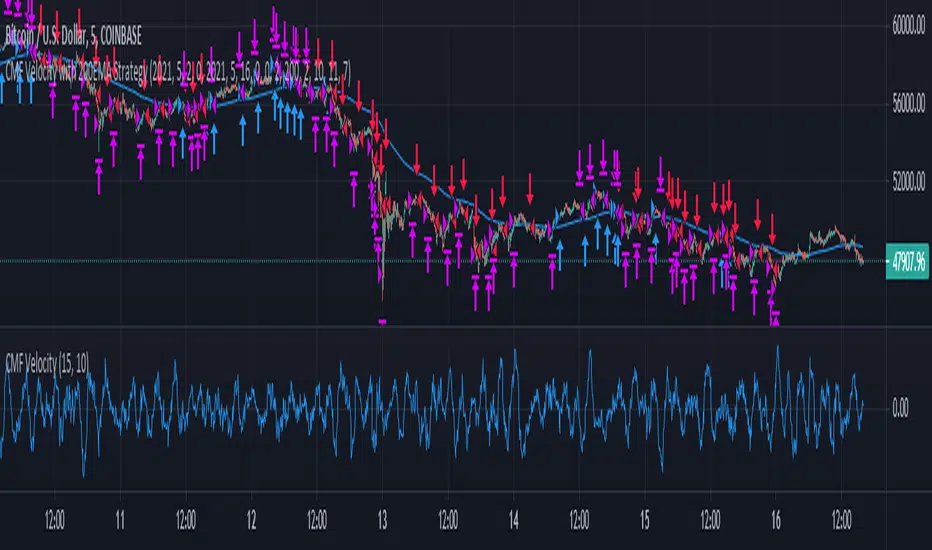
CMF Velocity with 200EMA StrategyThis is a demonstration of my new Indicator - CMF Velocity - in a profitable trading strategy. It is able to take shorts when the close is less than the 200 EMA, and longs when the close is greater than the 200 EMA.
3 EMA Stochastik RSI ATR SL TP only LONGHey there!
Here i will show you the 3 EMA RSI Stochastic Crossover strategy with an ATR SL and TP.
The strategy works as follows:
For long positions, the EMA's must be in the following order:
The 8 E M A must be above the 14 E M A and the 14 E M A must be above the 50 E M A.
The buy signal is given to us by the Stochastic RSI indicators.
The K line must cross the D line above. The following candle must then close above all E M A's.
The stop loss is determined by three times the value of the ATR.
The take profit is determined by two times the value of the ATR.
In this strategy only long positions are traded.

3x SuperTrend Strategy (Mel0nTek) V1This is a triple SuperTrend based strategy for lower time frame trades such as day trades and scalping. I have not seen many strategies that combine multiple SuperTrends so I thought I would publish this one since I put it together and have been quite happy with the results. I have found through testing that the best results are on currency exchange markets such as Crypto or Forex on 1-15 min time frames.
The core idea was inspired by a youtube video put out by Trade Pro:
"Trade Pro - HIGHEST PROFIT Triple Supertrend Trading Strategy Proven 100 Trade Results"
I went ahead and set the defaults to the ones he uses in his video for anyone who wants to try a configuration similar to his. They work pretty well in general, however the EMA, SuperTrend ATR multipliers, and P/L ratio can be tuned/optimized to fit the timeframe/market desired. The video is quite good but not a required watch as I will explain below.
The 200EMA is used as a medium-term trend direction indicator.
- Price closing consistently above the 200EMA means that only long positions should be entered.
- Price closing consistently below 200EMA means that only short positions should be entered.
The 3 SuperTrend indicators should be used as direction confirmation for entries. Typically, price above SuperTrend indicates bullish movement, while price below SuperTrend indicates Bearish movement. However by itself, it is not a great indication to enter/exit positions in my experience. By combining 3 of them with slightly longer periods and increased ATR multipliers, we can get much stronger confirmation of trend direction/strength.
The way they are used in this strategy is such that:
- We only want to enter a position if at least 2 out of 3 SuperTrends are on our side.
- 3/3 SuperTrends on our side is the best case, since we are taking trades WITH momentum/price strength.
- The second farthest SuperTrend from entry price is used as a Stop Loss
SuperTrend being on our side is not the only requirement for an entry however. The probability of success is increased with SuperTrend, and a longer EMA on our side, but we want to be sure that we aren't getting in too late/after the movement has already happened.
So we use Stoch RSI to pick our entries where price is oversold/overbought and reversing. That means the Stoch RSI is above 80, or below 20, and our indication to enter the trade is when the 2 lines cross/begin reversing direction.
So with trend direction on our side, we can get really good entries at these oversold/overbought extremes, especially as it's reversing (Stoch RSI K and D are crossing). This allows us to use the SuperTrend as a support/stop loss on our entry since price should be above it.
Then we just target 1.5x our max loss so that even if we only win 50% of the time, we still make a profit.
The explicit rules of this strategy are as follows:
=== Rules ===
long only
- price above EMA200
short only
- price below EMA200
Stop Loss = 2nd SuperTrend line above (short) or below(long) entry candle
Profit = 1.5x SL/risk (Profit Ratio x Max Loss)
=== Entry Setup ===
LONG
- Stoch RSI below 20, cross up
- at least 2 SuperTrend lines below close
SHORT
- Stoch RSI above 80, cross down
- at least 2 SuperTrend lines above close
P.S. Special thanks to Trade Pro for producing so many quality videos, putting strategy claims to the test, and providing me with so many good ideas I apply to my own strategies.

CRYPTO 3EMA Strategy with Take Profit & Stop Loss based on ATRSimple 3 EMA Strategy with plotted Take Profit and Stop Loss
Entry condition:
- Middle EMA cross above the Slow EMA
- Set take profit and stop loss exit conditions based on ATR Indicator
Exit condition:
- Fast EMA cross below the Middle EMA

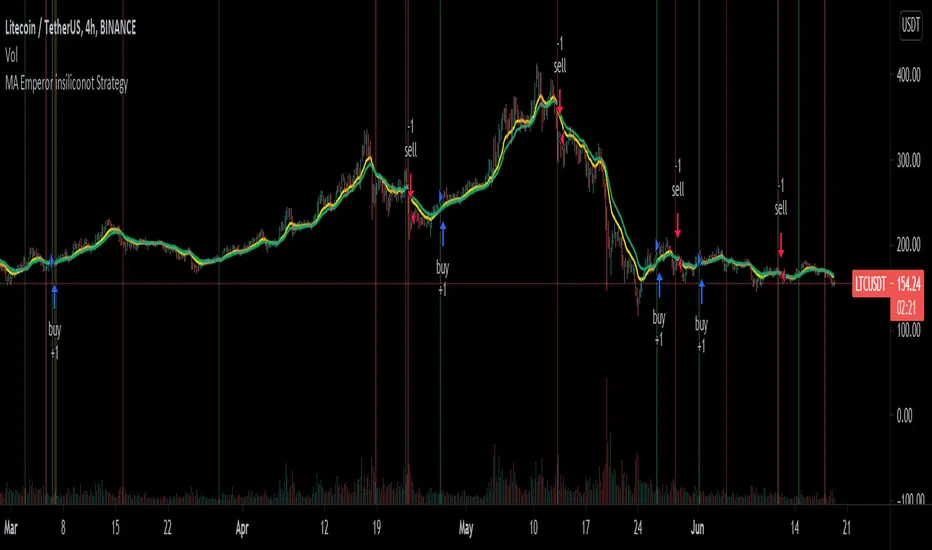
MA Emperor insiliconot StrategyConverted EmperorBTC's EMA crossover indicator for easy backtesting and added ability to:
Specify time period for backtesting
Specify order quantity
Toggle original indicators (default off)
Quoting EmperorBTC:
Entry is to be made when the
1. Cross over gives a P(Positive Sign) and the candle completely closes above the cross-over
2. When the Heikin Ashi turns green and the next green HA candle goes above the previous green HA candle.
3. The price should be at-least above the 0.236 Level from the Swing high.
Kindly note that the strategy only attempts to do check number 1, where it ensures the entry opens above the cross-over.
[laoowai]BNB_USDT_3m_3Commas_Bollinger_MACD_RSI_StrategyBNB_USDT _3m
Release Notes:
Time: 3min
Pair: BNB_USDT
Use: {{strategy.order.alert_message}}
What's the difference with 3Commas Bollinger Strategy by tedwardd:
1. Initial capital: 1210 USDT (10$ Base order / 400$*3 Safety order), if you will change, please change JUST safety order volume or number of safety orders 2-3
2. Using just 2(3) safety order (original script 4)
3. More high-performance strategy for BNB_USDT
4. Using MACD to sell order (original script take profit by scale), thanks Drun30 .
5. Using RSI to analyze the market conditions.
Need to change:
bot_id = input(title="3Commas Bot ID", defval=" YOUR DATA ")
email_token = input(title="Bot Email Token", defval=" YOUR DATA ")
---------------------------------------------------------------------------------------------------------------------------------------------------------------------------------------------------
FAQ copy from tedwardd
---------------------------------------------------------------------------------------------------------------------------------------------------------------------------------------------------
This strategy is intended for use as a way of backtesting various parameters available on 3commas.
The primary inputs for the strategy are:
---------------------------------------------------------------------------------------------------------------------------------------------------------------------------------------------------
// USER INPUTS
Short MA Window - The length of the Short moving average
Long MA Window - The length of the Long moving average
Upper Band Offset - The offset to use for the upper bollinger offset
Lower Band Offset - The offset to use for the lower bollinger offset
Long Stop Loss % - The stop loss percentage to test
Long Take Profit % - The Take profit percentage to test
Initial SO Deviation % - The price deviation percentage required to place to first safety order
Safety Order Vol Step % - The volume scale to test
3Commas Bot ID - (self-explanatory)
Bot Email Token - Found in the deal start message for your bot (see link in the previous section for details)
3Commas Bot Trading Pair - The pair to include for composite bot start deals (should match the format of 3commas, not TradingView IE. USDT_BTC not BTCUSDT )
---------------------------------------------------------------------------------------------------------------------------------------------------------------------------------------------------
Start Date, Month, Year and End Date, Month, and Year all apply to the backtesting window. By default, it will use as much data as it can give the current period select (there is less historical data available for periods below 1H) back as far as 2016 (there appears to be no historical data on Trading view much before this). If you would like to test a different period of time, just change these values accordingly.
---------------------------------------------------------------------------------------------------------------------------------------------------------------------------------------------------
Composite bot using a Bollinger band type trading strategy. While its primary intention is to provide users a way of backtesting bot parameters, it can also be used to trigger a deal start by either using the {{strategy.order.alert_message}} field in your alert and providing the bot details in the configuration screen for the strategy or by including the usual deal start message provided by 3commas.
---------------------------------------------------------------------------------------------------------------------------------------------------------------------------------------------------
Original script:
1. 3Commas Bollinger Strategy by tedwardd
2. Momentum Strategy ( BTC /USDT; 1h) - MACD (with source code) by Drun30

Excitement - Crypto Surfer v1For those of us who need more excitement in our crypto journey besides just HODL, here’s a simple crypto robot that trades on the hourly (1H) candles. I call it the Crypto Surfer because it uses the 20 and 40 EMAs (Exponential Moving Averages) to decide when to enter and exit; price tends to “surf” above these EMAs when it is bullish, and “sink” below these EMAs when it is bearish. An additional 160 SMA (Simple Moving Average) with slope-angle detection, was added as a bull / bear filter to reduce the sting of drawdowns, by filtering-out long trades in a prolonged bear market.
USER NOTES:
- This script will buy $10,000 USD worth of crypto-currency per trade.
- It will only open one trade at a time.
- It has been backtested on all the high market cap coins such as Bitcoin, Ethereum, Binance Coin, Polkadot, Cardano.
- It should be run on the Hourly (H1) chart.
- In general, this moving average strategy *should be* profitable for 80% to 90% of the coins out there
- The 160 SMA filter with slope angle detection is designed to stop you from going long in a bear market.
- It is recommended you copy this script and modify it to suit your preferred coin during backtesting, before running live.
- Trading is inherently risky (exciting), and I shall not be liable for any losses you incur, even if these losses are due to sampling bias.

MACD oscillator with EMA strategy 4H This is a simple, yet efficient strategy, which is made from a combination of an oscillator and a moving average.
Its setup for 4h candles with the current settings, however it can be adapted to other different timeframes.
It works nicely ,beating the buy and hold for both BTC and ETH over the last 3 years.
As well with some optimizations and modifications it can be adapted to futures market, indexes(NASDAQ,NIFTY etc), forex(GBPUSD), stocks and so on.
Components:
MACD
EMA
Time condition
Long/short option
For long/exit short we enter when we are above the ema, histogram is positive and current candle is higher than previous.
For short /exit long , when close below ema, histo negative and current candles smaller than previous
If you have any questions please let me know !

Bollinger Bands Trending Reverse StrategyWelcome to yet another script. This script was a lot easier since I was stuck for so long on the Donchian Channels one and learned so much from that one that I could use in this one.
This code should be a lot cleaner compared to the Donchian Channels, but we'll leave that up to the pro's.
This strategy has two entry signals, long = when price hits lower band, while above EMA, previous candle was bearish and current candle is bullish.
Short = when price hits upper band, while below EMA, previous candle was bullish and current candle is bearish.
Take profits are the opposite side's band(lower band for long signals, upper band for short signals). This means our take profit price will change per bar.
Our stop loss doesn't change, it's the difference between entry price and the take profit target divided by the input risk reward.

Donchian Channels Trending Breakout StrategyThis script looks for two entry signals. Long is when the previous breakout of the donchian channels was a low, price is above the input EMA, current price is equal or higher than the upper band and we're not in a position yet. Short is the other way around, so previous breakout of the donchian channels was a high, price is below the input EMA, current price is equal or lower than the lower band.
I haven't found a script that does take the previous highs and lows into consideration. Works for any markets in any conditions because the stop loss and profit targets are based on the upper and lower band of the donchian channels, which means the stop loss and profit targets move with the trend.
For more details see the script itself, I wrote a ton of comments.

MACD Crossover trend strategy, Long and ShortHey everybody,
This is my first strategy and script I wrote mostly myself. There's tons of content out there to learn how to code in Pinescript and it's exactly what I wanted and needed in this time of my life.
In any case, I made a rather simple MACD crossover strategy that only takes trades in the direction of both EMA and SMA (there are inputs to change the length of the moving averages and lots of other stuff too).
If the MACD line crosses upwards on the signal line, while above the zero point of the histogram and the price is above EMA + SMA , it's a long signal.
If the MACD line cosses downards on the signal line, while below zero on the histogram and the price is below EMA + SMA , it's a short signal.
There are a lot of default variables that make no sense, for basically any symbol you're going to be looking at. You're going to have to adjust the EMA , SMA , backtest date, take profit, stop loss and all that good stuff yourself to find decently profitable parameters.
I made this myself because I couldn't really find a strategy out there that allowed for so much customizing and it's an easy way to get started in Pinescript.
If you have any suggestions, tips or you see a flatout mistake in my code, please let me know. I'm still learning, everyday and I'm enjoying every second of it.

Triple EMA StrategyThis is my first ever script so any suggestions, recommendations or improvement ideas welcome!
This strategy is an implementation of a standard three exponential moving averages strategy (defaults: EMA1=5, EMA2=20 and EMA3=50 candles). Trades are executed if EMA1 crosses above/below EMA2 and they are both above/below EMA3. In addition, the close of the current candle must be above/below the previous one by at least the number of ticks you specify in the "buffer" parameter (default 150 ticks). This additional check eliminates many bad trades.
There is also a trailing stoploss which comes into play once the price has gone above/below its initial value which it then follows the price with to ensure the trade closes at the highest possible price.
I find this strategy works best on a 15 minute chart but feel free to play around and fine tune the various parameters. If you find a good setup that returns decent profits, I'd be keen to hear it!

Scalping using RSI 2 indicator with TSLThis strategy implements a simply scalping using the RSI (calculated on two periods), the slopes of two MAs ( EMA or SMA ) having different lengths (by default, I use 50 and 200).
A trailing stop loss (%) is used.
Entry conditions:
.) Fast MA > Slow MA and Price > Slow MA and RSI < Oversold Threshold ------> go Long
.) Fast MA < Slow MA and Price < Slow MA and RSI > Overbought Threshold ------> go Short
Exit conditions:
.) Long entry condition is true and (close >= TP or close <= TSL ) ----> close short position
.) Short entry condition is true and (close <= TP or close >= TSL ) ----> close long position
The strategy performed best on Bitcoin and the most liquid and capitalized Altcoins but works excellent on volatile assets, mainly if they often go trending.
Works best on 3h - 4h time frame.
There's also an optional Volatility filter, which opens the position only if the difference between the two slopes is more than a specific value, which can be set in the study inputs. The purpose is not opening positions if the price goes sideways and the noise is way > than the signal.
Note:
.) the RSI length is 2;
.) the oversold Threshold is 90%;
.) the overbought Threshold is 10%;
.) by default, the trailing stop loss per cent is 1%;
.) by default, the fast MA length is 50;
.) by default, the slow MA length is 200;
.) by default, the MA used is EMA.
Cheers.

EMA Cross StrategyThis double EMA crossover strategy aims to illustrate a good strategy design.
It is currently the only published script that:
supports a proper date picker for the backtest period
is able to test in short and long mode only