LRS-Strategy: 200-EMA Buffer & Long/Short Signals LRS-Strategy: 200-EMA Buffer & Long/Short Signals
This indicator is designed to help traders implement the Leveraged Return Strategy (LRS) using the 200-day Exponential Moving Average (EMA) as a key trend-following signal. The indicator offers clear long and short signals by analyzing the price movements relative to the 200-day EMA, enhanced by customizable buffer zones for increased precision.
Key Features:
200-Day EMA: The main trend indicator. When the price is above the 200-day EMA, the market is considered in an uptrend, and when it is below, it indicates a downtrend.
Customizable Buffer Zones: Users can define a percentage buffer around the 200-day EMA (default is 3%). The upper and lower buffer zones help filter out noise and prevent premature signals.
Precise Long/Short Signals:
Long Signal: Triggered when the price moves from below the lower buffer zone, crosses the 200-day EMA, and then breaks above the upper buffer zone.
Short Signal: Triggered when the price moves from above the upper buffer zone, crosses the 200-day EMA, and then breaks below the lower buffer zone.
Alternating Signals: Ensures that a new signal (long or short) is only generated after the opposite signal has been triggered, preventing multiple signals of the same type without a reversal.
Clear Visual Aids: The indicator displays the 200-day EMA and buffer zones on the chart, along with buy (long) and sell (short) signals. This makes it easy to track trends and time entries/exits.
How to Use:
Long Entry: Look for the price to move below the lower buffer, cross the 200-day EMA from below, and then break out of the upper buffer to confirm a long signal.
Short Entry: Look for the price to move above the upper buffer, cross below the 200-day EMA, and then break below the lower buffer to confirm a short signal.
This indicator is perfect for traders who prefer a structured, trend-following approach, using clear rules to minimize noise and identify meaningful long or short opportunities.
Đường Trung bình trượt Hàm mũ (EMA)

Ewma | viResearchEwma | viResearch
Conceptual Foundation and Innovation
The "Ewma" indicator from viResearch combines the benefits of the Exponentially Weighted Moving Average (EWMA) with the Weighted Moving Average (WMA) to offer traders a more responsive and precise method for trend-following. The EWMA applies greater weight to recent price data, allowing the indicator to adapt quickly to market changes while filtering out short-term fluctuations. By incorporating both EWMA and WMA, this script provides a smoother and more accurate representation of market trends, making it ideal for identifying potential trend shifts and improving trade timing.
This dual-layer smoothing process enables traders to follow market trends with greater accuracy and sensitivity, allowing them to respond quickly to price movements while minimizing the impact of market noise.
Technical Composition and Calculation
The "Ewma" script uses a combination of WMA and EWMA to smooth out price data. First, a WMA is applied to the selected source price over a user-defined length. This WMA is then used as the input for calculating the EWMA, further smoothing the trend and reducing lag. The EWMA is calculated over the same user-defined length, ensuring consistency between the two smoothing processes. This layered approach helps generate more reliable signals for trend changes, as it reduces the influence of short-term price volatility while maintaining responsiveness to significant price movements.
The script monitors whether the current EWMA value is higher or lower than the previous value, generating a trend signal based on this comparison. If the EWMA is higher than the previous bar, it signals a potential upward trend, while a lower EWMA indicates a possible downward trend.
Features and User Inputs
The "Ewma" script offers several customizable inputs, allowing traders to fine-tune the indicator to suit their trading strategies. The Length input controls the period over which both the WMA and EWMA are calculated, affecting how responsive or smooth the indicator is. Additionally, the script includes built-in alert conditions, notifying traders when a trend shift occurs, either to the upside or downside.
Practical Applications
The "Ewma" indicator is designed for traders who want to capture market trends more accurately while reducing the noise from short-term price fluctuations. The dual smoothing of the EWMA helps traders identify potential trend reversals with greater clarity, allowing for earlier and more informed trade entries and exits. By smoothing price data while maintaining responsiveness, the "Ewma" indicator enhances traditional trend-following methods, making it easier to stay aligned with longer-term market trends. The adjustable length setting allows traders to adapt the indicator to various market conditions, whether they prefer faster signals for short-term trading or slower, smoother signals for long-term trend analysis.
Advantages and Strategic Value
The "Ewma" script offers a significant advantage by combining the WMA with the EWMA, delivering a smoother and more responsive trend indicator. This combination helps traders reduce the impact of short-term volatility while maintaining the ability to react quickly to significant price changes. By offering an adaptable and reliable method for trend-following, the "Ewma" indicator helps traders optimize their market positioning and improve the accuracy of their trading strategies.
Alerts and Visual Cues
The script includes alert conditions that notify traders when a significant trend change occurs. The "Ewma Long" alert is triggered when the EWMA crosses above its previous value, indicating a potential upward trend. The "Ewma Short" alert signals a possible downward trend when the EWMA crosses below its previous value. Visual cues, such as changes in the EWMA line color, provide traders with clear and actionable information in real time.
Summary and Usage Tips
The "Ewma | viResearch" indicator provides traders with a powerful tool for trend analysis by combining the benefits of WMA and EWMA smoothing. By incorporating this script into your trading strategy, you can improve your ability to detect trend shifts, confirm trend direction, and reduce noise from short-term price fluctuations. Whether you’re focused on short-term market moves or long-term trends, the "Ewma" indicator offers a reliable and customizable solution for traders at all levels.
Note: Backtests are based on past results and are not indicative of future performance.

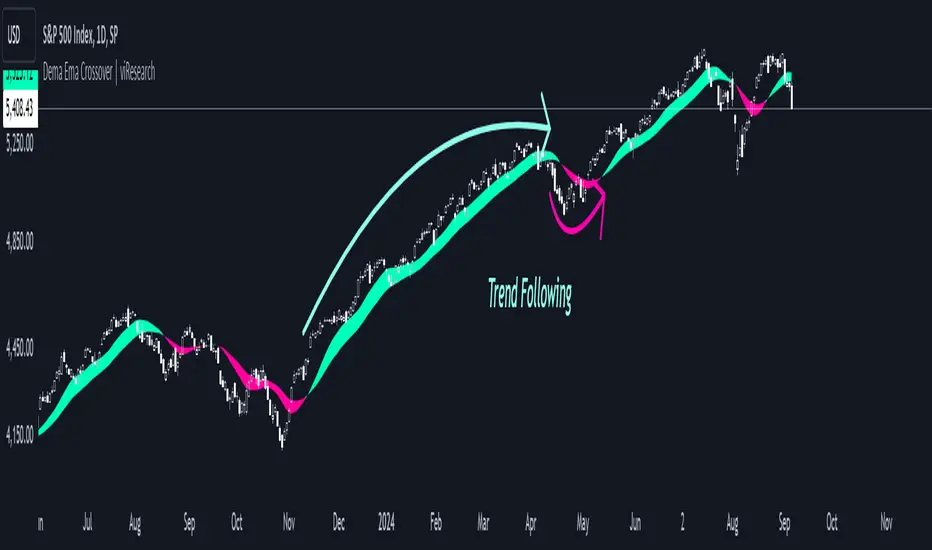
Dema Ema Crossover | viResearchDema Ema Crossover | viResearch
Conceptual Foundation and Innovation
The "Dema Ema Crossover" indicator combines the strengths of the Double Exponential Moving Average (DEMA) with an Exponential Moving Average (EMA) crossover strategy. The DEMA is well-known for its ability to reduce lag compared to standard moving averages, offering smoother trend-following signals. In this script, the DEMA is used as the foundation, with two EMAs applied on top of it to further refine the trend detection and crossover points. This combination provides traders with a robust tool for identifying trend shifts and potential entry or exit points.
By leveraging the faster responsiveness of the DEMA and using EMA crossovers, the "Dema Ema Crossover" indicator helps traders detect and act on trend reversals more efficiently, making it a powerful solution for capturing both short- and long-term market movements.
Technical Composition and Calculation
The "Dema Ema Crossover" script consists of three main components: the Double Exponential Moving Average (DEMA), the fast EMA, and the slow EMA. The DEMA is calculated based on the selected length and source price, providing a smooth representation of market trends. Two EMAs are then applied to the DEMA, with one being faster (shorter period) and the other slower (longer period). The crossover between these two EMAs generates the signals for trend changes.
For the DEMA, the calculation uses the ta.dema function, which reduces lag while maintaining smoothness in the moving average. The fast and slow EMAs are calculated using the ta.ema function, with the fast EMA responding more quickly to price changes, while the slow EMA captures broader trends. The crossover between these two EMAs is used to generate buy and sell signals based on the direction of the crossover.
Features and User Inputs
The "Dema Ema Crossover" script offers several customizable inputs that allow traders to tailor the indicator to their trading strategies. The DEMA Length controls how smooth the DEMA is, with a longer length creating a slower-moving average and a shorter length providing a more responsive one. The Fast EMA Length and Slow EMA Length are also customizable, allowing traders to adjust the sensitivity of the crossover signals based on their market outlook and preferred trading timeframe.
Practical Applications
The "Dema Ema Crossover" indicator is designed for traders looking for a reliable crossover strategy that combines the responsiveness of the DEMA with the precision of EMA crossovers. This tool is particularly effective for:
Identifying Trend Reversals: The crossover between the fast and slow EMAs applied to the DEMA provides early signals of potential trend reversals, allowing traders to position themselves in the market more effectively. Confirming Trend Direction: The combined effect of the DEMA and EMA crossovers helps confirm the strength of a trend, improving decision-making around trade entries and exits. Adapting to Different Market Conditions: The customizable parameters allow traders to adjust the sensitivity of the crossover signals, making the indicator suitable for both fast-moving markets and slower, trending environments.
Advantages and Strategic Value
The "Dema Ema Crossover" script offers a significant advantage by combining the smoothness of the DEMA with the accuracy of EMA crossovers. The DEMA’s ability to reduce lag while maintaining responsiveness makes it ideal for trend-following strategies, while the crossover between the fast and slow EMAs provides precise entry and exit points. This combination reduces false signals and helps traders adapt to changing market conditions, resulting in a more reliable and efficient trend-following system.
Alerts and Visual Cues
The script includes alert conditions to notify traders of key crossover events. The "Dema Ema Crossover Long" alert is triggered when the fast EMA crosses above the slow EMA, signaling a potential upward trend. Conversely, the "Dema Ema Crossover Short" alert signals a possible downward trend when the fast EMA crosses below the slow EMA. Visual cues such as colored fills between the two EMAs highlight these crossover points on the chart, helping traders quickly identify trend shifts.
Summary and Usage Tips
The "Dema Ema Crossover | viResearch" indicator provides traders with a powerful combination of the DEMA and EMA crossovers, offering a smooth yet responsive tool for detecting trend reversals and confirming trend direction. By incorporating this script into your trading strategy, you can improve your ability to capture trend changes with greater accuracy, reducing the impact of market noise. Whether you are focused on short-term market moves or long-term trends, the "Dema Ema Crossover" indicator offers a flexible and reliable solution for traders at all levels.
Note: Backtests are based on past results and are not indicative of future performance.
Austin's Range Filter with Trade SignalsAustin’s Range Filter with Trade Signals
Description:
Austin’s Range Filter with Trade Signals is a versatile indicator that combines a custom range filter with dynamic buy and sell signals based on EMA crossovers. This indicator is designed to help traders easily identify trend reversals and optimal trade entry/exit points.
Key Features:
• Range Filter Calculation: The indicator calculates the highest and lowest price over a user-defined period, then multiplies the difference by a customizable multiplier to establish a dynamic range. A combined middle band (average of the upper and lower bounds) is plotted for a clearer visual representation of the price trend.
• Exponential Moving Average (EMA): A user-configurable EMA is added, which acts as the primary signal line. You can adjust the length of the EMA to suit your trading style.
• Buy and Sell Signals:
• Buy Signal: Triggered when the price crosses above the EMA, indicating a potential upward trend.
• Sell Signal: Triggered when the price crosses below the EMA, indicating a potential downward trend.
• Alerts: Custom alert conditions for buy and sell signals allow you to set up real-time notifications when the signal changes, so you never miss an opportunity.
• Customizable Display: You can toggle the visibility of the combined band (purple) and the EMA (blue) for a cleaner chart.
How It Works:
• Buy when the price crosses above the EMA.
• Sell when the price crosses below the EMA.
• Background colors indicate whether the current price is above or below the calculated range, helping you visually identify bullish and bearish conditions.
Customization Options:
• Range Filter Length: The lookback period for the highest/lowest price calculation.
• Range Multiplier: Adjusts the size of the range.
• EMA Length: Set the length of the EMA to fine-tune the signal sensitivity.
• Toggle Lines: Show or hide the combined band and EMA for more flexibility.
This indicator is suitable for a variety of markets including stocks, forex, and crypto, and can be applied to any timeframe. Use it as part of your technical analysis to spot market trends and improve your decision-making process.
How to Use:
1. Apply the indicator to your chart and adjust the settings to suit your strategy.
2. Set up alerts for buy and sell signals to receive real-time notifications.
3. Monitor the price relative to the range and EMA to better time your trades.
This indicator is perfect for traders looking for an intuitive yet powerful tool to enhance their trading strategies with automatic signals and alerts.

[MACC] Moving Average Candle ColorThe simplest trading framework is using moving average. This indicator is harnessing that very method.
What It Does:
This indicator helps you see market trends at a glance by changing the color of the candlesticks based on the relationship between two Exponential Moving Averages (EMAs). When the 9-period EMA is above the 21-period EMA, candlesticks turn green, suggesting a bullish trend. When the 9 EMA is below the 21 EMA, candlesticks turn red, indicating a bearish trend.
Why You'll Love It:
Easy Trend Visualization: Quickly spot trends and potential reversals with color-coded candlesticks.
Customizable Settings: Adjust the lengths of the EMAs to fit your trading style. Just change the values in the settings panel and watch the indicator update in real-time.
Optional EMA Lines: See the EMA lines plotted on your chart for added context and trend confirmation.
How to Use It:
Green Candlesticks: It’s a sign that the trend is likely upward.
Red Candlesticks: signaling a potential downward trend.
Customization:
EMA Lengths: You can set the lengths for the 9 EMA and 21 EMA to whatever fits your trading strategy best.
Colors: Adjust the colors if you want to match your chart’s theme.
Get Started: Add this indicator to your TradingView chart and tweak the settings to see how it helps you track market trends more effectively.
Cherio...
Uptrick: Volume-Weighted EMA Signal### **Uptrick: Volume-Weighted EMA Signal (UVES) Indicator - Comprehensive Description**
#### **Overview**
The **Uptrick: Volume-Weighted EMA Signal (UVES)** is an advanced, multifaceted trading indicator meticulously designed to provide traders with a holistic view of market trends by integrating Exponential Moving Averages (EMA) with volume analysis. This indicator not only identifies the direction of market trends through dynamic EMAs but also evaluates the underlying strength of these trends using real-time volume data. UVES is a versatile tool suitable for various trading styles and markets, offering a high degree of customization to meet the specific needs of individual traders.
#### **Purpose**
The UVES indicator aims to enhance traditional trend-following strategies by incorporating a critical yet often overlooked component: volume. Volume is a powerful indicator of market strength, providing insights into the conviction behind price movements. By merging EMA-based trend signals with detailed volume analysis, UVES offers a more nuanced and reliable approach to identifying trading opportunities. This dual-layer analysis allows traders to differentiate between strong trends supported by significant volume and weaker trends that may be prone to reversals.
#### **Key Features and Functions**
1. **Dynamic Exponential Moving Average (EMA):**
- The core of the UVES indicator is its dynamic EMA, calculated over a customizable period. The EMA is a widely used technical indicator that smooths price data to identify the underlying trend. In UVES, the EMA is dynamically colored—green when the current EMA value is above the previous value, indicating an uptrend, and red when below, signaling a downtrend. This visual cue helps traders quickly assess the trend direction without manually calculating or interpreting raw data.
2. **Comprehensive Moving Average Customization:**
- While the EMA is the default moving average in UVES, traders can select from various other moving average types, including Simple Moving Average (SMA), Smoothed Moving Average (SMMA), Weighted Moving Average (WMA), and Volume-Weighted Moving Average (VWMA). Each type offers unique characteristics:
- **SMA:** Provides a simple average of prices over a specified period, suitable for identifying long-term trends.
- **EMA:** Gives more weight to recent prices, making it more responsive to recent market movements.
- **SMMA (RMA):** A slower-moving average that reduces noise, ideal for capturing smoother trends.
- **WMA:** Weighs prices based on their order in the dataset, making recent prices more influential.
- **VWMA:** Integrates volume data, emphasizing price movements that occur with higher volume, making it particularly useful in volume-sensitive markets.
3. **Signal Line for Trend Confirmation:**
- UVES includes an optional signal line, which applies a secondary moving average to the primary EMA. This signal line can be used to smooth out the EMA and confirm trend changes. The signal line’s color changes based on its slope—green for an upward slope and red for a downward slope—providing a clear visual confirmation of trend direction. Traders can adjust the length and type of this signal line, allowing them to tailor the indicator’s responsiveness to their trading strategy.
4. **Buy and Sell Signal Generation:**
- UVES generates explicit buy and sell signals based on the interaction between the EMA and the signal line. A **buy signal** is triggered when the EMA transitions from a red (downtrend) to a green (uptrend), indicating a potential entry point. Conversely, a **sell signal** is triggered when the EMA shifts from green to red, suggesting an exit or shorting opportunity. These signals are displayed directly on the chart as upward or downward arrows, making them easily identifiable even during fast market conditions.
5. **Volume Analysis with Real-Time Buy/Sell Volume Table:**
- One of the standout features of UVES is its integration of volume analysis, which calculates and displays the volume attributed to buying and selling activities. This analysis includes:
- **Buy Volume:** The portion of the total volume associated with price increases (close higher than open).
- **Sell Volume:** The portion of the total volume associated with price decreases (close lower than open).
- **Buy/Sell Ratio:** A ratio of buy volume to sell volume, providing a quick snapshot of market sentiment.
- These metrics are presented in a real-time table positioned in the top-right corner of the chart, with customizable colors and formatting. The table updates with each new bar, offering continuous feedback on the strength and direction of the market trend based on volume data.
6. **Customizable Settings and User Control:**
- **EMA Length and Source:** Traders can specify the lookback period for the EMA, adjusting its sensitivity to price changes. The source for EMA calculations can also be customized, with options such as close, open, high, low, or other custom price series.
- **Signal Line Customization:** The signal line’s length, type, and width can be adjusted to suit different trading strategies, allowing traders to optimize the balance between trend detection and noise reduction.
- **Offset Adjustment:** The offset feature allows users to shift the EMA and signal line forward or backward on the chart. This can help align the indicator with specific price action or adjust for latency in decision-making processes.
- **Volume Table Positioning and Formatting:** The position, size, and color scheme of the volume table are fully customizable, enabling traders to integrate the table seamlessly into their chart setup without cluttering the visual workspace.
7. **Versatility Across Markets and Trading Styles:**
- UVES is designed to be effective across a wide range of financial markets, including Forex, stocks, cryptocurrencies, commodities, and indices. Its adaptability to different markets is supported by its comprehensive customization options and the inclusion of volume analysis, which is particularly valuable in markets where volume plays a crucial role in price movement.
#### **How Different Traders Can Benefit from UVES**
1. **Trend Followers:**
- Trend-following traders will find UVES particularly beneficial for identifying and riding trends. The dynamic EMA and signal line provide clear visual cues for trend direction, while the volume analysis helps confirm the strength of these trends. This combination allows trend followers to stay in profitable trades longer and exit when the trend shows signs of weakening.
2. **Volume-Based Traders:**
- Traders who focus on volume as a key indicator of market strength can leverage the UVES volume table to gain insights into the buying and selling pressure behind price movements. By monitoring the buy/sell ratio, these traders can identify periods of strong conviction (high buy volume) or potential reversals (high sell volume) with greater accuracy.
3. **Scalpers and Day Traders:**
- For traders operating on shorter time frames, UVES provides quick and reliable signals that are essential for making rapid trading decisions. The ability to customize the EMA length and type allows scalpers to fine-tune the indicator for responsiveness, while the volume analysis offers an additional layer of confirmation to avoid false signals.
4. **Swing Traders:**
- Swing traders, who typically hold positions for several days to weeks, can use UVES to identify medium-term trends and potential entry and exit points. The indicator’s ability to filter out market noise through the signal line and volume analysis makes it ideal for capturing significant price movements without being misled by short-term volatility.
5. **Position Traders and Long-Term Investors:**
- Even long-term investors can benefit from UVES by using it to identify major trend reversals or confirm the strength of long-term trends. The flexibility to adjust the EMA and signal line to longer periods ensures that the indicator remains relevant for detecting shifts in market sentiment over extended time frames.
#### **Optimal Settings for Different Markets**
- **Forex Markets:**
- **EMA Length:** 9 to 14 periods.
- **Signal Line:** Use VWMA or WMA for the signal line to incorporate volume data, which is crucial in the highly liquid Forex markets.
- **Best Use:** Short-term trend following, with an emphasis on identifying rapid changes in market sentiment.
- **Stock Markets:**
- **EMA Length:** 20 to 50 periods.
- **Signal Line:** SMA or EMA with a slightly longer length (e.g., 50 periods) to capture broader market trends.
- **Best Use:** Medium to long-term trend identification, with volume analysis confirming the strength of institutional buying or selling.
- **Cryptocurrency Markets:**
- **EMA Length:** 9 to 12 periods, due to the high volatility in crypto markets.
- **Signal Line:** SMMA or EMA for smoothing out extreme price fluctuations.
- **Best Use:** Identifying entry and exit points in volatile markets, with the volume table providing insights into market manipulation or sudden shifts in trader sentiment.
- **Commodity Markets:**
- **EMA Length:** 14 to 21 periods.
- **Signal Line:** WMA or VWMA, considering the impact of trading volume on commodity prices.
- **Best Use:** Capturing medium-term price movements and confirming trend strength with volume data.
#### **Customization for Advanced Users**
- **Advanced Offset Usage:** Traders can experiment with different offset values to see how shifting the EMA and signal line impacts the timing of buy/sell signals. This can be particularly useful in markets with known latency or for strategies that require a delayed confirmation of trend changes.
- **Volume Table Integration:** The position, size, and colors of the volume table can be adjusted to fit seamlessly into any trading setup. For example, a trader might choose to position the table in the bottom-right corner and use a smaller size to keep the focus on price action while still having access to volume data.
- **Signal Filtering:** By combining the signal line with the primary EMA, traders can filter out false signals during periods of low volatility or when the market is range-bound. Adjusting the length of the signal line allows for greater control over the sensitivity of the trend detection.
#### **Conclusion**
The **Uptrick: Volume-Weighted EMA Signal (UVES)** is a powerful and adaptable indicator designed for traders who demand more from their technical analysis tools. By integrating dynamic EMA trend signals with real-time volume analysis, UVES offers a comprehensive view of market conditions, making it an invaluable resource for identifying trends, confirming signals, and understanding market sentiment. Whether you are a day trader, swing trader, or long-term investor, UVES provides the versatility, precision, and customization needed to make more informed and profitable trading decisions. With its ability to adapt to various markets and trading styles, UVES is not just an indicator but a complete trend analysis solution.

Super RSI: Multi-Timeframe, Multi-RSI-MA, Multi Symbol [DucTri]█ Overview
RSI is a very popular indicator that almost every trader knows about. I created this indicator with the goal of helping you use RSI more conveniently and effectively.
█ Uses
Monitor the RSI of 10 currency pairs simultaneously.
The first column shows the RSI of the current currency pair.
RSI below 30 will have a Red background, and above 70 will have a Green background.
Display multiple RSI lines with different lengths (or timeframes).
Displays 3 RSI with 3 different lengths 7, 14 and 21
Displays two RSI lines with two different timeframes. The purple line shows RSI (14) for the 1H timeframe, and the blue line shows RSI (14) for the 4H timeframe.
Display MA and Bollinger Band lines for RSI.
Shows the RSI line along with two MA lines of the RSI: EMA (9) in blue and WMA (45) in red.
Identify RSI Divergence with custom settings
█ Input
- You can have up to three RSI lines, with customizable lengths and timeframes.
- You also have up to three RSI-MA lines, where you can customize the MA type and length.
- You can track RSI for up to 10 currency pairs at the same time.
- Additionally, you can change how the top (or bottom) is determined when identifying divergence.
█ Alerts
Send alerts when two RSI lines cross. For example, when the RSI 14 crosses above the RSI 21, or the RSI on the 1H timeframe crosses above the RSI on the 4H timeframe.*
Send alerts when RSI crosses above or below the RSI-MA line.
Send alerts when two RSI-MA lines cross. For example, when the RSI-EMA (9) crosses above the RSI-WMA (45).*
Send alerts when Divergence (Convergence) appears.
Send alerts when any currency pair in the monitored list shows an Overbought or Oversold signal.

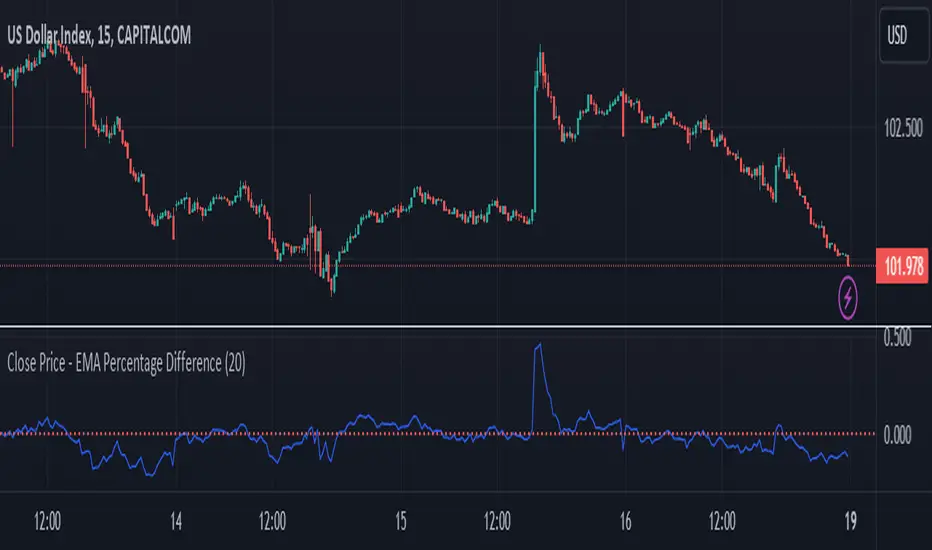
Close Price - EMA Percentage Difference
Title: Close Price - EMA Percentage Difference Indicator
Description:
The Close Price - EMA Percentage Difference Indicator is an essential tool designed to calculate and display the percentage difference between the closing price of a security and its Exponential Moving Average (EMA). This indicator is particularly useful for traders and analysts who want to understand how far the current price is from its EMA, providing insights into potential price trends and reversals.
Key Features:
Customizable EMA Period: Easily adjust the EMA period to match your trading strategy. Whether you're focusing on short-term trends with a 20-period EMA or analyzing long-term trends with a 200-period EMA, this indicator is flexible to suit your needs.
Percentage Difference Calculation: The indicator computes the percentage difference between the closing price and the selected EMA, allowing you to see how much the current price deviates from its moving average in percentage terms. This calculation helps in identifying potential buying or selling opportunities based on price movements relative to the EMA.
Zero Line Reference: A dotted red line at the zero level is included for quick visual reference. This line helps you instantly identify when the closing price is equal to the EMA, and whether the price is above or below the EMA.
Visual Representation: The percentage difference is plotted on a separate panel below the price chart, providing a clear and intuitive visualization that aids in decision-making.
How to Use:
Adjust the EMA period to fit your analysis or trading strategy.
Observe the percentage difference to understand the strength of the current price in relation to the EMA.
Use the zero line as a reference point to determine whether the price is above (positive values) or below (negative values) the EMA, which can help in identifying overbought or oversold conditions.
This indicator is suitable for all types of traders, from day traders to long-term investors, offering valuable insights into the price dynamics relative to the EMA.
Custom EMA Multi-Timeframe Indicator [Pineify]
This innovative indicator combines Exponential Moving Averages (EMAs) across multiple timeframes to provide traders with a comprehensive view of market trends and potential trading opportunities. By analyzing short, medium, and long-term EMAs simultaneously, this indicator offers valuable insights into market dynamics and helps identify high-probability entry and exit points.
Key Features
Multi-timeframe analysis using customizable EMAs
Visual representation of trend alignment across different timeframes
Customizable EMA lengths and sources for each timeframe
Buy and sell signals based on EMA crossovers
Alert functionality for real-time trade notifications
How It Works
The Custom EMA Multi-Timeframe Indicator calculates three separate EMAs:
1. Short-term EMA: Represents immediate market sentiment
2. Medium-term EMA: Captures intermediate trend direction
3. Long-term EMA: Reflects the overall market trend
These EMAs are plotted on the chart using different colors for easy identification. The indicator generates buy and sell signals based on the relative positions of these EMAs, providing traders with clear visual cues for potential trade entries and exits.
Trading Ideas and Insights
This indicator offers several powerful trading concepts:
Trend Alignment: When all three EMAs are aligned (short above medium above long), it indicates a strong trend. Traders can look for pullbacks to enter in the direction of the trend.
Trend Reversal: When the short-term EMA crosses above or below both the medium and long-term EMAs, it may signal a potential trend reversal. This can be used to exit existing positions or enter new trades in the opposite direction.
Range-bound Markets: When the EMAs are tightly grouped together, it suggests a consolidation phase. Traders can wait for a breakout or use range-trading strategies.
Momentum Confirmation: The speed at which the short-term EMA diverges from or converges with the longer-term EMAs can indicate the strength of the current move.
Unique Aspects
What sets this indicator apart is its ability to synthesize information from multiple timeframes into a single, easy-to-interpret visual display. Unlike traditional single-timeframe EMAs, this indicator provides a more holistic view of market trends, reducing false signals and improving trade timing.
The customizable nature of the indicator allows traders to adapt it to various trading styles and market conditions. By adjusting the EMA lengths and sources, traders can fine-tune the indicator to their specific needs and preferences.
How to Use
1. Apply the indicator to your chart
2. Customize the timeframes and EMA settings as desired
3. Look for buy signals when the short and medium EMAs cross above the long EMA
4. Look for sell signals when the short and medium EMAs cross below the long EMA
5. Use the relative positions of the EMAs to gauge overall trend strength and direction
6. Combine with other technical analysis tools for confirmation
Customization
The indicator offers extensive customization options:
Short, medium, and long timeframes can be adjusted
EMA lengths for each timeframe are customizable
EMA source (close, open, high, low, etc.) can be selected for each timeframe
Colors and line styles can be modified to suit personal preferences
Alert settings can be configured for automated trade notifications
Conclusion
The Custom EMA Multi-Timeframe Indicator is a powerful tool for traders seeking to gain a comprehensive understanding of market trends across different time horizons. By combining multiple EMAs and timeframes, it provides a unique perspective on market dynamics, helping traders make more informed decisions and potentially improve their trading results.
Whether you're a day trader looking for short-term opportunities or a swing trader focusing on longer-term trends, this indicator offers valuable insights that can enhance your trading strategy. Its flexibility and customization options make it suitable for a wide range of trading styles and market conditions.
Remember: While this indicator can be a valuable tool in your trading arsenal, it should not be used in isolation. Always combine it with other forms

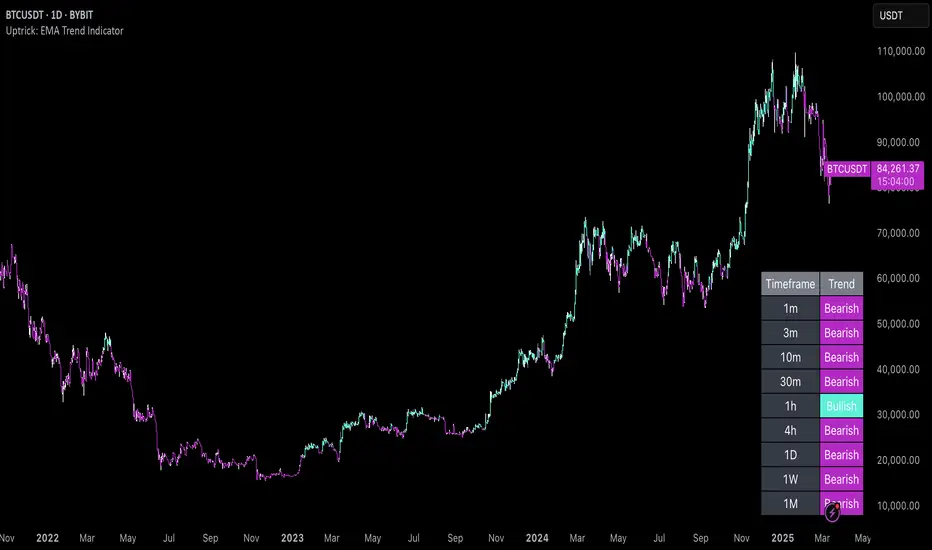
Uptrick: EMA Trend Indicator
### Overview
The goal of this script is to visually indicate on a trading chart whether all three Exponential Moving Averages (EMAs) are trending upwards (i.e., their slopes are positive). If all EMAs are trending upwards, the script will color the bars green. If not, the bars will be colored red.
### Key Concepts
1. **Exponential Moving Average (EMA)**: An EMA is a type of moving average that places more weight on recent data, making it more responsive to price changes compared to a simple moving average (SMA). In this script, we use three different EMAs with different lengths (20, 50, and 200 periods).
2. **Slope of an EMA**: The slope of an EMA refers to the direction in which the EMA is moving. If the current value of the EMA is higher than its value in the previous bar, the slope is positive (upward). Conversely, if the current value is lower than its previous value, the slope is negative (downward).
3. **Bar Color Coding**: The script changes the color of the bars on the chart to provide a visual cue:
- **Green Bars**: Indicate that all three EMAs are trending upwards.
- **Red Bars**: Indicate that one or more EMAs are not trending upwards.
### Detailed Breakdown
#### 1. Input Fields
- **EMA Lengths**: The script starts by allowing the user to input the lengths for the three EMAs. These lengths determine how many periods (e.g., days) are used to calculate each EMA.
- `ema20_length` is set to 20, meaning the first EMA uses the last 20 bars of data.
- `ema50_length` is set to 50, meaning the second EMA uses the last 50 bars of data.
- `ema200_length` is set to 200, meaning the third EMA uses the last 200 bars of data.
#### 2. EMA Calculation
- The script calculates the values of the three EMAs:
- **EMA 20**: This is calculated using the last 20 bars of closing prices.
- **EMA 50**: This is calculated using the last 50 bars of closing prices.
- **EMA 200**: This is calculated using the last 200 bars of closing prices.
These calculations result in three values for each bar on the chart, each representing the EMA value at that point in time.
#### 3. Determining EMA Slopes
- **EMA Slopes**: To understand the trend of each EMA, the script compares the current value of each EMA to its value in the previous bar:
- For the 20-period EMA, the script checks if today’s EMA value is higher than yesterday’s EMA value.
- This process is repeated for the 50-period and 200-period EMAs.
- If today’s EMA value is greater than yesterday’s value, the slope is positive (upward).
- If today’s EMA value is not greater (it is either equal to or less than yesterday’s value), the slope is not positive.
#### 4. Evaluating All Slopes
- **All Slopes Positive Condition**: The script combines the results of the individual slope checks into a single condition. It uses a logical "AND" operation:
- The condition will be `true` only if all three EMAs (20, 50, and 200) have positive slopes.
- If any one of the EMAs does not have a positive slope, the condition will be `false`.
#### 5. Coloring the Bars
- **Bar Coloring Logic**: Based on the above condition, the script decides the color of each bar on the chart:
- If all slopes are positive (condition is `true`), the bar is colored green.
- If any slope is not positive (condition is `false`), the bar is colored red.
- **Visual Cue**: This provides a quick, visual indication to traders:
- Green bars suggest that the market is in an upward trend across all three EMAs, which might indicate a strong bullish trend.
- Red bars suggest that the trend is not uniformly upward, which could be a sign of weakening momentum or a potential reversal.
#### 6. Alerts
- **Alert Conditions**: The script also allows for alert conditions to be set based on the slope analysis:
- An alert can be triggered when all EMA slopes are positive. This might be useful for traders who want to be notified when the market shows strong upward momentum.
### Summary
- The script essentially takes the market data and applies three different EMAs to it, each with a different time frame.
- It then checks the direction (slope) of each of these EMAs to determine if they are all trending upwards.
- If they are, the script colors the bar green, signaling a potentially strong bullish trend.
- If any of the EMAs is not trending upwards, it colors the bar red, indicating a potential issue with the strength of the trend.
This approach helps traders quickly assess market conditions based on multiple EMAs, providing a clearer picture of the overall trend across different time frames.
Multi-Timeframe EMA Distance & % Change TableDescription of Multi-Timeframe EMA Distance & % Change Table
The Multi-Timeframe EMA Distance & % Change Table indicator is designed to display the distance and percentage change between the current price and the Exponential Moving Averages (EMAs) on multiple timeframes. It creates a table to show these values, with customizable options for decimal precision .
Key Features:
Inputs:
- Timeframes (tf1, tf2, tf3, tf4): User-defined timeframes for EMA calculations (e.g., 1 minute, 15 minutes, daily, etc.).
- EMA Levels (emaLevel, emaLevel2, emaLevel3): User-defined periods for three different EMAs.
EMA Calculations:
- Computes EMAs for the specified levels (50, 100, 200) on each of the user-selected timeframes.
Plotting:
- Plots the EMAs on the chart with distinct colors: Orange, Teal, and Green for different EMAs.
Display Options:
- Checkbox (displayAsPercentage): Allows the user to toggle between displaying distances or percentage changes.
- Decimal Precision:
- decimalPlacesDistance: Specifies the number of decimal places for rounded distance values.
- decimalPlacesPercentage: Specifies the number of decimal places for rounded percentage values.
Table Creation:
- Location: Table is placed in the top-right corner of the chart.
- Headers: Includes columns for each timeframe and EMA distance/percentage.
Distance and Percentage Calculations:
- Distances: Calculated as the difference between the current price and the EMA values for each timeframe.
- Percentages: Calculated as the distance divided by the EMA value, converted to a percentage.
Decimal Rounding:
- Custom Rounding Function: Ensures that distance and percentage values are displayed with the user-specified number of decimal places.
Color Coding:
- Distance Values: Colored green if positive, red if negative.
- Table Entries: Display either the rounded distance or percentage, based on user selection.
Table Update:
- The table is dynamically updated with either distance or percentage values based on the user's choice and rounded to the specified number of decimal places.
This indicator provides a comprehensive overview of EMA distances and percentage changes across multiple timeframes, with detailed control over the precision of the displayed values.

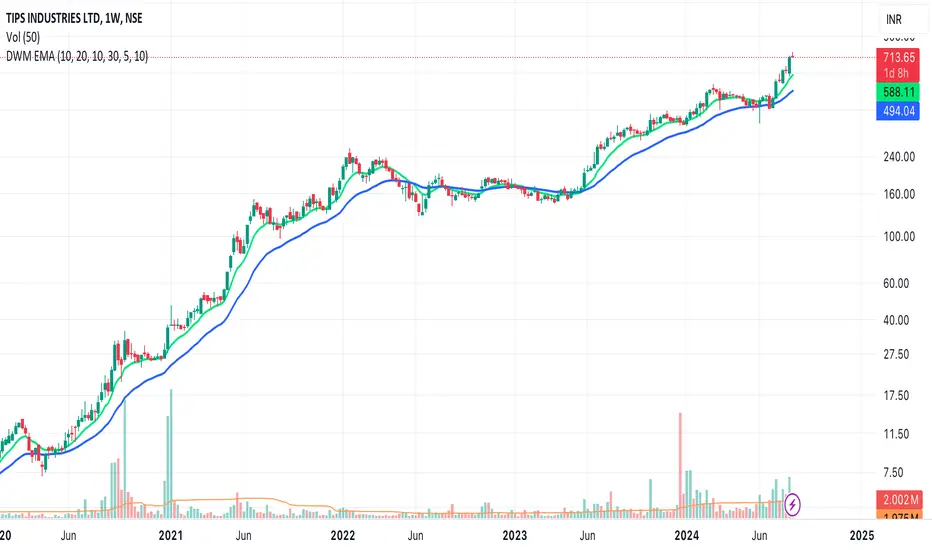
EMAs for D W M TimeframesEMAs for D W M Timeframes
Description:
The “EMAs for D W M Timeframes” indicator allows users to set specific Exponential Moving Averages (EMAs) for Daily, Weekly, and Monthly timeframes. The script utilizes these user-defined EMA settings based on the chart’s current timeframe, ensuring that the appropriate EMAs are always displayed.
Please note that for timeframes other than specified, it defaults to daily EMA values.
EMA : The Exponential Moving Average (EMA) is a type of moving average that places greater weight and significance on the most recent data points. This makes the EMA more responsive to recent price changes compared to a simple moving average (SMA), making it a popular tool for identifying trends in financial markets.
Features:
Daily and Default EMAs: Users can specify two EMAs for the Daily timeframe, which also act as the default EMAs for any unspecified timeframe. The default values are set to 10 and 20.
Weekly EMAs: For Weekly charts, the indicator plots two EMAs with default values of 10 and 30. These EMAs help in tracking medium-term trends.
Monthly EMAs: On Monthly charts, the indicator plots EMAs with default values of 5 and 10, providing insights into long-term trends.
Timeframe-Based Display: The indicator automatically uses the EMA settings corresponding to the current chart’s timeframe, whether it is Daily, Weekly, or Monthly.
If the chart is set to any other timeframe, the Daily EMA settings are used by default.
How to Use:
Inputs:
* Daily and Default EMA 1 & 2: Adjust the values for the short-term and long-term EMAs on the Daily chart, which are also used for any other unspecified timeframe.
* Weekly EMA 1 & 2: Set the values for the EMAs that will be shown on Weekly charts.
* Monthly EMA 1 & 2: Specify the values for the EMAs to be displayed on Monthly charts.
Visualization:
* Depending on the current chart timeframe, the script will automatically display the relevant EMAs.
Default Values:
* Daily and Default EMAs: 10 (EMA 1), 20 (EMA 2)
* Weekly EMAs: 10 (EMA 1), 30 (EMA 2)
* Monthly EMAs: 5 (EMA 1), 10 (EMA 2)
This indicator is designed for users who want to monitor EMAs across different timeframes, using specific settings for Daily, Weekly, and Monthly charts.
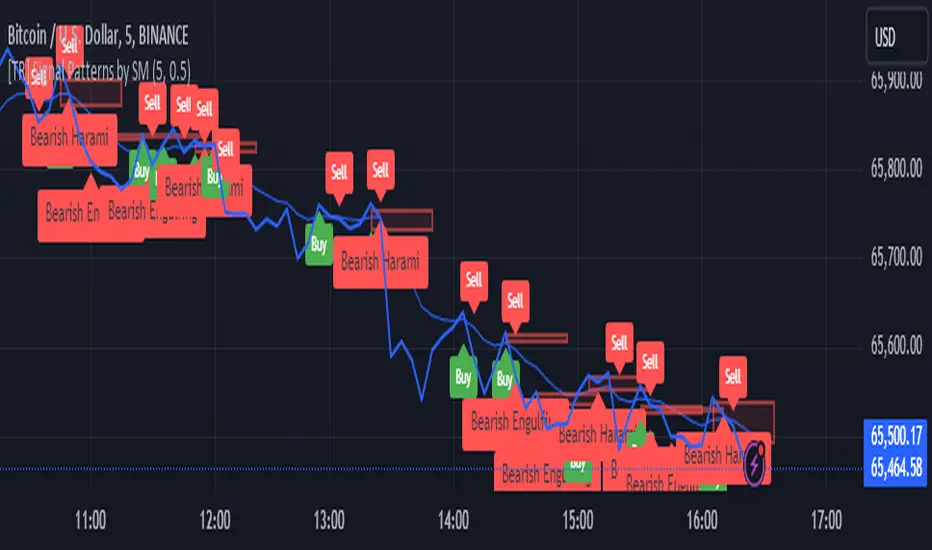
[TR] Engulf Patterns by SM
Engulf Pattern by SM
Overview:
The " Engulf Pattern by SM" script is designed to identify bullish and bearish engulfing candlestick patterns on TradingView charts. Engulfing patterns are significant in technical analysis as they often indicate potential reversals in market trends.
Features:
- Bullish Engulfing Pattern Detection: The script identifies bullish engulfing patterns, which occur when a larger bullish candle completely engulfs the body of the previous smaller bearish candle.
- Bearish Engulfing Pattern Detection: Similarly, it detects bearish engulfing patterns, where a larger bearish candle engulfs the body of the preceding smaller bullish candle.
- Body Size Filtering: The script includes a feature to filter patterns based on the size of the candle bodies, allowing for more precise marking of significant patterns.
- Visual Markers: The script plots visual markers on the chart to highlight the detected engulfing patterns, making it easy for traders to spot them.
How It Works:
1. Bullish Engulfing Pattern:
- The script checks for a smaller bearish candle followed by a larger bullish candle.
- The body of the bullish candle must completely cover the body of the bearish candle.
- The size of the bullish candle's body must meet a specified threshold to be considered significant.
2. Bearish Engulfing Pattern:
- The script looks for a smaller bullish candle followed by a larger bearish candle.
- The body of the bearish candle must completely engulf the body of the bullish candle.
- The size of the bearish candle's body must meet a specified threshold to be considered significant.
Usage:
- Add the Script: Apply the " Engulf Pattern by SM" script to your TradingView chart.
- Configure Settings: Customize the script settings to suit your trading strategy, including visual marker styles and body size thresholds.
- Monitor Visual Markers: Keep an eye on the visual markers to identify potential trading opportunities based on engulfing patterns.
Disclaimer:
This script is not intended to be used as a direct entry signal. It should be used as a confluence in your overall trading plan. Always conduct your own analysis and consider multiple factors before making any trading decisions.
Feel free to customize this writeup further to match your specific needs! If you have any other requests or need additional details, just let me know.
Three Anchored Moving Averages (VWAP / SMA / EMA)
This indicator allows users to anchor three types of moving averages (Simple Moving Average (SMA), Exponential Moving Average (EMA), and Volume Weighted Average Price (VWAP)) to specific points in time (anchor points)
Key Features:
Select from three Moving Average Types:
Simple Moving Average (SMA): Averages the closing prices over a specified period.
Exponential Moving Average (EMA): Gives more weight to recent prices, making it more responsive to new information.
Volume Weighted Average Price (VWAP): Averages the price weighted by volume, useful for understanding the average price at which the asset has traded over a period.
Up to Three Anchor Points:
Users can set up to three different anchor points to calculate the moving averages from specific dates and times. This allows for analysis of price action starting from significant points or specific events. For example, you can anchor to the low and high of a move to identify key levels or to points where the price takes off from a previous anchored MA.
Customisable Sentiment Options:
Each anchor point can be associated with a sentiment input (Auto, Bull, Bear, None), which influences if the MAs are displayed as lines or zones/bands:
Auto: Automatically determines the sentiment based on whether anchor points are on pivot highs and lows. If anchored to a pivot high, the system will assume a bearish sentiment and display a red band or zone between the MA OHLC4 and High. Anchoring to a pivot low will display a green band (OHLC4 - Low).
Bull: Forces a bullish sentiment (Green Band - OHLC4 to Low)
Bear: Forces a bearish sentiment (Red Band - OHLC4 to High)
None: Ignores sentiment and displays a single line (OHLC4)
Chart Matching:
The indicator includes an option to display the moving averages only if the chart symbol matches a specified ticker. This feature ensures that the indicator is relevant to the specific asset being analysed.
How to Use the Indicator:
1. Set Anchor Points: When added to your chart, select three anchor points by point and click. If you only wish to anchor to a single point, click on that point three times and disable the other two in settings once the indicator is applied.
2. Select Moving Average Type: Choose between SMA, EMA, or VWAP using the dropdown menu. EMAs are the most responsive.
3. Enable/Disable Anchor Points: Use the checkboxes to enable or disable each anchor point.
4. Select Sentiment Type: Choose between Auto, Bull, Bear, or None.
5. Chart Matching: Optionally, specify a chart symbol to restrict the indicator's display to that particular asset.
6. Interpret the Plots: The indicator plots the high, mid, and low values of the selected moving average type from each anchor point. The fills between these plots help identify potential support and resistance zones. These should be used as points of interest for pullback reversals or potential continuation if the price breaks through.
Practical Applications:
Trend Analysis: Identify the overall trend direction from specific historical points.
Support and Resistance: Determine key dynamic support and resistance levels based on anchored moving averages.
Event-Based Analysis: Anchor the moving averages to significant events (e.g., earnings releases, economic data) to study their impact on price trends.
Multi Timeframe Analysis: Higher Timeframe Anchors can be used to identify longer term trend analysis. Switching to a lower timeframe for execution triggers at these points wont distort the MA levels as they are anchored to a specific point in time
Intraday or Swing Trading: trend analysis using anchor points can be used for any style of trading (Intraday / Swing / Invest). Use anchored levels as points of interest and wait for hints in price action to try and catch the next move.

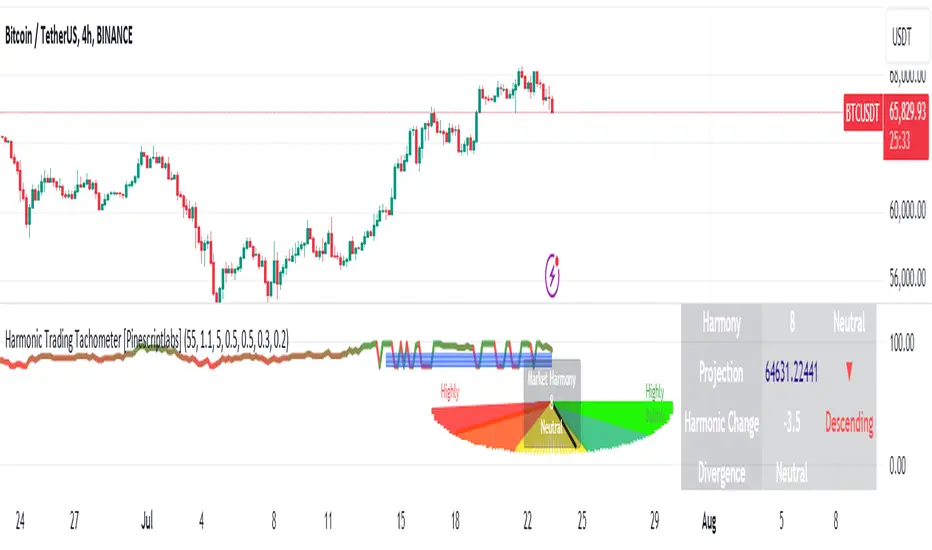
Harmonic Trading Tachometer [Pinescriptlabs]Key Features:
Visual Tachometer:
Represents market harmony through a speedometer on the chart.
The tachometer displays a range of harmony from "Highly Bearish" to "Highly Bullish."
Harmony Calculation:
Harmony Score: Based on ATR (Average True Range) range calculations for short, medium, and long periods. The harmony score is a weighted combination of these scores.
Interpretation: Harmony is translated into an interpretive category that can be "Highly Bearish," "Bearish," "Neutral," "Bullish," or "Highly Bullish."
Price Projection:
Estimates future price movement considering the current trend and the weight of each trend period (short, medium, and long).
Harmonic Change Detection:
Identifies significant changes in market harmony and adjusts sensitivity with predefined thresholds.
Confirmation and Divergence Signals:
Detects bullish or bearish confirmation signals as well as divergences, based on market harmony and price projection.
Additional Visualization:
Includes an optional market pentagram chart to visualize harmony on a broader scale.
Provides detailed information in a table about harmony, price projection, and harmonic changes.
How the Script Works:
Initial Calculations:
Ranges and Scores: Calculates ATR ranges for different periods (short, medium, and long). Then, evaluates the harmony score using the given formula.
Harmony: Obtained through the weighted combination of short, medium, and long-term scores.
Price Projection:
The projection is adjusted based on the difference between the current closing price and the exponential moving averages (EMAs) for different periods, weighted by the defined factors.
How to Use :
Tachometer Interpretation:
Observe the needle's position on the tachometer to assess the current market harmony.
Use the colors and labels to quickly interpret the market's state.
Projection and Changes:
Use the price projection to identify potential support or resistance levels.
Monitor harmonic changes and their strengths to adjust your trading strategies.
Confirmations and Divergences:
Pay attention to confirmation and divergence signals to decide on potential entries or exits.
Customization:
Adjust the indicator parameters, such as base length, harmony factor, change detection period, and trend weights, to fit your trading style and timeframe.
Español:
**Tacómetro Visual:
- Representa la armonía del mercado mediante un velocímetro en el gráfico.
- El tacómetro muestra un rango de armonía desde "Altamente Bajista" hasta "Altamente Alcista."
Cálculo de Armonía:
- Puntuación de Armonía:** Basada en los cálculos del rango ATR (Average True Range) para períodos cortos, medios y largos. La puntuación de armonía es una combinación ponderada de estas puntuaciones.
- Interpretación: La armonía se traduce en una categoría interpretativa que puede ser "Altamente Bajista," "Bajista," "Neutral," "Alcista," o "Altamente Alcista."
**Proyección de Precios:
- Estima el movimiento futuro de los precios considerando la tendencia actual y el peso de cada período de tendencia (corto, medio y largo).
**Detección de Cambios Armonicos:
- Identifica cambios significativos en la armonía del mercado y ajusta la sensibilidad con umbrales predefinidos.
**Señales de Confirmación y Divergencia:
- Detecta señales de confirmación alcista o bajista, así como divergencias, basadas en la armonía del mercado y la proyección de precios.
**Visualización Adicional:**
- Incluye un gráfico opcional de un pentagrama de mercado para visualizar la armonía en una escala más amplia.
- Proporciona información detallada en una tabla sobre la armonía, la proyección de precios y los cambios armónicos.
**Cómo Funciona el Script:**
Cálculos Iniciales:
- **Rangos y Puntuaciones:** Calcula los rangos del ATR para diferentes períodos (corto, medio y largo). Luego, evalúa la puntuación de armonía utilizando la fórmula dada.
- **Armonía:** Se obtiene a través de la combinación ponderada de las puntuaciones de corto, medio y largo plazo.
**Proyección de Precios:**
- La proyección se ajusta según la diferencia entre el precio de cierre actual y las medias móviles exponenciales (EMA) para diferentes períodos, ponderadas por los factores definidos.
**Cómo Usar:**
**Interpretación del Tacómetro:**
- Observa la posición de la aguja en el tacómetro para evaluar la armonía actual del mercado.
- Usa los colores y las etiquetas para interpretar rápidamente el estado del mercado.
**Proyección y Cambios:**
- Usa la proyección de precios para identificar posibles niveles de soporte o resistencia.
- Monitorea los cambios armónicos y sus fortalezas para ajustar tus estrategias de trading.
**Confirmaciones y Divergencias:**
- Presta atención a las señales de confirmación y divergencia para decidir posibles entradas o salidas.
**Personalización:**
- Ajusta los parámetros del indicador, como la longitud base, el factor de armonía, el período de detección de cambios y los pesos de tendencia, para adaptarlo a tu estilo de trading y marco de tiempo.
Dysmen signalsDysmen Signals Indicator
The "Dysmen Signals" indicator is designed to provide clear buy and sell signals based on the crossover of various Exponential Moving Averages (EMAs). This indicator employs a combination of short-term and long-term EMA crossovers to identify potential trading opportunities, while also highlighting significant market movements through specific signals such as the Golden Cross and Death Cross.
Indicator Components
1. Exponential Moving Averages (EMAs)
- EMA 14: A short-term EMA calculated over 14 periods.
- EMA 20: Another short-term EMA calculated over 20 periods.
- EMA 50: A mid-term EMA used as a trend filter.
- EMA 200: A long-term EMA representing the overall trend.
2. Buy and Sell Signals
- Buy Signal: This is triggered when the EMA 14 crosses above the EMA 20 and the closing price is above the EMA 50. This suggests a bullish trend in the market.
- Sell Signal: This is triggered when the EMA 14 crosses below the EMA 20 and the closing price is below the EMA 50. This indicates a bearish trend in the market.
3. Golden Cross and Death Cross
- Golden Cross (GC): Occurs when the EMA 50 crosses above the EMA 200. This is a strong bullish signal indicating a potential long-term upward trend.
- Death Cross (DC): Occurs when the EMA 50 crosses below the EMA 200. This is a strong bearish signal suggesting a potential long-term downward trend.
4. Signal Visualization
- Buy and Sell signals are marked on the chart with green and red triangles respectively. These signals help traders identify potential entry and exit points.
- Golden Cross and Death Cross signals are indicated with yellow and purple diamonds respectively, providing insight into major market trend shifts.
5. Candle Coloring
- Candles are colored green if a buy signal is active and red if a sell signal is active. This visual aid helps in quickly identifying the prevailing market sentiment.
6. EMA 200 Plotting
- The EMA 200 is plotted as a white, semi-thick line on the chart. This line serves as a reference for the overall long-term trend.
Detailed Code Explanation
- EMA Calculations: The script calculates the EMA for 14, 20, 50, and 200 periods using the ta.ema function.
- Crossover Conditions: It uses the ta.crossover and ta.crossunder functions to detect when the EMAs cross each other, triggering buy and sell signals.
- Plotting Signals: The plotshape function is utilized to display BUY and SELL signals as well as Golden Cross and Death Cross signals on the chart.
- Candle Coloring Logic: A variable direction is used to store the current market direction based on the latest signal, which then determines the candle colors using the barcolor function.
- EMA 200 Display: The plot function is used to draw the EMA 200 line on the chart with the specified color and thickness.
By employing this indicator, traders can gain valuable insights into potential market trends and make more informed trading decisions based on the crossover of key EMAs.

Support and resistance levels (Day, Week, Month) + EMAs + SMAs(ENG): This Pine 5 script provides various tools for configuring and displaying different support and resistance levels, as well as moving averages (EMA and SMA) on charts. Using these tools is an essential strategy for determining entry and exit points in trades.
Support and Resistance Levels
Daily, weekly, and monthly support and resistance levels play a key role in analyzing price movements:
Daily levels: Represent prices where a cryptocurrency has tended to bounce within the current trading day.
Weekly levels: Reflect strong prices that hold throughout the week.
Monthly levels: Indicate the most significant levels that can influence price movement over the month.
When trading cryptocurrencies, traders use these levels to make decisions about entering or exiting positions. For example, if a cryptocurrency approaches a weekly resistance level and fails to break through it, this may signal a sell opportunity. If the price reaches a daily support level and starts to bounce up, it may indicate a potential long position.
Market context and trading volumes are also important when analyzing support and resistance levels. High volume near a level can confirm its significance and the likelihood of subsequent price movement. Traders often combine analysis across different time frames to get a more complete picture and improve the accuracy of their trading decisions.
Moving Averages
Moving averages (EMA and SMA) are another important tool in the technical analysis of cryptocurrencies:
EMA (Exponential Moving Average): Gives more weight to recent prices, allowing it to respond more quickly to price changes.
SMA (Simple Moving Average): Equally considers all prices over a given period.
Key types of moving averages used by traders:
EMA 50 and 200: Often used to identify trends. The crossing of the 50-day EMA with the 200-day EMA is called a "golden cross" (buy signal) or a "death cross" (sell signal).
SMA 50, 100, 150, and 200: These periods are often used to determine long-term trends and support/resistance levels. Similar to the EMA, the crossings of these averages can signal potential trend changes.
Settings Groups:
EMA Golden Cross & Death Cross: A setting to display the "golden cross" and "death cross" for the EMA.
EMA 50 & 200: A setting to display the 50-day and 200-day EMA.
Support and Resistance Levels: Includes settings for daily, weekly, and monthly levels.
SMA 50, 100, 150, 200: A setting to display the 50, 100, 150, and 200-day SMA.
SMA Golden Cross & Death Cross: A setting to display the "golden cross" and "death cross" for the SMA.
Components:
Enable/disable the display of support and resistance levels.
Show level labels.
Parameters for adjusting offset, display of EMA and SMA, and their time intervals.
Parameters for configuring EMA and SMA Golden Cross & Death Cross.
EMA Parameters:
Enable/disable the display of 50 and 200-day EMA.
Color and style settings for EMA.
Options to use bar gaps and the "LookAhead" function.
SMA Parameters:
Enable/disable the display of 50, 100, 150, and 200-day SMA.
Color and style settings for SMA.
Options to use bar gaps and the "LookAhead" function.
Effective use of support and resistance levels, as well as moving averages, requires an understanding of technical analysis, discipline, and the ability to adapt the strategy according to changing market conditions.
(RUS) Данный Pine 5 скрипт предоставляет разнообразные инструменты для настройки и отображения различных уровней поддержки и сопротивления, а также скользящих средних (EMA и SMA) на графиках. Использование этих инструментов является важной стратегией для определения точек входа и выхода из сделок.
Уровни поддержки и сопротивления
Дневные, недельные и месячные уровни поддержки и сопротивления играют ключевую роль в анализе движения цен:
Дневные уровни: Представляют собой цены, на которых криптовалюта имела тенденцию отскакивать в течение текущего торгового дня.
Недельные уровни: Отражают сильные цены, которые сохраняются в течение недели.
Месячные уровни: Указывают на наиболее значимые уровни, которые могут влиять на движение цены в течение месяца.
При торговле криптовалютами трейдеры используют эти уровни для принятия решений о входе в позицию или закрытии сделки. Например, если криптовалюта приближается к недельному уровню сопротивления и не удается его преодолеть, это может стать сигналом для продажи. Если цена достигает дневного уровня поддержки и начинает отскакивать вверх, это может указывать на возможность открытия длинной позиции.
Контекст рынка и объемы торговли также важны при анализе уровней поддержки и сопротивления. Высокий объем при приближении к уровню может подтвердить его значимость и вероятность последующего движения цены. Трейдеры часто комбинируют анализ различных временных рамок для получения более полной картины и улучшения точности своих торговых решений.
Скользящие средние
Скользящие средние (EMA и SMA) являются еще одним важным инструментом в техническом анализе криптовалют:
EMA (Exponential Moving Average): Экспоненциальная скользящая средняя, которая придает большее значение последним ценам. Это позволяет более быстро реагировать на изменения в ценах.
SMA (Simple Moving Average): Простая скользящая средняя, которая равномерно учитывает все цены в заданном периоде.
Основные виды скользящих средних, которые используются трейдерами:
EMA 50 и 200: Часто используются для выявления трендов. Пересечение 50-дневной EMA с 200-дневной EMA называется "золотым крестом" (сигнал на покупку) или "крестом смерти" (сигнал на продажу).
SMA 50, 100, 150 и 200: Эти периоды часто используются для определения долгосрочных трендов и уровней поддержки/сопротивления. Аналогично EMA, пересечения этих средних могут сигнализировать о возможных изменениях тренда.
Группы настроек:
EMA Golden Cross & Death Cross: Настройка для отображения "золотого креста" и "креста смерти" для EMA.
EMA 50 & 200: Настройка для отображения 50-дневной и 200-дневной EMA.
Уровни поддержки и сопротивления: Включает настройки для дневных, недельных и месячных уровней.
SMA 50, 100, 150, 200: Настройка для отображения 50, 100, 150 и 200-дневных SMA.
SMA Golden Cross & Death Cross: Настройка для отображения "золотого креста" и "креста смерти" для SMA.
Компоненты:
Включение/отключение отображения уровней поддержки и сопротивления.
Показ ярлыков уровней.
Параметры для настройки смещения, отображения EMA и SMA, а также их временных интервалов.
Параметры для настройки EMA и SMA Golden Cross & Death Cross.
Параметры EMA:
Включение/отключение отображения 50 и 200-дневных EMA.
Настройки цвета и стиля для EMA.
Опции для использования разрыва баров и функции "LookAhead".
Параметры SMA:
Включение/отключение отображения 50, 100, 150 и 200-дневных SMA.
Настройки цвета и стиля для SMA.
Опции для использования разрыва баров и функции "LookAhead".
Эффективное использование уровней поддержки и сопротивления, а также скользящих средних, требует понимания технического анализа, дисциплины и умения адаптировать стратегию в зависимости от изменяющихся условий рынка.

Multi-Timeframe Trend IndicatorMulti-Timeframe Trend Indicator
The “Multi-Timeframe Trend Indicator” is a versatile tool designed to help traders identify trends across multiple timeframes using Exponential Moving Averages (EMAs). This indicator is suitable for both novice and experienced traders. It allows users to customize the lengths of the short and long EMAs, providing a clear visualization of the trend direction (UP, DOWN, SIDE) for various intervals including 1 minute, 5 minutes, 15 minutes, 30 minutes, 1 hour, and 4 hours. The indicator offers extensive customization options, enabling adjustments for table position, colors, and more to suit individual trading preferences.
How the Calculation Works
The Multi-Timeframe Trend Indicator uses EMAs to calculate trends. EMAs give more weight to recent prices, making them responsive to new information. The short EMA, calculated over a shorter period, reacts quickly to price changes, while the long EMA, calculated over a longer period, smooths out fluctuations to show the overall trend.
For each timeframe, the indicator calculates both the short EMA and the long EMA. If the short EMA is above the long EMA, the trend is considered “UP”. If the short EMA is below the long EMA, the trend is “DOWN”. If the absolute difference between the short and long EMAs is within a user-defined threshold, the trend is classified as “SIDE” (sideways).
This calculation is repeated for multiple timeframes: 1 minute, 5 minutes, 15 minutes, 30 minutes, 1 hour, and 4 hours. The results are displayed in a table, providing a comprehensive view of the trend direction across different timeframes.
How the Code Works
Input Parameters: Users can input the lengths of the short and long EMAs and the threshold for identifying sideways trends. These inputs allow for a high degree of customization to match individual trading strategies.
Trend Calculation Function: The trend function calculates the trend direction based on the EMAs. It uses the math.abs function to find the absolute difference between the EMAs and determines if the trend is “UP”, “DOWN”, or “SIDE” based on the threshold.
Requesting Data for Multiple Timeframes: The script uses the request.security function to fetch price data and calculate the EMAs for different timeframes independently of the current chart timeframe. This ensures consistency in trend analysis regardless of the displayed timeframe.
Creating and Updating the Table: A table is created to display the trend directions for each timeframe. The table’s position and appearance can be customized. The trend data for each timeframe is color-coded (green for UP, red for DOWN, gray for SIDE) and displayed in the table.
Customization Options: Users can customize the colors, table position, and EMA lengths through the indicator settings, providing flexibility to adapt the indicator to their trading style.
Disclaimer
This indicator is for informational purposes only and should not be considered financial advice. It does not predict future price movements and does not guarantee accurate trend calculations, as market conditions can vary. Trading involves substantial risk and is not suitable for everyone. Always conduct your own research before making any trading decisions.

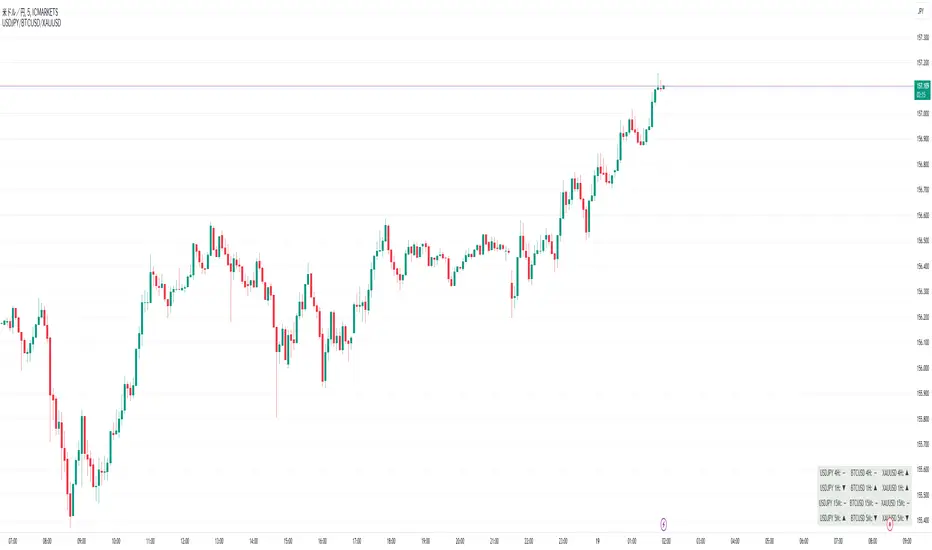
Perfect Order Alert USDJPY/BTCUSD/XAUUSDPerfect Order Alert USDJPY/BTCUSD/XAUUSD 日本語解説は下記
This indicator detects the perfect order of three moving averages and displays on the Panel in an easy-to-understand visual manner whether there is an uptrend, downtrend, or non-trend for each time leg.
This indicator detects perfect orders for the three currency pairs USDJPY/BTCUSD/XAUUSD on the 5-minute, 15-minute, 1-hour, and 4-hour time frames, and displays them on the Panel on the chart, with “▲” for up, “▼” for down, and “ー” for non-trend, so that you can quickly determine the trend. The panel is displayed on the chart.
In order to check for perfect orders without missing them, it is also possible to set up alerts that notify you of all the time frames and currency pairs as well.
Functions
Displaying 4H, 1H, 15M, 5M, up (▲), down (▼), other (-), of USDJPY/BTCUSD/XAUUSD on the panel.
*(By default, 20EMA, 75EMA, and 200EMA are hidden.)
Display position setting of the panel (You can choose from upper left, upper top, upper right, lower left, lower bottom, or lower right).
Panel color and text color change function
The moving average line can be hidden by default.
Moving average period change
Moving average color and thickness can be changed.
EMA/SMA switchable
Alert function - One alert can be set for each currency pair and time frame ▲▼, which is very useful.
Perfect Order Alert
You can use it even if you have a free account with only one alert setting.
To use the alert function, go to the Tradingview default alert settings, select “USDJPY/BTCUSD/XAUUSD” for the top item of conditions, and select “Call Alert() function” in the frame just below it!
_* Supplementary explanation: ____________
Please note that due to the limitation of the script, only 3 currency pairs and 4 time frames are displayed with 12 items (Panels for currency pairs other than USDJPY/BTCUSD/XAUUSD are also created, but they are indicators for other scripts, so if you are interested in other currency pairs, please use those. If you are interested in other currency pairs, please use them.)
Please note that we may change the functions or delete the indicator itself without prior notice.
Translated with DeepL.com (free version)
Reference image of the setting screenReference image of the setting screen
設定画面参考画像
3本の移動平均線のパーフェクトオーダーを検知し、時間足ごとに上昇トレンドか下降トレンドかノントレンドかを視覚的にわかりやすくPanelに表示するインジゲーターです。
このインジゲーターは、USDJPY/BTCUSD/XAUUSDの3通貨ペアの5分足、15分足、1時間足、4時間足のパーフェクトオーダーを検知して、チャートに表示されるPanelに、上昇は「▲」下降は「▼」ノントレンドは「ー」と、すぐに判断できる表示にしてあります。
パーフェクトオーダーを逃さずチェックできるように、それぞれの時間足や通貨ペアも全てを通知してくれるアラート設定が可能なのも特徴です。
機能紹介
・USDJPY/BTCUSD/XAUUSDの4H,1H,15M,5M,の上昇(▲),下降(▼),その他(-),をパネルに表示
※(デフォルトでは20EMA,75EMA,200EMAの3本で非表示にしてあります)
・パネルの表示位置設定(左上、上、右上、左下、下、右下、から選択できます。)
・パネルの色とテキスト色変更機能
・移動平均線表示非表示機能(デフォルトでは表示OFFにしてあります。)
・移動平均線期間変更
・移動平均線色と太さ変更
・EMA/SMA切り替え可能
・アラート機能ー1つのアラート設定で通貨ペアと時間足▲▼一つ一つを細かく教えてくれるので便利。
※パーフェクト オーダーアラート
無料アカウントで1つしかアラート設定できなくても使えます。
アラート機能はTradingviewデフォルトのアラート設定から、条件の一番上の項目を「USDJPY/BTCUSD/XAUUSD」選択、そのすぐ下の枠に「Alert()関数の呼び出し」を選択でOK!
_※ 補足説明____________
・スクリプトの制限の為、3通貨ペアと4つの時間足の12項目で表示させていますのでご了承ください
(USDJPY/BTCUSD/XAUUSD以外の通貨ペアのPanelも作成していますが別スクリプトのインジゲーターになりますので他の通貨ペアも興味がある方はそちらをお使いください)
・予告なしで機能の変更やインジゲーター自体の削除等行う事もあるかもなのでご了承ください。
Moving Average Trend Meter [UkutaLabs]█ OVERVIEW
The Moving Average Trend Meter is a powerful trading indicator that visualizes current market strength. This indicator uses a series of four EMAs (Exponential Moving Averages) to determine short, medium and long term market strength. Each of the three rows of boxes corresponds to an EMA, with the top being the fast, the middle being the medium and the bottom being the slow. Depending on whether each EMA is above or below the source EMA, its corresponding row will be colored accordingly, with the boxes appearing green if the source is above it or red if it is below.
This indicator also displays when the strength of the market is transitioning between bullish and bearish, indicating that there may be an upcoming reversal.
The purpose of this script is to simplify the trading experience of users by providing an easier way to visualize current market strength using a series of EMAs.
█ USAGE
This indicator provides an easy to understand method of visualizing the current market strength based on the positioning of four EMAs. By default, the period for these EMAs are selected based on key Fibonacci levels, and the period of each one can be customized in the indicator settings.
Depending on whether or not the source EMA is above or below each of the other three EMAs, the boxes of the corresponding rows will be colored to indicate the current strength of the market.
If all three boxes are drawn the same color, a dot of the same color will be drawn above the boxes.
█ SETTINGS
Configuration
• Source EMA: Determines the period of the source EMA.
• Fast EMA: Determines the period of the fast EMA.
• Med EMA: Determines the period of the medium EMA.
• Slow EMA: Determines the period of the slow EMA.
Colors
• Bullish Color: Determines the color of boxes when the source EMA is above the respective EMA.
• Bearish Color: Determines the color of boxes when the source EMA is below the respective EMA.
• Bullish Transition Color: Determines the color of boxes when the current bar closes above the respective EMA while the source is below it.
• Bearish Transition Color: Determines the color of boxes when the current bar closes below the respective EMA while the source is above it.

Heiken Ashi Ribbon [UkutaLabs]█ OVERVIEW
The Heiken Ashi Ribbon is a powerful trading tool that creates a strong ribbon that indicates market strength. This ribbon is created using four moving averages that use Heiken Ashi values (high, low, open and close) as its input values.
The ribbon will also be colored green, red or grey depending on whether or not its direction aligns with current market strength.
█ USAGE
The Heiken Ashi Ribbon is created using a series of four moving averages that uses values from the Heiken Ashi bars as its inputs. The user has the ability to select whether the moving averages are EMAs or SMAs, as well as the ability to control the period of the moving averages.
If the moving average calculated using the Heiken Ashi Open is below the moving average calculated using the Heiken Ashi Close, the ribbon will be colored green, indicating a bullish trend. If the moving average calculated using the Heiken Ashi Open is above the moving average calculated using the Heiken Ashi Open, the ribbon will be colored red, indicating a bearish trend.
This indicator also uses a series of hidden EMAs to determine market strength. If these EMAs do not align with the direction of the Heiken Ashi Ribbon, the Ribbon will instead be colored grey, indicating uncertainty in the market, as well as a possible reversal.
█ SETTINGS
Configuration
• Moving Average Type: Determines whether or not the Heiken Ashi Moving Averages will be drawn as EMAs or SMAs.
• Moving Average Period: Determines the period of the Heiken Ashi Moving Averages.
Moving Average
• Moving Average Input: Determines the input values for the hidden EMAs.

GMMA Toolkit [QuantVue]The GMMA Toolkit is designed to leverage the principles of the Guppy Multiple Moving Average (GMMA). This indicator is equipped with multiple features to help traders identify trends, reversals, and periods of market compression.
The Guppy Multiple Moving Average (GMMA) is a technical analysis tool developed by Australian trader and author Daryl Guppy in the late 1990s.
It utilizes two sets of Exponential Moving Averages (EMAs) to capture both short-term and long-term market trends. The short-term EMAs represent the activity of traders, while the long-term EMAs reflect the behavior of investors.
By analyzing the interaction between these two groups of EMAs, traders can identify the strength and direction of trends, as well as potential reversals.
Due to the nature of GMMA, charts can become cluttered with numerous lines, making analysis challenging.
However, this indicator simplifies visualization by using clouds to represent the short-term and long-term EMA groups, determined by filling the area between the maximum and minimum EMAs in each group.
The GMMA Toolkit goes a step further and includes an oscillator that measures the difference between the average short-term and long-term EMAs, providing a clear visual representation of trend strength and direction.
The farther the oscillator is from the 0 level, the stronger the trend. It is plotted on a separate panel with values above zero indicating bullish conditions and values below zero indicating bearish conditions.
The inclusion of the oscillator in the GMMA Toolkit allows traders to identify earlier buy and sell signals based on the GMMA oscillator crossing the zero line compared to traditional crossover methods.
Lastly, the GMMA Toolkit features compression dots that indicate periods of market consolidation.
By measuring the spread between the maximum and minimum EMAs within both short-term and long-term groups, the indicator identifies when these spreads are significantly narrower than average by comparing the current spread to the average spread over a lookback period.
This visual cue helps traders anticipate potential breakout or breakdown scenarios, enhancing their ability to react to imminent trend changes.
By simplifying the visualization of the Guppy Multiple Moving Averages with clouds, providing earlier buy and sell signals through the oscillator, and highlighting periods of market consolidation with compression dots, this toolkit offers traders insightful tools for navigating market trends and potential reversals.
Give this indicator a BOOST and COMMENT your thoughts below!
We hope you enjoy.
Cheers!
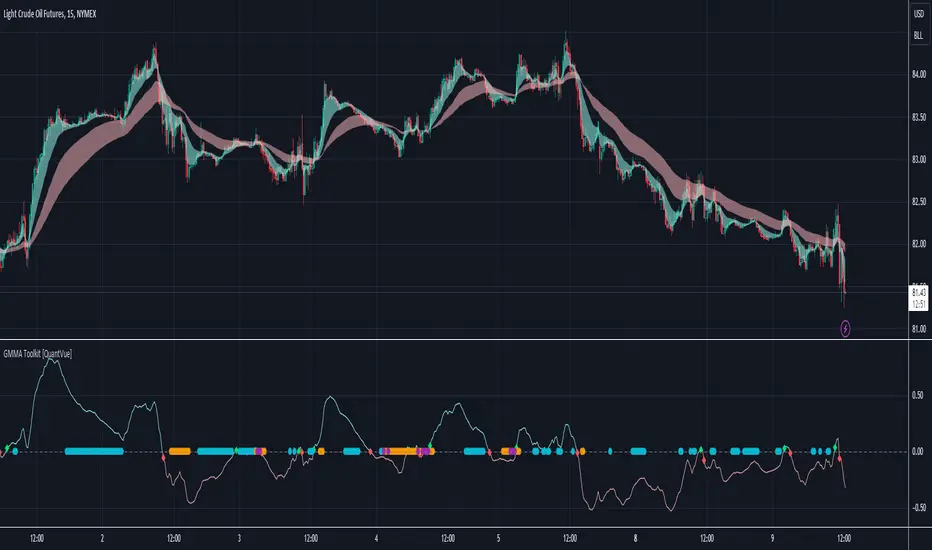
Smoothed Heiken Ashi Candles with Delayed SignalsThis is a trend-following approach that uses a modified version of Heiken Ashi candles with additional smoothing. Here are the key components and features:
1. Heiken Ashi Modification: The strategy starts by calculating Heiken Ashi candles, which are known for better trend visualization. However, it modifies the traditional Heiken Ashi by using Exponential Moving Averages (EMAs) of the open, high, low, and close prices.
2. Double Smoothing: The strategy applies two layers of smoothing. First, it uses EMAs to calculate the Heiken Ashi values. Then, it applies another EMA to the Heiken Ashi open and close prices. This double smoothing aims to reduce noise and provide clearer trend signals.
3. Long-Only Approach: As the name suggests, this strategy only takes long positions. It doesn't short the market during downtrends but instead exits existing long positions when the sell signal is triggered.
4. Entry and Exit Conditions:
- Entry (Buy): When the smoothed Heiken Ashi candle color changes from red to green (indicating a potential start of an uptrend).
- Exit (Sell): When the smoothed Heiken Ashi candle color changes from green to red (indicating a potential end of an uptrend).
5. Position Sizing: The strategy uses a percentage of equity for position sizing, defaulting to 100% of available equity per trade. This should be tailored to each persons unique approach. Responsible trading would use less than 5% for each trade. The starting capital used is a responsible and conservative $1000, reflecting the average trader.
This strategy aims to provide a smooth, trend-following approach that may be particularly useful in markets with clear, sustained trends. However, it may lag in choppy or ranging markets due to its heavy smoothing. As with any strategy, it's important to thoroughly back test and forward test before using it with real capital, and to consider using it in conjunction with other analysis tools and risk management techniques.
Other smoothed Heiken Ashi indicators do not provide buy and sell signals, and only show the change in color to dictate a change in trend. By adding buy and sell signals after the close of the changing candle, alerts can be programmed, which helps this be a more hands off protocol to experiment with. Other smoothed Heiken Ashi indicators do not allow for alarms to be set.
This is a unique HODL strategy which helps identify a change in trend, without the noise of day to day volatility. By switching to a line chart, it removes the candles altogether to avoid even more noise. The goal is to HODL a coin while the color is bullish in an uptrend, but once the indicator gives a sell signal, to sell the holdings back to a stable coin and let the chart ride down. Once the chart gives the next buy signal, use that same capital to buy back into the asset. In essence this removes potential losses, and helps buy back in cheaper, gaining more quantitity fo the asset, and therefore reducing your average initial buy in price.
Most HODL strategies ride the price up, miss selling at the top, then riding the price back down in anticipation that it will go back up to sell. This strategy will not hit the absolute tops, but it will greatly reduce potential losses.
