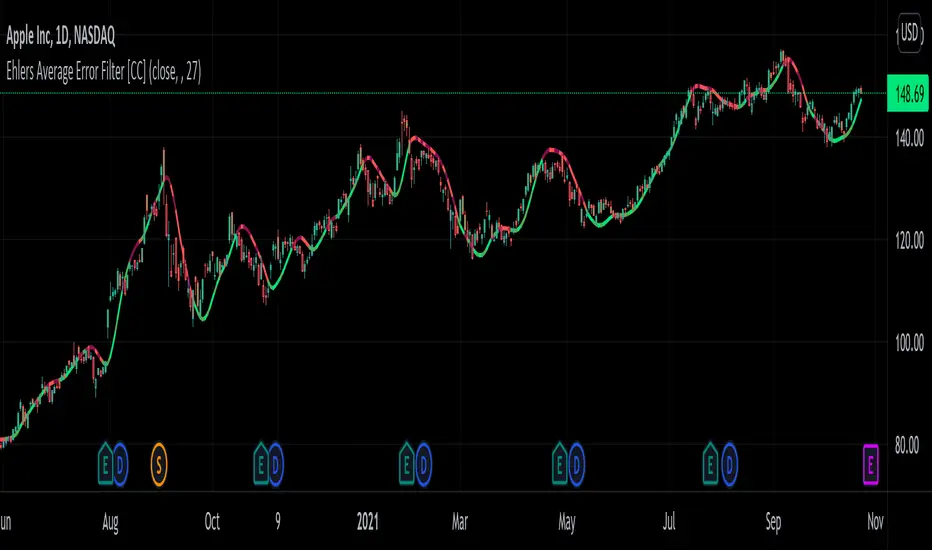
Ehlers Average Error Filter [CC]The Average Error Filter was created by John Ehlers and this is a variation of a Zero Lag Exponential Moving Average that uses a Super Smoother to filter out the noise and then uses a second Super Smoother of the difference between the current price and the filtered data. This works well as a trendline and does give out a few false signals like all indicators inevitably do but most signals do a good job of keeping up with the trend and providing clear entries and exits when the trend changes. I have included strong buy and sell signals in addition to normal ones so like always darker colors are strong signals and lighter colors are normal ones. Buy when the line turns green and sell when it turns red.
Let me know if there are any other scripts you would like to see me publish!
Đường Trung bình trượt Hàm mũ (EMA)
Scalping EMA ADX RSI with Buy/Sell AlertsThis is a study indicator that shows the entries in the strategy seen in one of the youtube channel so it does not belong to me. I can't tell who it is because it's against the House Rules to advertise but you can find out if you look for it on youtube. Default values of oscilators and ema adjusted as suggested. He says he got the best results in 5 min timeframe but i tried to make things as modifiable as possible so you can mess around with the settings and create your own strategy for different timeframes if you'd like. Suggested to use with normal candlestick charts. The blue line below indicates the ADX is above the selected threshold set in the settings named "Trend Ready Limit". You can set alerts for Buy, Sell or Buy/Sell signal together.
The entry strategy itself is pretty straight forward.
The rules for entry are as follows, the script will check all of this on auto and will give you buy or sell signal :
Recommended time frame: 5 min
For Long Entry:
- Check if price above the set EMA (Can disable this rule if you'd like in the settings)
- RSI is in Oversold
- ADX is above set "Trend Ready" threshold (Meaning there is a trend going on)
- Price must approve the trend of previous candles. This is bullish for buy entries and bearish for sell entries.
- Enter with stop loss below last swing low with 1:1 or 1.5:1 take profit ratio.
For Short Entry:
- Check if price below the set EMA (Can disable this rule if you'd like in the settings)
- RSI is in Overbought
- ADX is above set "Trend Ready" threshold (Meaning there is a trend going on)
- Price must approve the trend of previous candles. This is bullish for buy entries and bearish for sell entries.
- Enter with stop loss above last swing high with 1:1 or 1.5:1 take profit ratio.
This is my first indicator. Let me know if you want any updates. I am not sure if i can add everything but i'll try nonetheless.
Changed: Signals will check up to 2 candles before if the RSI is below or above the set value to show signal. This is because sometimes the entry signal is right but the response might be a bit late.

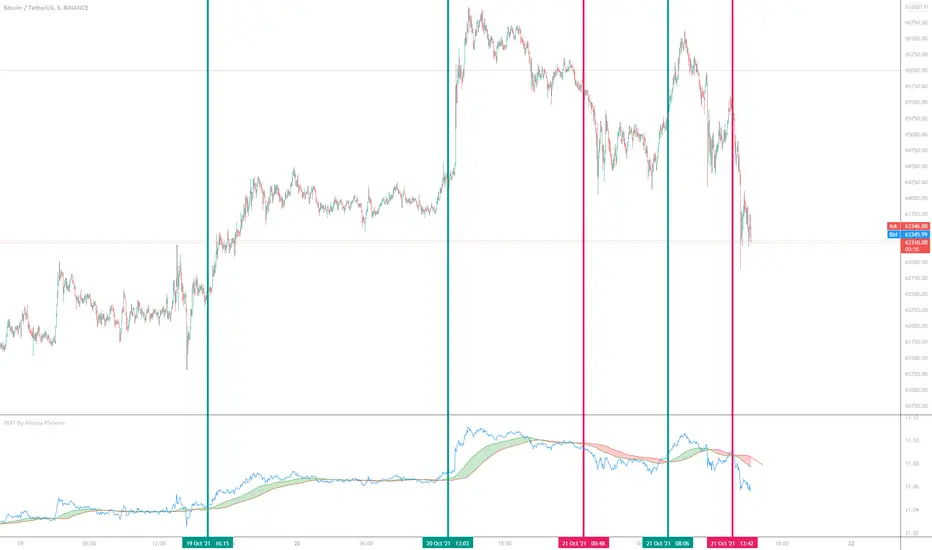
Price Movement Trend By Alireza Phoenix (Logarithmic)hi Traders
This logarithmic indicator shows the price movement trend, which is designed based on logarithmic functions and moving averages.
The Price Movement Trend Display Composed By :
A leading line consisting of the natural logarithm of Running Moving Average with length 60 and Offset 20 , and is displayed in red line.
A signal line consisting of a natural logarithm of an exponential moving average of length 90 , and is displayed in green line.
A price line consisting of the natural logarithm of a simple moving average along 1 whose source is price close , and is displayed in blue line.
A hidden price line consisting of the natural logarithm of a simple moving average along 1 and its source being the highest and lowest average prices , and is displayed in maroon line.
Learning how to get a signal from the price Movement trend indicator:
Moving the signal line and breaking the leading line upwards to form a green cloud is a buy signal.
Moving the signal line and breaking the leading line downwards that forms a red cloud is a sell signal.
Moving the price line and breaking the trend cloud upward , is a buy signal
Moving the price line and breaking the trend cloud downwards , is a sell signal
My instagram id : @pnxf6
ترجمه فارسی :
سلام تریدرها
این اندیکاتور لگاریتمی ، نمایش دهنده روند حرکتی قیمت است ، که بر اساس توابع لگاریتمی و میانگین های متحرک قیمت طراحی شده است
این اندیکاتور تشکیل شده از :
یک خط پیشرو متشکل از لگاریتم طبیعی متحرک وزنی نمایی مورد استفاده درآر اس آی به طول 60 و انحراف 20 است
یک خط سیگنال متشکل از لگاریتم طبیعی میانگین متحرک نمایی با طول 90
یک خط قیمت که متشکل از لگاریتم طبیعی میانگین متحرک ساده در طول 1 که منبع آن بسته شدن قیمت است.
یک خط قیمت مخفی که متشکل از لگاریتم طبیعی میانگین متحرک ساده در طول 1 و منبع آن میانگین بالاترین و پایین ترین قیمت است
یک فضای ابری مابین خط پیشرو و خط سیگنال که که با "نمایش روند حرکت قیمت" مشخص شده و در رنگ های سبز و قرمز قابل مشاهده میباشد.
آموزش گرفتن سیگنال ازاندیکاتور نمایش روند قیمت :
حرکت خط سیگنال و شکستن خط پیشرو رو به بالا که تشکیل ابر سبز رنگ میدهد یک سیگنال خرید میباشد .
حرکت خط سیگنال و شکستن خط پیشرو رو به پایین که تشکیل ابر قرمز رنگ میدهد یک سیگنال فروش میباشد .
حرکت خط قیمت و شکستن ابر روند حرکت قیمت رو به بالا سیگنال خرید میباشد
حرکت خط قیمت و شکستن ابر روند حرکت قیمت رو به پایین سیگنال فروش میباشد.
Ehlers Error Correcting Exponential Moving Average [CC]The Error Correcting Exponential Moving Average was created by John Ehlers and Ric Way (Stocks & Commodities V. 28:11 (30-35)) and this is an excellent moving average that accurately identifies the trend and sticks with the price during trends or choppy periods pretty well. It looks back to find the best gain setting for each day that returns the smallest difference between the current price and the ema based on the gain setting and uses that day's info in it's total calculations and if there is a zero gain for the day then it is just a classic ema. I have included strong buy and sell signals in addition to normal ones so lighter colors are normal and darker colors are strong. Buy when the line turns green and sell when it turns red.
Let me know if there are any other indicators you would like to see me publish!

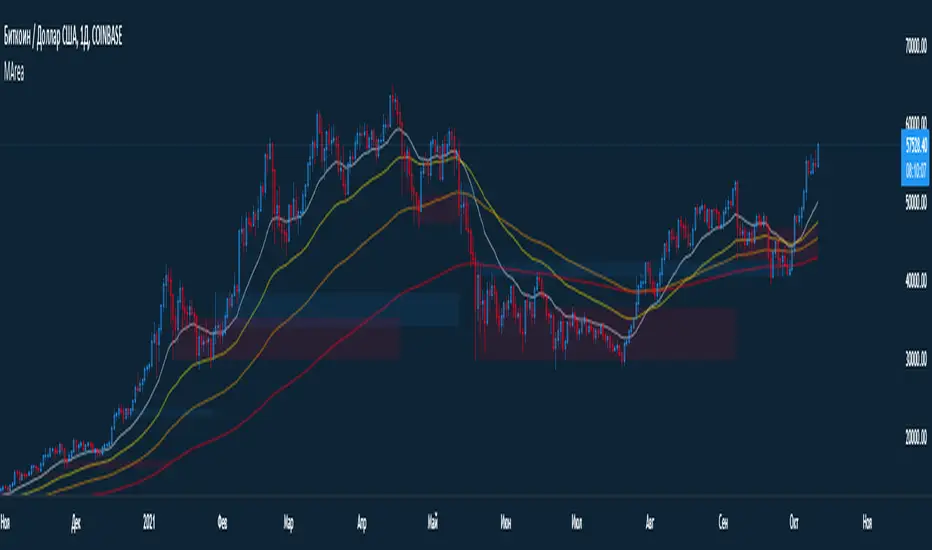
[DS]Bitcoin BTC ETH and others cryptos==DESCRIPTION - English version
The purpose of this script is to show information on graph that can help your decision to buy and sell cryptos.
The script is indicated for Position Trade (Long Term - Holder) and Swing Trade (Medium term).
Position Trade it is recommended to use the Weekly (W) and Daily (D) charts, Swing trade to use the 4H and 2H charts.
It is not advisable to use this indicator with graphic time frame less than 2 hours because the noise levels of information are very high.
An alert function has been inserted in the indicator and to activate this function you will need configure it in the Tradingview.
This alert will indicate the likely points of entry and exit of the asset.
**DESCRIÇÃO - Versão em Português
A proposta deste script é mostrar no gráfico informações que possam auxiliar a sua decisão de compra e venda de cryptos.
Este script é indicado para negociação Position Trade (Longo Prazo - Holders) e Swing Trade (Médio prazo).
Para Position Trade (Holders) é indicado utilizar os gráficos Semanal (W) e Diário (D), para Swing trade utilizar os gráficos 4H e 2H.
Não é aconselhável utilizar este indicador com tempos gráficos menores que 2hs pois os níveis de ruídos nas informação são muito altos.
Foi inserido no indicador uma função de alerta e para ativar esta função, você precisará configurá-la no seu Tradingview.
Este alerta irá indicar os provaveis pontos de entrada e saída do ativo.
====================================================================================================
** English Version
====================================================================================================
█ SETUP applied to Indicator
The setup is based on the average 8, 21 and 56 of the weekly chart (taught on youtube channel: Augusto Backes)
Price above the average 8 on the weekly, indicates that the market is UP trend, below the average 8 on the weekly that the market is DOWN trend
RSI greater than 60% the market is UP trend
RSI greater than 40% and lower 60% the market is in ACCUMULATION
RSI less than 40% the market DOWN trend
The weekly average 8 is represented in GREEN (Upward Trend) and RED (Downward Trend).
The weekly average 21 is represented in LIGHT ORANGE
The weekly average 56 is represented in LIGHT PURPLE
The crossing of weekly averages 8 and 21 is represented with a GREEN (HIGH trend) and RED (LOW trend) cross - this signal is disabled on the graph but you can enable it by clicking on the graph setup
█ FUNCTION USE
(1) Average 8, 21 and 56 on Weekly - show the average 8, 21, 56 weekly on graphic (Average 8 in color red and green, 21 - light orange, 56 light purple)
(2) Crossing of averages 8 and 21 Weekly - is not active but you can activate
(3) Calculation of RSI
(4) barcolor() - mark the candles with the green color (High market) and red color (Dow market)
(5) alertcondition() - you can active this alert on Tadingview
█ BUY AND SELL POINTS - likely points
The indication of the BUY position is shown by a green arrow pointing upwards and the sell position by a red arrow pointing downwards. Buy and sell indications are obtained from the divergence in the market trend.
█ THANK TO
PineCoders for everything they do, all the tools and help they provide, and their involvement in making a better community. All PineCoders, Pine Pros and Pine Wizards, people who share their work and knowledge because of it and helping others, I am so happy and so grateful.
█ NOTE
This indicator is not a buy and sell recommendation, it indicates the most likely buy and sell points. Every purchase and sale decision is your responsibility
*****************************************************************************************************
** Versão em Português
*****************************************************************************************************
█ SETUP aplicado no Indicador
O setup está baseado na média 8, 21, e 56 do gráfico semanal
Preço acima da média 8 no semanal indica que o mercado esta em tendência de ALTA, abaixo da média 8 no semanal que o mercado está em tendência de BAIXA
RSI maior que 60% o mercado está em ALTA
RSI maior que 40% e menor 60% o mercado está em ACUMULAÇÃO
RSI menor que 40% o mercado está em BAIXA
A média 8 semanal está representadas nas cores VERDE (Tendência de Alta) e VERMELHA (Tendência de Baixa).
A média 21 semanal está representada na cor laranja claro
A média 56 semanal está representada na cor roxa claro
O cruzamento das médias 8 e 21 semanal esta representado com uma cruz VERDE (Tendência de ALTA) e VERMELHA (Tendência de BAIXA) - este sinal esta desativado no gráfico mas você pode ativá-lo clicando no setup do gráfico
█ FUNÇÕES UTILIZADAS
(1) Média 8, 21 e 56 no Semanal - mostra a média 8, 21, e 56 no gráfico
(2) Cruzamento das médias 8 e 21 Semanal - não está ativo mas você pode ativá-lo
(3) Cálculo do RSI
(4) barcolor() - marca a vela (Candle) com a cor verde (Mercado em Alta) e a cor vermelha (Mercado em Baixa)
(5) alertcondition () - você pode ativar o alerta no Tradingview
█ PONTOS DE COMPRA E VENDA - prováveis pontos
A indicação da posição de COMPRA é apresentada por uma seta na cor verde apontada para cima e a posição de VENDA por uma seta na cor vermelha apontada para baixo. As indicações de compra e venda são obtidas a partir da divergência na tendência do mercado.
█ OBRIGADO PARA
PineCoders por tudo o que fazem, todas as ferramentas e ajuda que fornecem, e seu envolvimento em fazer uma comunidade melhor. Todos os PineCoders, Pine Pros e Pine Wizards, pessoas que compartilham seu trabalho e conhecimento por causa dele e ajudando os outros, estou muito feliz e muito grato.
█ NOTA
Este indicador não é uma recomendação de compra e venda ele indica os pontos mais prováveis de compra e venda. Toda decisão de compra e venda é de sua responsabilidade

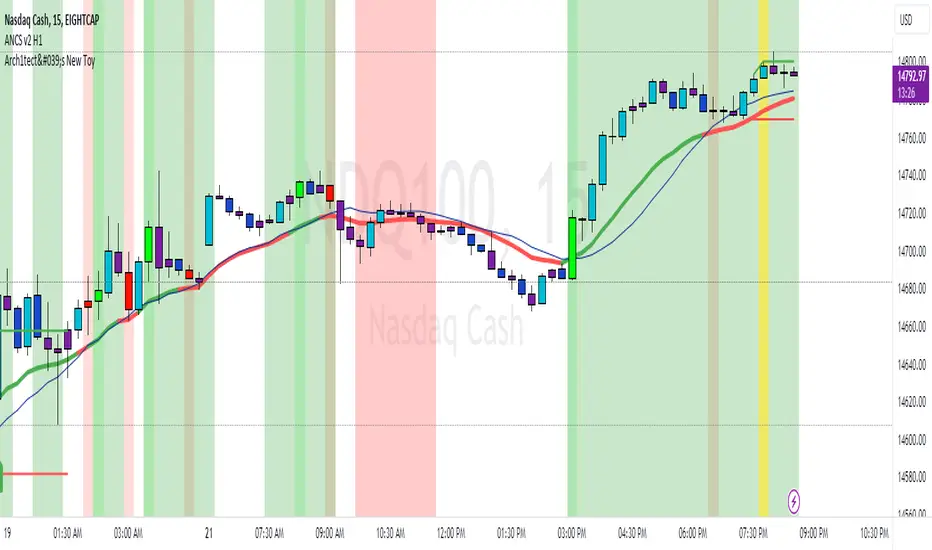
Arch1tect's New ToyDescription:
Arch1tect's New Toy tries to predict market trends by simply utilising 2 moving averages crossovers.
How it works:
Buy signals are triggered when the faster MA crosses over the slower MA from the downside to the upside.
Sell signals are triggered when the faster MA crosses under the slower MA from the upside to the downside.
How to use:
Take buys when buy signal is triggered AND close existing sell position
Take sells when sell signal is triggered AND close existing buy position
Note:
Settings are optimised for XAUUSD on the M1 chart.
Extra:
Alerts are included.
You can toggle between EMA , WMA and SMA to your liking.
Strategy Tester version:
RVC_DecisionPoints By RishabhThe script is a combination of moving averages and previous day low and previous day high.
It can be used for intraday trading and as well as swing trades.
For using intraday I prefer 8 ema and 20 ema to take trades and trail stop losses with 50ema and 200 ema for confirmation.
For swing trades you can always use 50 ema as support to buy on the dip.
The entry is made on the basis of the stock breaks the previous day high or previous day low.
Indicator: SMA/EMA (Multi timeframes)This moving average indicator will plot the SMA or EMA sourced from a different timeframe on the current chart.
Applications:
Say you are viewing an hourly chart but you also want to know the ema20 sourced from a higher timeframe (i.e daily) of the same security. The problem with using most built-in indicators is that the MA values are usually calculated from the current chart, so to do that, you will have to toggle between 1h/1D. This script will eliminate this hassle by plotting out the desired alternative timeframe on the same chart.
Dynamic settings
By default the alternative timeframe is 1D, but this can be customized further:
- 1 week chart -> plots out 1 month MA
- 1 day chart -> plots out 1 week MA
- 1 hour chart -> plots out 1 day MA

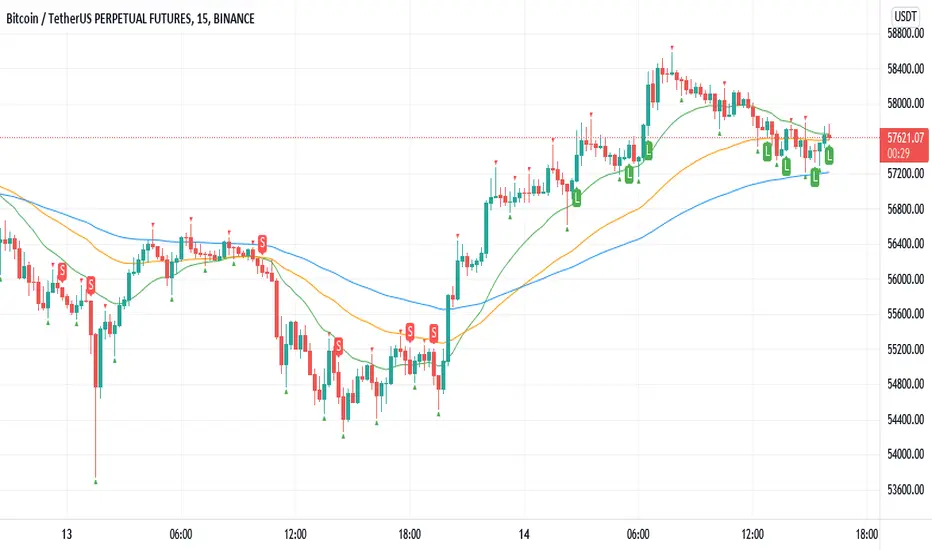
Williams Fractals BUY/SELL signals indicatorThis indicator made with using Williams Fractals, 20 50 100 Moving Averages and Relative Strength Index. You can easily find entry points by using Long (L), Short (S) signals.
This is a 15min scalping strategy for BTC:USDT Perpetual pair. For use different pairs or TFs you may need to change settings.
How to use
****************
When flashing Long (L) or Short (S) signal you should wait until the candle closing for the confirmation.
After that candle closed with the signal, you can enter a trade in next candle opening.
Your SL should be 3.1% from etnry and TP should be 0.5% from entry for best results. (You can use Long Position / Short Position tool in Prediction and Measurement Tools in drawing pannel to calculate this. This settings only for BTC:USDT Perp 15 min TF. For other TFs or Pairs settings may vary. You can easily change these settings and backtest your own.)
After entering a trade you can be ignored next signals until close the trade.
To learn more about this strategy, please try the "Williams Fractals Strategy" I coded. Thank you!
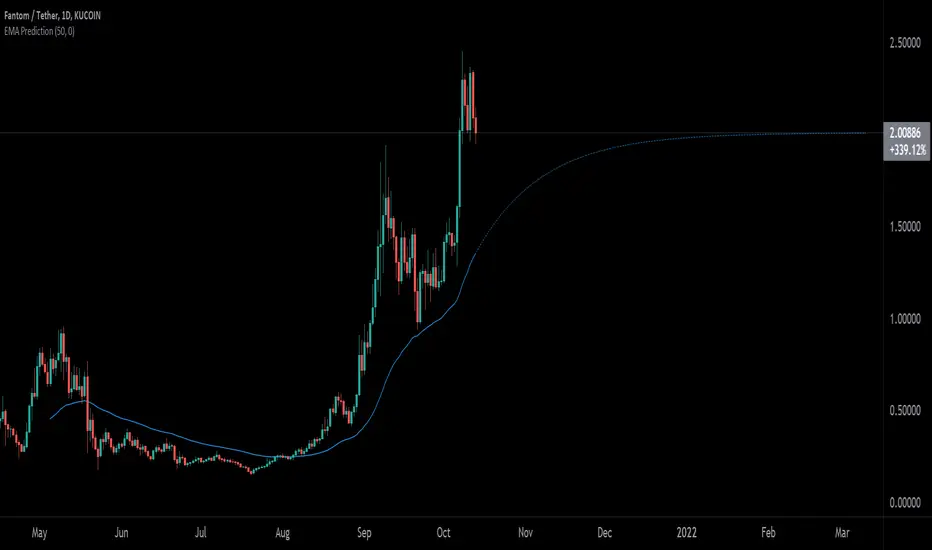
EMA PredictionThis script predicts future EMA values assuming that the price remains as configured (-50% to +50%).
Rolling EMAVWAP with Standard Deviation BandsThis is experimental code trying to implement exponentially decreasing weights over time in a simple VWAP.
Also i applied EMA rules when calculating the Standard Deviation Bands.
The script produces results from 1 candle.
There is an "log space" option to neutralize bands shifts when charting in log space - this gives the correct geometrically equal distances on both sides of the emaVWAP.

MA + VolumeAreaMade a stripped-down version of the script.
Later it will be supplemented with other functions.
In assembly:
-4 EMA
-The bull / bear area from the volume candlestick data.
In the settings, you can change the size of the array and the amount of sampled data in it.
p.s I cut all my scripts for convenient work for you. Stay tuned! Good luck.
Crypto Scannner for Traffic Lights StrategyI allways try to make trading easier. Developing Scripts for a quick backtest and improvement of a strategy, getting alerts for entry and exit a position. Loading data to a spreadsheet is also important and takes time.
In this case finding good parameters in different markets or assets to enter in a position, is a bit exhausting. It is something you have to do everyday, and sometimes in different moments of the day.
So I manage to develop a Screener, to take a quick look at specific hours, and tell if I have a buy or sell condition in an specific asset. Obviously this is not an alert to make a trade instantaneusly, but this help you filter a lot of information in matters of seconds. Then open those specific charts and make a better analisys.
A few weeks ago, I published a scrpipt called "Traffic Lights Strategy", that uses 4 emas to get a buy or a sell condition.
It is easy to understand and use, but if you don´t want to missed some opportunities, and don't want to be look at the screen in all the time looking for them, I have here a simple solution.
This script works plotting 2 labels. The first one plots all the assets in which the condition is true (fastema > medema > slowema > filterema or fastema < medema < slowema < filterema)
The second one plots the assets were the condition is true only if happened up to 5 candles back, so you can be in time to enter a trade.
You can take the script and customize it for a different strategy or assets. I coded like this because I backtested this strategy in this specific assets, and statistics suggest that it might be profitable.
I hope this works for you. In other time I'll try to code a script for the others strategies I published.

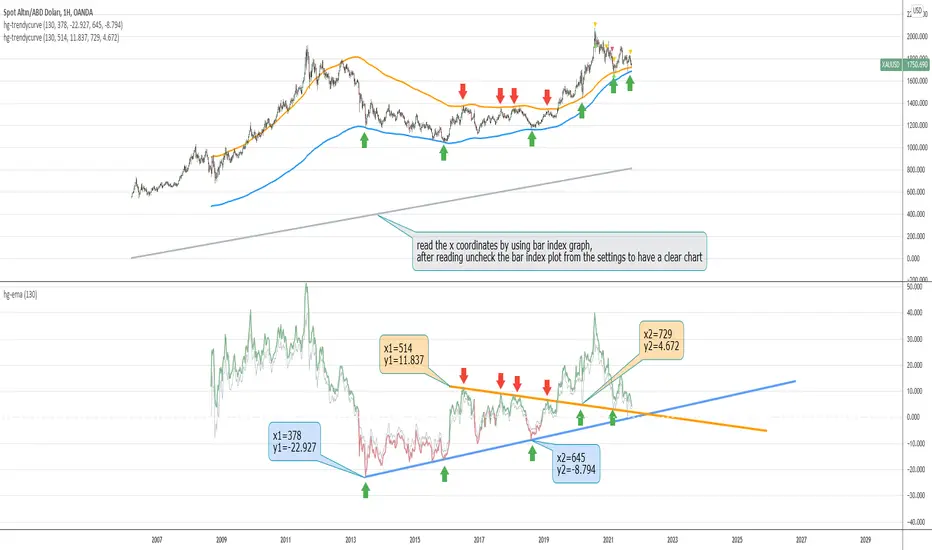
hayatguzel trendycurveENG
If we are wondering how the trendlines drawn on the hayatguzel indicator look like on the graph, we should use this indicator. Trendlines that are linear in Hg (hayatguzel) are actually curved in the graph.
"hayatguzel curve" indicator has capable of plotting horizontal levels but not trendlines in hg indicator. But "hayatguzel trendycurve" indicator has capable of plotting (on the chart) trendlines in hg.
First of all, we start by determining the coordinates from the trendlines drawn in hg. The coordinate of trendline beginings is x1,y1. In the continuation of the trendline, the coordinate of the second point taken from anywhere on the trendline is defined as x2,y2. In order to find the x1 and x2 values, the gray bar index chart must be open. After reading the values, the bar index chart can be turned off in the settings. The x coordinates of the trendlines will be the values in this gray bar index graph. You can read these coordinates from the gray numbers in the hg-trendycurve setting at the top left of the graph. The y values are the y axis values in the hg indicator.
It should be noted that the ema value in the hayatguzel trendycurve indicator must be the same as the ema value in the hg indicator.
Hayatguzel trendycurve indicator is not an indicator that can be used on its own, it should be used together with hayatguzel indicator.
TR
Hayatguzel indikatöründe çizilen trendline'ların grafik üzerine nasıl göründüğünü merak ediyorsak bu indikatörü kullanmalıyız. Hg'de doğrusal olan trendline'lar doğal olarak grafikte eğriseller.
Hayatguzel curve indikatöründe hg'deki sadece yatay seviyeler grafiğe dökülürken bu hayatguzel trendycurve indikatörü ile hg'deki trendline'lar da grafiğe dökülebiliyor.
Öncelikle hg'de çizilen trendline'lardan koordinatları belirlemek ile işe başlıyoruz. Trendline'ların başladığı yerin koordinatı x1,y1'dir. Trendline'ın devamında trendline üzerinde herhangi bir yerden alınan ikinci noktanın koordinatı da x2,y2 olarak tanımlandı. x1 ve x2 değerlerini bulabilmek için gri bar index grafiğinin açık olması gerekmektedir. Değerleri okuduktan sonra bar index grafiği ayarlardan kapatılabilir. Trendline'ların x koordinatları bu gri renkli bar index grafiğindeki değerler olacaktır. Bu koordinatları grafikte sol üstte bulunan hg-trendycurve ayalarındaki gri sayılardan okuyabilirsiniz. y değerleri ise hg indikatöründeki y ekseni değerleridir.
Unutulmamalı ki hayatguzel trendycurve indikatöründeki ema değeri hg indikatöründeki ema değeri ile aynı olmalıdır.
Hayatguzel trendycurve indikatörü kendi başına kullanılabilecek bir indikatör olmayıp hayatguzel indikatörü ile beraber kullanılması gerekmektedir.
7 Moving Averages [Plus]Moving Averages are price based, lagging (or reactive) indicators that display the average price of a security over a set period of time. A Moving Average is a good way to gauge momentum as well as to confirm trends, and define areas of support and resistance. Essentially, Moving Averages smooth out the “noise” when trying to interpret charts. Noise is made up of fluctuations of both price and volume. Because a Moving Average is a lagging indicator and reacts to events that have already happened, it is not used as a predictive indicator but as an interpretive one for confirmations and analysis.
Bollinger Bands (BB) are a widely popular technical analysis instrument created by John Bollinger. The BB consist of a band of three lines which are plotted in relation to security prices. The line in the middle is usually a Simple Moving Average (SMA) set to a period of 20 days (the type of trend line and period can be changed by the trader; however a 20 day moving average is by far the most popular). The SMA then serves as a base for the Upper and Lower Bands which are used as a way to measure volatility by observing the relationship between the Bands and price. Typically the Upper and Lower Bands are set to two standard deviations away from the SMA (The Middle Line); however the number of standard deviations can also be adjusted by the trader.
This script shows 6 moving averages and Bollinger Bands.
Features:
- Standard MA inputs.
- MA type.
- MA period.
- MA source.
- MA resolution (time frame).
- MA Offset.
- Forecasting : forcasted prices are calculated using our MAType and MASource for the MAPeriod.
- Trail: Show only candles not included in the MA calculation.
The color of MA1 depends on the chosen strategy, by default this is the 3EMA strategy. You can also select "Pivot Point Supertrend" or "Ichimoku Trend"
Added "Parabolic Stop and Reverse (PSAR)" . The PSAR is a time and price technical analysis tool primarily used to identify points of potential stops and reverses. In fact, the SAR in Parabolic SAR stands for "Stop and Reverse". The indicator's calculations create a parabola which is located below price during a Bullish Trend and above Price during a Bearish Trend.
Added "Linear Regression Channel" which can be correctly plotted on logarithmic charts. A linear regression channel consists of a median line with 2 parallel lines, above and below it, at the same distance. Those lines can be seen as support and resistance. The median line is calculated based on linear regression of the closing prices but the source can also be set to open, high or low. The height of the channel is based on the deviation of price to the median line. Extrapolating the channel forward can help to provide a bias and to find trading opportunities.

hayatguzel curveENG
When the support resistance study is performed on the hayatguzel indicator, we see that these levels, which are actually horizontal in hayatguzel, are curvilinear when they are plotted on the chart, this is because the hayatguzel indicator uses moving average EMAs.
We can understand the chart more easily by shaping the resulting table in hayatguzel indicator in our minds more easily and seeing these horizontal levels in hayatguzel as curvilinear on the graph.
Let me explain what needs to be done with an example:
The indicator value on top of the yellow box is 13.58 and below of the yellow box of the hayatguzel indicator 5.83. The curves that will occur when we add these values to the hayatguzel curve indicator are shown in green. With the same logic, if we want to see this level, which is the upper blue resistance box on the hayatguzel indicator and coincides with the 67 level, on the graph, we enter 67 for both of the coefficients in the hayatguzel curve indicator. ( Which ema is used in hayatguzel, the same ema value must be entered in hayatguzel curve, ema200 is used in this example )
The result is that the hg curves drawn in green act as support and when the upward movement comes, the hg curve drawn in blue now passes through the 2700s. In other words, we can see that the position is in support and where its target is.
I'd like to show all this in one hayatguzel indicator, but pinescript doesn't make it possible. That's why I had to write this code separately.
TR
Hayatguzel indikatöründe destek direnç çalışması yapıldığında aslında hayatguzel'de yatay olan bu seviyelerin grafiğe atıldığında eğrisel olduğunu görüyoruz, bunun nedeni hayatguzel indikatörünün hareketli ortalama olan ema'ları kullanmasıdır.
Hayatguzel indikatöründeki ortaya çıkan tabloyu kafamızda daha rahat şekillendirmek ve hayatguzel'de yatay olan bu seviyeleri grafik üzerinde eğrisel olarak görerek grafiğe daha çok hakim olabiliriz.
Yapılması gereken şeyi bir örnekle anlatayım:
Hayatguzel indikatöründeki sarı kutunun üstünde indikatör değeri 13.58 ve altında 5.83. Biz bu değerleri hayatguzel curve indikatörüne eklediğimiz zaman oluşacak eğriler yeşil ile gösterildi. Aynı mantıkla hayatguzel indikatöründeki üstteki mavi direnç kutusu olan ve 67 seviyesine denk gelen bu seviyeyi grafikte görmek istiyorsak hayatguzel curve indikatöründeki katsayıların ( coefficient ) ikisine de 67'yi giriyoruz. ( hayatguzel'de hangi ema kullanıldıysa hayatguzel curve'de de aynı ema değeri girilmeli, bu örnekte ema200 kullanıldı )
Burdan ne sonuç çıkıyor peki ?
Çıkan sonuç yeşil ile çizilen hg eğrilerinin destek görevi gördüğü ve yukarı doğru hareket geldiğinde mavi ile çizilen hg eğrisinin şu an 2700 lerden geçtiğidir. Yani hem pozisyonun destekte olduğunu hem de hedefinin neresi olduğunu görebiliyoruz.
Bütün bunları tek bir hayatguzel indikatörünün içinde göstermek isterdim ama pinescript bunu mümkün kılmıyor. O nedenle bu kodu ayrı olarak yazmak zorunda kaldım.
