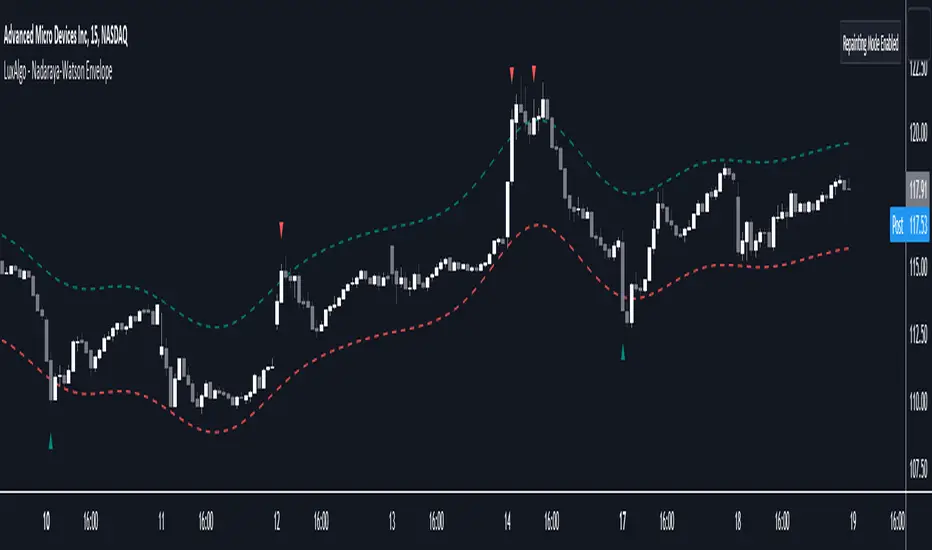
Adaptive Nadaraya-Watson (Non Repainting) [Metrify]To understand this implementation of the Nadaraya-Watson estimator, we have to look at the core equation governing non-parametric regression. This script aren't trying to average prices; we are trying to find the probability density of where price should be relative to its recent history.
1. The Kernel Physics (Bandwidth Modulation)
In standard kernel regression, you have a bandwidth parameter (h). This controls the "smoothness" of the curve. If h is too low, the curve jitters with every tick of noise. If h is too high, it acts like a sluggish SMA.
A static h fails because market volatility is dynamic. When the market explodes (high volatility), a tight bandwidth generates false signals. When the market sleeps, a wide bandwidth misses the micro-trends.
It try solving this by making h a function of the Asset's volatility ratio:
heff=h×max(0.5,min(SMA(ATR20,100)ATR20,2.0))
If the current ATR(20) is double the long-term average (100), the bandwidth doubles. This forces the estimator to "zoom out" during chaos, effectively ignoring noise that would otherwise look like a reversal.
vol_ratio = use_vol ? vol_raw / (vol_base == 0 ? 1 : vol_base) : 1.0
vol_mod = math.max(0.5, math.min(vol_ratio, 2.0))
h_eff = h_val * vol_mod
2. The Gaussian Loop (Endpoint Estimation)
Standard Nadaraya-Watson scripts repaint because they calculate the regression over a full window centered on the bar. To make this usable for live trading, we must calculate the Endpoint Estimate.
We iterate backward from the current bar (i=0) to the lookback limit. For every historical price Xi, we calculate a weight wi based on how far away it is in time (distance).
The weight is derived from the Gaussian Kernel function:
wi=exp(−2heff2i2)
Price data closer to the current bar (i=0) gets a weight near 1.0. Data further away (i=50) decays exponentially toward 0.
for i = 0 to lookback by 1
float dist = float(i)
float w = math.exp(-math.pow(dist, 2) / (2 * math.pow(h_eff, 2)))
num := num + w * src
den := den + w
3. Statistical Deviation (MAE vs. StDev)
Most Bollinger Band-style indicators use Standard Deviation (Root Mean Square). The problem with StDev is that it squares the errors, which heavily penalizes large outliers. In crypto or volatile forex pairs, one wick can blow out the bands for 20 bars.
This one use Mean Absolute Error (MAE) instead.
MAE=N1∑∣Price−y^∣
MAE is linear. It measures the average distance price strays from the kernel estimate without squaring the penalty. This creates "tighter" bands that adhere closer to price action during normal trend behavior but don't expand ridiculously during a flash crash.
Pine Script
float error = math.abs(src - y_hat)
float mae = ta.sma(error, lookback)
We project two sets of bands:
Inner Band (Balanced): The "Noise Zone". Price inside here is considered random walk.
Outer Band (Precision): The "Exhaustion Zone". Price reaching here is statistically unlikely (2.8x MAE).
Input & Visual Summary
Kernel Physics:
h_val: The base smoothness. Lower (e.g., 6) = faster, noisier. Higher (e.g., 10) = slower, smoother.
use_vol: Keep this TRUE. It prevents the bands from being too tight during news events.
Envelope Statistics:
mult_in / mult_out: These are your risk settings. 1.5/2.8 is a standard deviation-like setting suited for MAE.
Chỉ báo Pine Script®