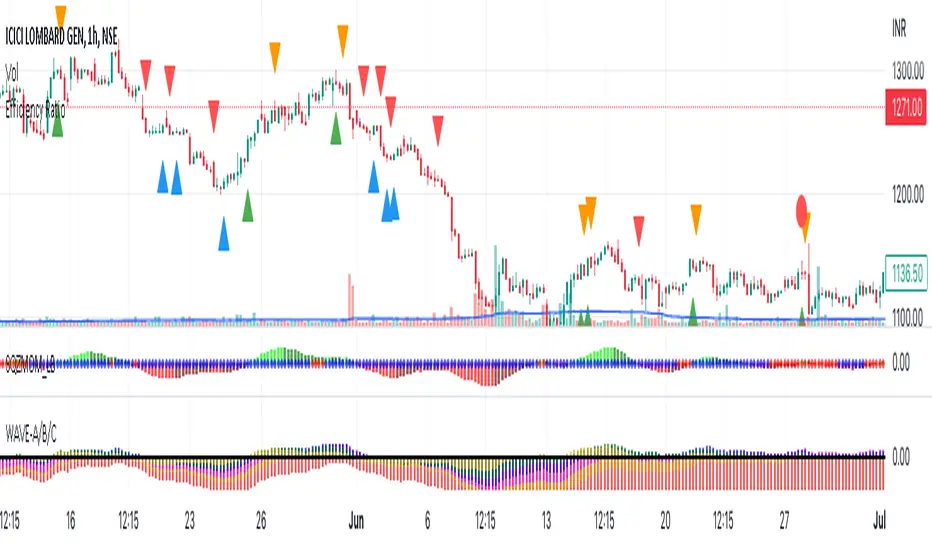
SMKEY_ERCROSS_AND_CLIMATICCANDLEThis scripts shows ER cross 0.6 and -0.6.
Green Arrow below candle shows ER crosses above 0.6 and Orange on shows it crosses below 0.6.
Red Arrow below candle shows ER crosses below -0.6 and Blue on shows it crosses above 0.6.
Green Dot shows bearish climatic candle and red dot shows bullish climatic candle. usally this signs for reversal/pullback.
Buy Entry - Green Triangle
Buy Exit - Orange Triangle or Red Dot
Short Entry - Red Triangle
Short Exit - Blue Triangle or Green Dot
ER
Pips-Stepped, Adaptive-ER DSEMA w/ DSL [Loxx]Pips-Stepped, Adaptive-ER DSEMA w/ DSL is an Efficiency-Ratio-Adaptive, Double-Smoothed EMA with Pips Stepping and Discontinued Signal Lines. This combination reduces noise and improves signal quality.
What is Double Smoothed Exponential Moving Average (DSEMA) ?
The Double Smoothed Exponential Moving Average is a lot less laggy compared to a traditional EMA . It's also considered a leading indicator compared to the EMA , and is best utilized whenever smoothness and speed of reaction to market changes are required.
What is the efficiency ratio?
In statistical terms, the Efficiency Ratio tells us the fractal efficiency of price changes. ER fluctuates between 1 and 0, but these extremes are the exception, not the norm. ER would be 1 if prices moved up 10 consecutive periods or down 10 consecutive periods. ER would be zero if price is unchanged over the 10 periods.
Included:
Bar coloring
Signals
Alerts
EMA and FEMA Signal/ DSL smoothing
Loxx's Expanded Source Types

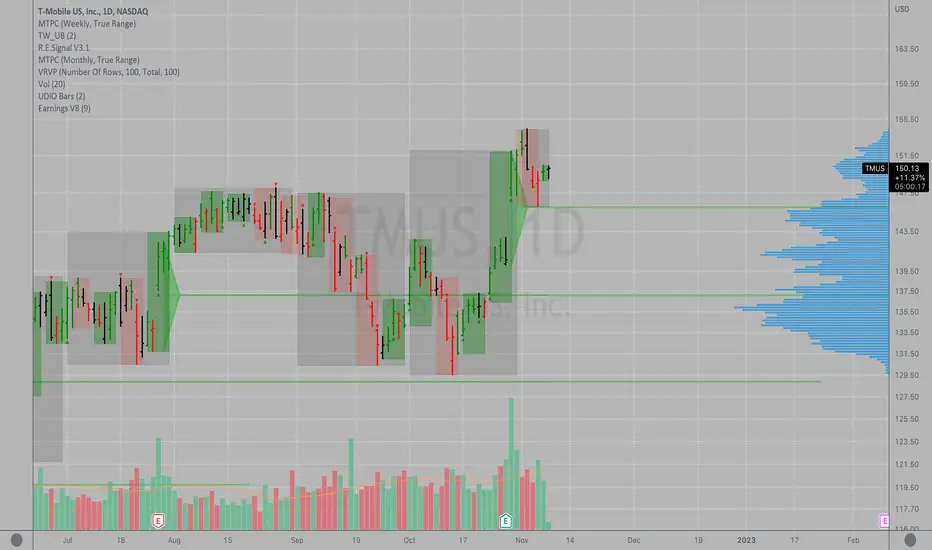
Key Earnings Level by Tim WestKEY EARNINGS LEVELS:
1. It is a composite price of an equity with a quarterly earnings report. The price line attempts to indicate the most important price for the release of earnings of that company. Only companies that have quarterly earnings will be able to have Key Earnings Levels. Indexes, commodities or other futures and crypto markets will not have these lines available.
After the earnings release (aka "ER"), the stock will tend to be supported by the price of the Key Earnings Level (KEL). If the stock is NOT supported at the KEL, then you can assume the stock is under distribution and one could further assume the earnings report was not accepted well by the market and the stock will likely continue to be sold in the future until the KEL no longer stops the advance of the stock.
2. The Earnings Level is designed to be plotted on the DAILY time frame only, and not the weekly or monthly time frames. It is also not designed for the hourly or any time other than daily.
3. Earnings Levels seem to be useful for a long period of time, perhaps up to a year or more based on the observations that I have done since 2012-2014 when I created the concept. I designed the software to allow you to advance the line forward in time by periods of 3 months, 6 months, 9 months and 12 months. The levels could last longer and you could add a "horizontal ray" at each earnings level so that it extends indefinitely into the future.
4. There are many additional uses of KEL's that include a combined KEL for an index, such as the DJIA, SP500 or any other basket of stocks if you combine all of the stocks KEL's together to form a market support/resistance level. I have published this research here at TradingView under the $DJI DJIA symbol.
5. The concept behind this EARNINGS RELEASE is to also see HOW VOLATILE a stock is on the day before, day of and day after the EARNINGS are released as a gauge of uncertainty in the stock. The larger the range of the stock price on an EARNINGS report, the more varied the opinions are of investors and the more uncertain analysts are on the valuation of the company or its future outlook. Volatility is an important concept for risk management in a stock and understanding how volatile a stock is on the 4 most important days of the year for any stock will help any investor understand more deeply about the risk of the stock itself.
6. I comment on stocks using the earnings levels concepts in chat room Key Hidden Levels here at TradingView for many years now. I am eager to hear your comments and success with this tool and others and hope you can pass it along to others to help them be informed too.
Powered Kaufman Adaptive Moving AverageIntroduction
The ability the Kaufman adaptive moving average (KAMA) has to be flat during ranging markets and close to the price during trending markets is what make this moving average one of the most useful in technical analysis. KAMA is calculated by using exponential averaging using the efficiency ratio (ER) as smoothing variable where 1 > ER > 0 . An increasing efficiency ratio indicate a trending market. Based on one of my latest indicator (see Kaufman Adaptive Bands) i propose this modified KAMA that allow to emphasis the abilities of KAMA by powering the efficiency ratio. I also added a new option that allow for even more adaptivity.
The Indicator
The indicator is a simple KAMA of period length that use a powered ER with exponent factor .
When factor = 1 the indicator is a simple KAMA, however when factor > 1 there can be more emphasis on the flattening effect of KAMA.
You can also restrain this effect by using 1 > factor > 0
Note that when the exponent is lower than 1 and greater than 0 you are basically applying a nth square root to the value, for example pow(2,0.5) = sqrt(2) because 1/0.5 = 2, in our case :
pow(ER,factor > 1) < ER and pow(ER,1 > factor > 0) > ER
Self Powered P-KAMA
When the self powered option is checked you are basically powering ER with the reciprocal of ER as exponent, however factor does no longer change anything. This can give interesting results since the exponent depend on the market trend strength.
In orange the self powered KAMA of period length = 50 and in blue a basic powered KAMA with a factor of 3 and a period of length = 50.
Conclusion
Applying basic math to indicators is always fun and easy to do, if you have adaptive moving averages using exponential averaging try powering your smoothing variable in order to see interesting results. I hope you like this indicator. Thanks for reading !

KAMA - Enky v1.22New version with some fixes and the possibility to show the KAMA efficiency ratio ER. Add another istance of the indicator, move it in a new tradingview pane, turn off SHOW KAMA 1 and turn on SHOW ER RATIO
