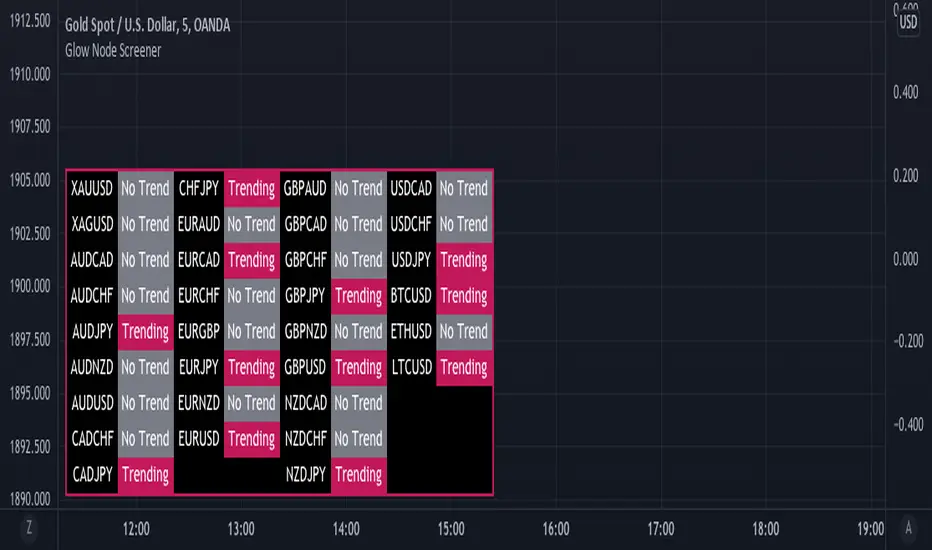
Glow Node ScreenerGlow Node Screener
Our Screener helps you identify whether a pair is in a strong trend for 32 different pairs including crypto.
Using our screener with a strategy will help you weed out bad markets that are ranging at a higher timeframe.
Which will in turn help reduce some of the bad trades you may take due to signals appearing in consolidation.
Very useful to choose which pairs you may like to trade for that day and what to avoid.
Higher Timeframe
The higher timeframe is automatically selected for you on the 15M - 30M - 1H - 4H time frames. You can override this by toggling the override button and selecting your timeframe manually
Pairs:
XAUUSD
XAGUSD
AUDCAD
AUDCHF
AUDJPY
AUDNZD
AUDUSD
CADCHF
CADJPY
CHFJPY
EURAUD
EURCAD
EURCHF
EURGBP
EURJPY
EURNZD
EURUSD
GBPAUD
GBPCAD
GBPCHF
GBPJPY
GBPNZD
GBPUSD
NZDCAD
NZDCHF
NZDJPY
USDCAD
USDCHF
USDJPY
BTCUSD
ETHUSD
LTCUSD
more will be added if requested
Filter
super SSL [ALZ]This script is designed and optimized for MULTI TIME
by Ali Zebardast (ALZ)
1.in part of ssl
Original Version credits to Mihkel00
Actual Version i just set alerts and change the parameters for BTCUSDT 1min Chart.
He designed for daily time. I tried to optimize 1 min time-frame .
And fix the errors with OTT
"This script has a SSL / Baseline (you can choose between the SSL or MA), a secondary SSL for continiuation trades and a third SSL for exit trades.
Alerts added for Baseline entries, SSL2 continuations, Exits.
Baseline has a Keltner Channel setting for "in zone" Gray Candles
Added "Candle Size > 1 ATR" Diamonds from my old script with the criteria of being within Baseline ATR range."
2.in part of Range
two Filter Buy and Sell for 3min
Wait For Bar close
ssl2 :Be under the candle for buy
and The bar color must confirm the order of purchase (Blue)
3.in part of OTT
when candles close over HOTT, means an UPTREND SIGNAL
and to Fuchia when candles begin closing under LOTT line to indicate a DOWNTREND SIGNAL.
FLAT ZONE is highlighted also to have the maximum concentration on sideways market conditions.
There are three quantitative parameters in this indicator:
The first parameter in the OTT indicator set by the two parameters is the period/length.
OTT lines will be much sensitive to trend movements if it is smaller.
And vice versa, will be less sensitive when it is longer.
As the period increases it will become less sensitive to little trends and price actions.
In this way, your choice of period, will be closely related to which of the sort of trends you are interested in.
The OTT percent parameter in OTT is an optimization coefficient. Just like in the period
small values are better at capturing short term fluctuations, while large values
will be more suitable for long-term trends.
The final adjustable quantitative parameter is HIGHEST and LOWEST length which is the source of calculations.
Credits go to:
SSL Hybrid www.tradingview.com
HIGH and LOW OTT : www.tradingview.com
Range Filter www.tradingview.com

Fractal Dimension Index The Fractal Dimension Index is a technical indicator that gauges the amount of volatility currently present in the market.
The theory behind this indicator is that a value of 1.5 suggests the market is acting in a completely random fashion. As the market deviates from 1.5, the opportunity for earning profits is increased in proportion to the amount of deviation.
Keep in mind that the indicator does not show the direction of trends ! Although you can try to test it as a trend-following indicator that gives trend-following signals, that isn't the intended use of the indicator.
The Fractal Dimension Index is red when the market is in a trend. And it is blue when there is high volatility. When the Fractal Dimension Index changes its color from red to blue , it means that a trend is finishing. The market becomes erratic and high in volatility when the Fractal Dimension Index is blue . Usually, these "blue periods" do not go on for a long time, they come before a new trend.
So, look for trend-following signals while the Fractal Dimension Index is blue since this indicates high volatility before a potential trend, and avoid trend-following signals when the Fractal Dimension Index is red since this indicates a ranging/non-trending market or a trend that started long ago.

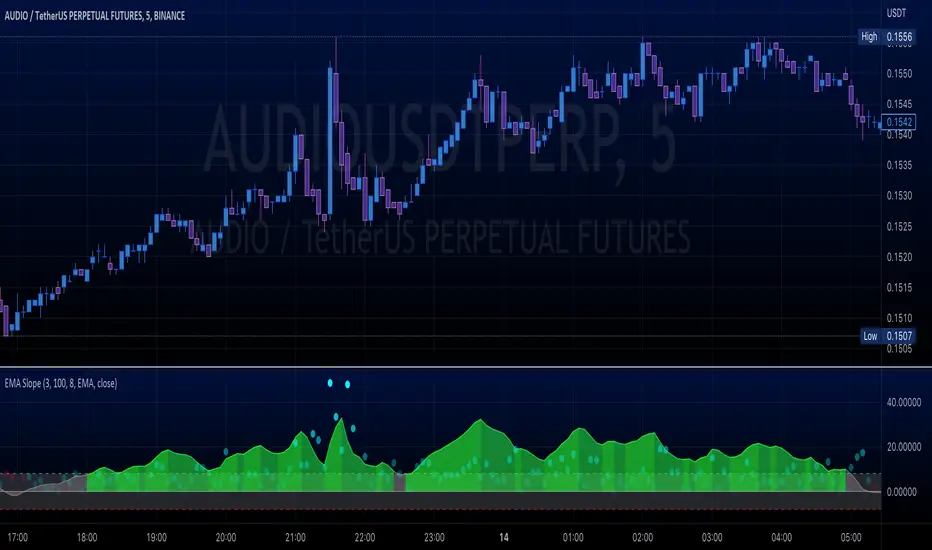
EMA Slope
Just an easy way to monitor trends and avoid fake signals.
// Consolidation periods based on moving average slope.
// Sideways markets are the ultimate challenge to most strategies.
// No trading zones will dismiss some fake signals.
High-pass filterHigh-pass filter | Pine Utilities series, ready to be used in "study-on-study" fashion |
Represents the difference between the filter and the original unfiltered data.
How to use:
1) Add a filter to your chart (in this particular case it was 4-pole Gaussian filter implemented by @everget, ty man);
2) Tap ... on your's filter status line and choose "Add study/strategy on ...", then choose High-pass filter. Alternatively, add high-pass filter directly to your chart, then High-pass filter's settings -> Basis -> choose the filter you've applied during the step 1;
3) Choose the source (op2 and hlcc4 are available as well);
4) See the difference (literally).
Peace TV

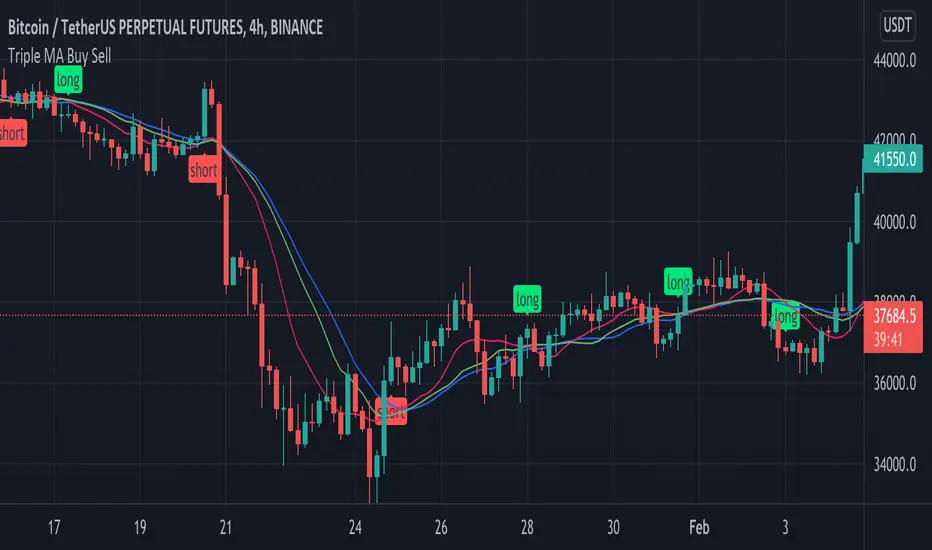
Triple MA Buy SellThis simple script show potentiel trade entry points using 3 MA, can be switch by EMA and SMA type.
Adjust the MA(s) Length depending pairs and timeframe you use.
Buy & Sell labels can be display by input settings.
Action are take by the following rule:
Long signal:
MA3 > MA2 > MA1
Short signal:
MA1> MA2 > MA3
Add some filters is really needed to make this usable.
using my "Flat Detect By Bollinger Bands" indicator can be a debut
Flat Detect By Bollinger BandsThis simple script indicate the potential flat market zones, calculated based on the Bollinger Bands width.
It's showing the Bollinger Bands in red when the market is detected as flat.
You can adjust the Width Threshold with precision on the inputs settings.
Enjoy :)

Filter impulse & step responsesA simple utility tool to examine a filter's step & impulse responses.
By default you can see LSMA's responses.
How to use:
1. Insert your filter to "f(input)" function inside the code;
2. Let this tool help you to make your own filters.
I been seeing people dropping snaps with this stuff but NEVER, NO1 actually dropped the tool itself (4 real?).
Well here is it, for you.
Almost forgot, adjust "Position" parameter to make plots seen. Try to zoom out, and +-100

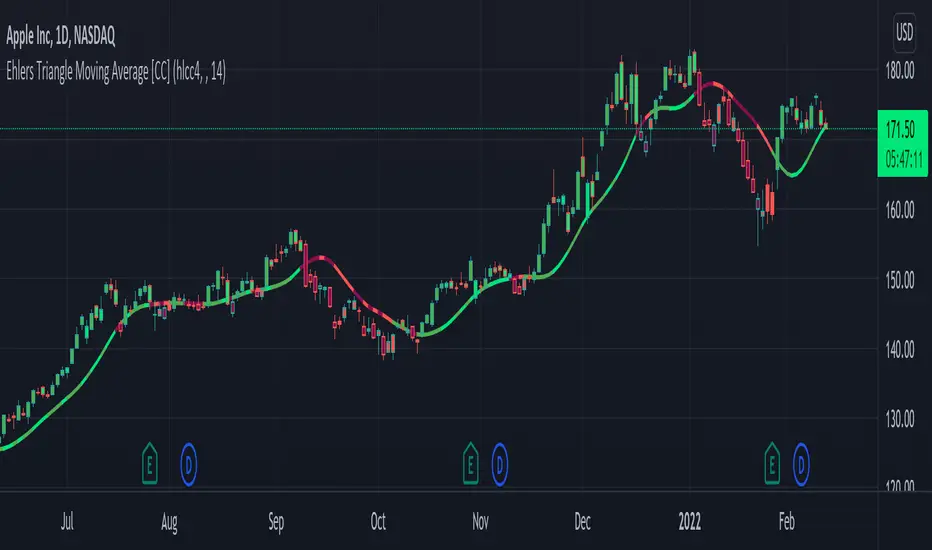
Ehlers Triangle Moving Average [CC]The Triangle Moving Average is the last of custom scripts converting Ehlers Window Indicators to Moving Averages. As you can see this is actually very similar to the Hamming Moving Average and the Hann Moving Average so I would recommend to test this one out with different settings and see what works best for you. As far as the formula calculation, it is a custom weighted moving average that determines how close the price is compared to the middle of the length period and gives a custom weight to that price. For example it will assign heavier weights according to how close the price is to the beginning of the loop (which is the most recent data) and lighter weights, the further the price is away from the recent prices. I have included strong buy and sell signals in addition to normal ones so strong signals are darker in color and normal signals are lighter in color. Buy when the line turns green and sell when it turns red.
Let me know if there are any other indicators or scripts you would like to see me publish!
Ehlers Hamming Moving Average [CC]The Hamming Moving Average is a custom script I made to attempt to create a moving average using Ehler's Hamming Window Indicator . Let me stress that this is extremely experimental considering the original indicator works by creating a sine wave by adjusting the Pedestal value. Change the Pedestal value to anything 5 or higher and you will see what I mean. I think this is a fun experiment so let me know what you think. I have included strong buy and sell signals in addition to normal ones so strong signals are darker in color and normal signals are lighter in color. Buy when the line turns green and sell when it turns red.
Let me know if there are any other indicators or scripts you would like to see me publish!

Ehlers Hann Moving Average [CC]The Hann Moving Average is an original script but a slightly modified version of the Hann Window Filter created by John Ehlers. I am using the same length but changed the default data source to use the new Weighted Close that tv added after I requested it awhile ago so thank you tv! The big strength of this moving average/filter is that it creates an extremely smooth filter with the added benefit of very little lag to smooth ratio. The weakness of this moving average/filter is that it does have a decent amount of lag which means it isn't as useful during choppy periods but does work well for sustained uptrends or downtrends. Feel free to experiment and let me know what settings work better for you. I have included strong buy and sell signals in addition to normal ones so strong signals are darker in color and normal signals are lighter in color. Buy when the line turns green and sell when it turns red.
Let me know if there are any other indicators or scripts you would like to see me publish!

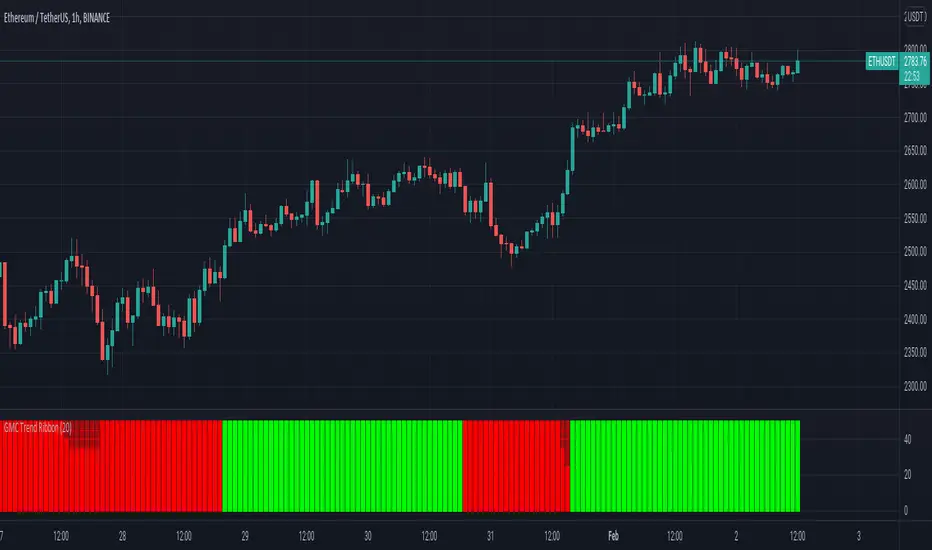
GMC Trend FilterAvoid Fake Signals, and identify the trend.
How it works ?
- it calculates main trend direction by using the length that is user-defined. so you can change it as you wish
- then it calculates trend direction for each 9 lower lengths. if you set the length = 20 then the lengths are 19, 18,...11
- and it checks if the trend directions that came from lower lengths is same or not with main trend direction.
- it changes the trend color of the ribbon.
Ehlers Median Average Adaptive Filter [CC]The Median Average Adaptive Filter was created by John Ehlers and this is another in my current series of undiscovered gems. I'm sure you are all saying but Franklin, Ehlers doesn't have any undiscovered gems but in this case you would be wrong. This was actually an indicator so buried on the internet that I had to use the wayback machine to find the original source code. Ehlers notoriously hates adaptive moving averages which is funny because he has made a decent amount of them. This is a very unique indicator that uses a while loop to adjust the length and I thought it deserved some extra recognition from the TV community. I have included strong buy and sell signals in addition to normal ones so strong signals are darker in color and normal signals are lighter in color. Buy when the line turns green and sell when it turns red.
Let me know if there are any other scripts or indicators you would like to see me publish!

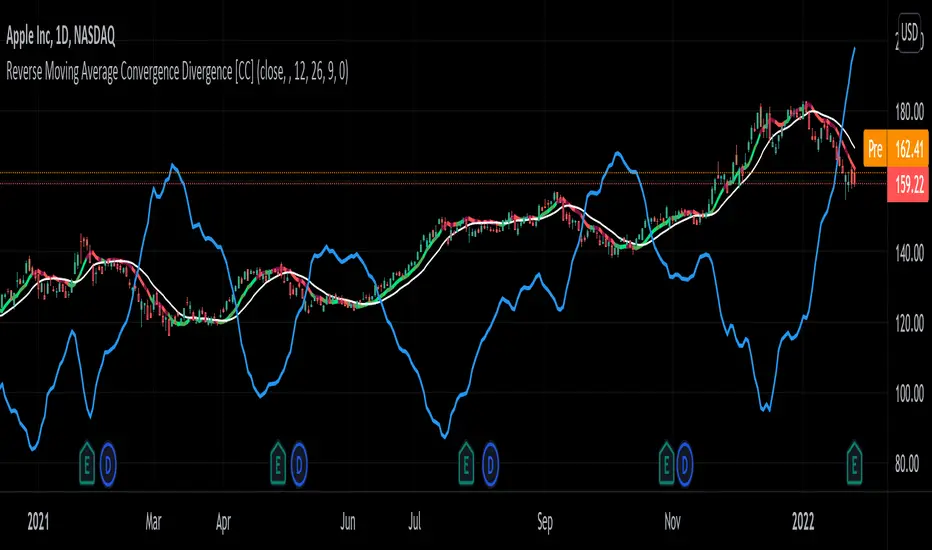
Reverse Moving Average Convergence Divergence [CC]The Reverse Macd was created by Johnny Dough (Stocks and Commodities Jan 2012) and this is another indicator in my ongoing series to find those hidden gems. This indicator works in a few very powerful ways. For example the blue line shows you what the current price would be if the macd was at the macd level that you choose. I set the default to 0 but feel free to change it if you want. This will give you short to medium term info by telling you if it is an uptrend when the price is above the blue line or vice versa. It also creates the reverse macd line and it's signal line by using information from the previous day to decompile the macd and show you the price that it would be at if the macd was at that level. It turns this into a new moving average that closely tracks price movements and with the two competing signals, gives you more than enough info to find the perfect entry and exit points. Like always I have included strong buy and sell signals in addition to normal ones so darker colors are strong signals and lighter colors are normal signals. Buy when the line is green and sell when it is red.
Let me know if there are any other scripts you would like to see me publish!
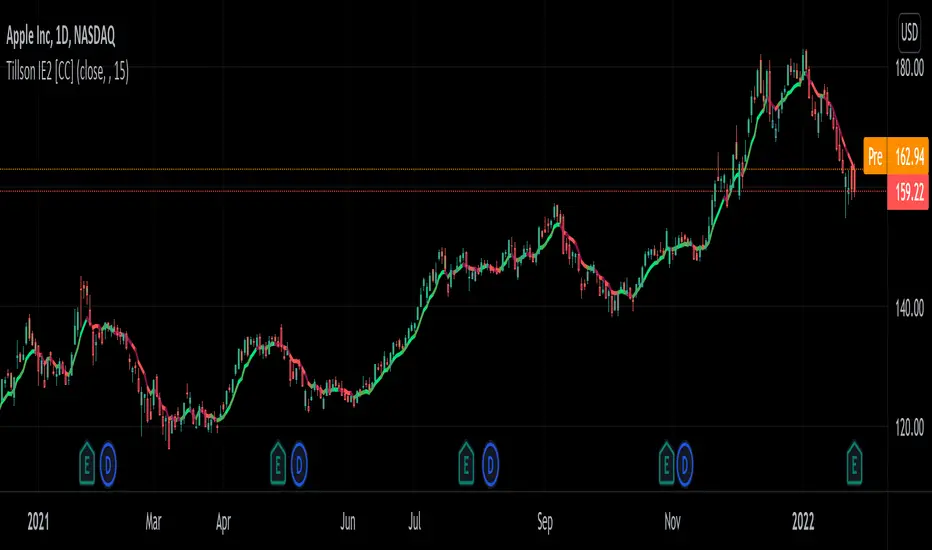
Tillson IE/2 [CC]The IE/2 was created by Tim Tillson (Stocks and Commodities Jan 1998) and this is a practically undiscovered gem because in that same article he goes on to to create the popular T3 moving average and the GDEma but practically no one seemed to notice the IE2 or maybe it is just my imagination. Anyway this indicator name is short for Integral of Linear Regression Slope + Endpoint Moving Average / 2 so you can why it was shortened to IE/2. Like the name implies this takes two variations of smoothing that complement each other and averages them together to in theory get the benefits of each. The EPMA is much noiser but follows the data more closely and the complete opposite for the ILRS so you can see the idea in action. Like all of my indicators I include strong buy and sell signals in addition to normal ones so strong signals are darker in color and normal signals are lighter in color. Buy when the line turns green and sell when it turns red.
Let me know if there are any other indicators or scripts you would like to see me publish!
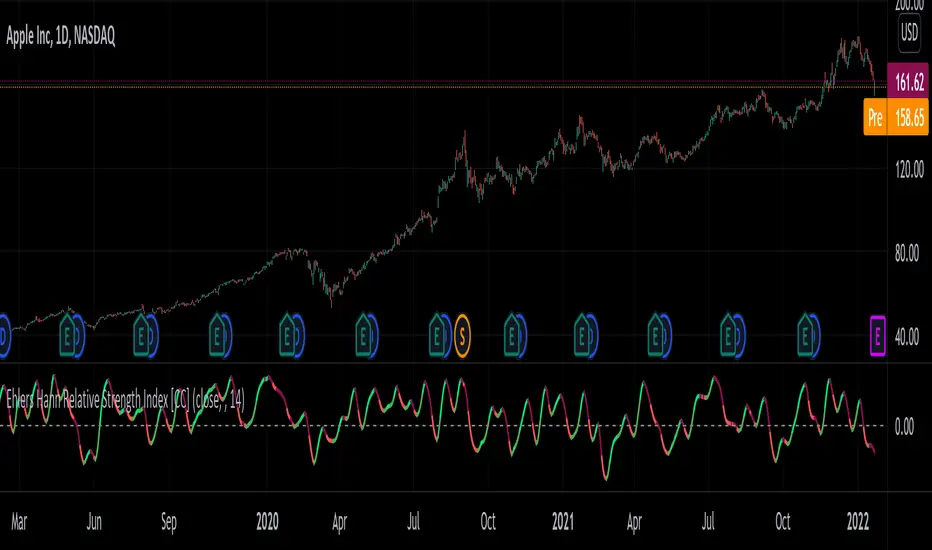
Ehlers Hann Relative Strength Index [CC]The Hann Relative Strength Index was created by John Ehlers (Stocks and Commodities Jan 2022 pgs 26-28) and this indicator builds upon his Hann Window Indicator to create an unique rsi indicator that doesn't rely on overbought or oversold levels to determine a reversal point and also provides a very superior smoothing without any of the lag associated with traditional smoothing. A much more useful RSI than the standard version in my honest opinion. Short term you buy when the line turns green and sell when it turns red. Medium to long term you buy when the indicator rises above the 0 line and sell when it falls below the 0 line. I have included strong buy and sell signals in addition to normal ones so strong signals are darker in color and normal signals are lighter in color.
Let me know if there are any other indicators or scripts you would like to see me publish!
Time Session Filter - Visual Only - @Davi117 Simple visual adjustable time filter to highlight certain times of the day.
For instance if you only trade between 06:00 and 10:00 etc.
Includes Time Zone Selector using GMT
E.g if you live in London then you time zone will be just GMT, else if you live in Paris it would be GMT+1.
Ensure Trading View's time zone selection in the bottom right to the left of the Auto Scale toggle, is also set also set to your time zone, else it will be misaligned.
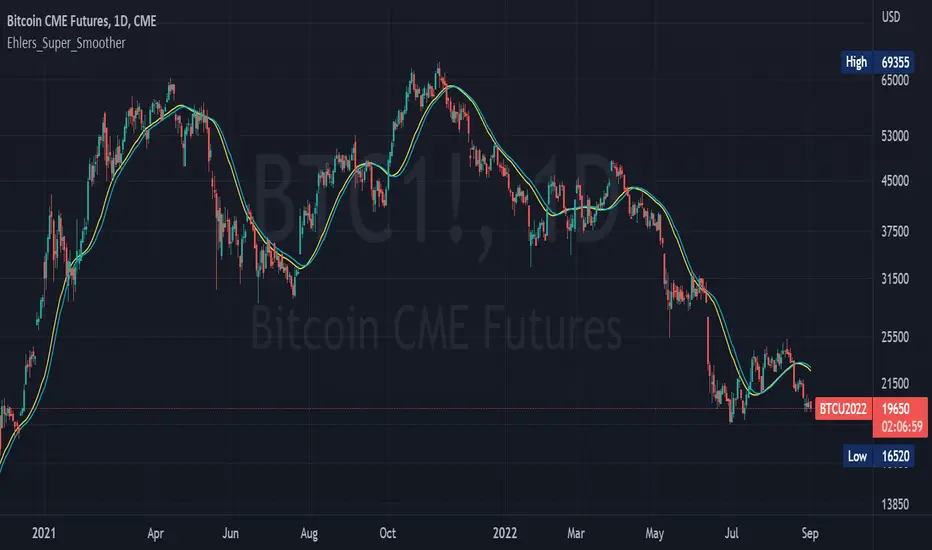
Ehlers_Super_SmootherThe 2 Pole and 3 Pole Super Smoother Filters were developed by John Ehlers and described in "Chapter 13: Super Smother" of his book Cybernetic Analysis for Stocks and Futures .
The 2 Pole Smoother is described as being a better approximation of price, whereas the 3 Pole Smoother has superior smoothing.
Library "Ehlers_Super_Smoother"
Provides the functions to calculate Double and Triple Exponentional Moving Averages (DEMA & TEMA)
twoPole(_source, _length) Calculates 2 Pole Ehlers Super Smoother Filter
Parameters:
_source : -> Open, Close, High, Low, etc ('close' is used if no argument is supplied)
_length : -> Ehlers Super Smoother length
Returns: 2 Pole Ehlers Super Smoothing to an input source at the specified input length
threePole(_source, _length) Calculates 3 Pole Ehlers Super Smoother Filter
Parameters:
_source : -> Open, Close, High, Low, etc ('close' is used if no argument is supplied)
_length : -> Ehlers Super Smoother length
Returns: 3 Pole Ehlers Super Smoothing to an input source at the specified input length
Laguerre FilterThis is the Laguerre Filter by John F. Ehlers. He published this filter design in the article Time Wrap - Without Space Travel.
This study open gamma and weight of each filter for to customize the filter design.
For example, setting gamma to 0.2, 0.7, 0.8,0.8 and weight 1,2,2,1, the curve is a very nice simulation to ALMZ(50),
setting gamma to 0.3, 0.3, 0.8, 0.9 and weight of 1,3,3,1 will produce a curve close to EMA(20),
basically, the Laguerre filter can simulate various type of moving averages.
The beauty of this Filter is it use only one data point and 3 filters output to reproduce various moving average, it is
an innovative approach to develop smoothing lines, and to avoid whipsaws on the price.
Each filter can be plotted for evaluation too.
Data of the first filter allows to input any bar, eg. 0 for current bar, 1 for one previous, for the purpose to evaluate forecasting idea.
Follows Ehlers' paper, this study allows to plot the weighted average line with all filter off.

[DSPrated] Modified EMD for swing tradeModified Ehlers Empirical Mode Decomposition indicator for swing trade based on Butterworth 2nd order IIR filter
Description
This script is inspired by John Ehlers' TECHNICAL PAPERS - Truncating Indicators and Empirical Mode Decomposition. But instead of detecting trend it applies to finding swing regions.
Also here is suggested canonical DSP approach for designing coefficients for Butterworth 2nd order IIR filters - bandpass and lowpass.
Besides, truncated IIR filter with configurable length parameter is used. It worth mentioning, that although truncated filter is more robust than original IIR, it losses specified properties (bandpass) the more, the less is length parameter.
Butterworth Bandpass Infinite Impulse Response (IIR) Filter
This is the 2nd order Butterworth Bandpass Infinite Impulse Response (IIR) Filter based on the transform from the 1st order lowpass
Based on the example 8.8 on p476 from book Digital Signal Processing: A Practical Approach 2nd Edition by Emmanuel C. Ifeachor (Author), Barrie W. Jervis (Author)
It differs from Ehlers BandPass Filter only in the way you initialize input parameters. Here you can define cutoff periods of region of interest. For example on a timeframe, where one bar equals 1 hour you can define periods 18 and 22, which mean you'll see the swing intensity of price movement components within specified range.
Parameters
Source
Period 1 - cutoff period of bandpass begining
Period 2 - cutoff period of the end of bandpass
length - IIR truncation length
Concept of usage
Within specified bandpass this indicator eliminates the Trend line according to Ehlers EMD. The bandpass periods is recommended to choose accordingly to personal comfortable trading style and timeframe.
The trendline painted with 3 colors depending of the next modes:
up tend - green
cycling - black
downtrend - red
So the buy signal is generated when trend line in cycling mode and filtered component reaches it local minimum.
And the sell signal is generated when trend line in cycling mode and filtered component reaches it local maximum.
Secure long and short zones marked with color.
---
// TO DO
// - compare truncated and full version using signal generators
// - apply zero lag filter modification fordetectig ternd and swing peroids
// - implement strategy scripts
// - implement somewhat "true" EMD with sevral IMFs(intrinsic mode function)
// - better description?
// - parameter optimization
---
Please, feel free to report any issues and improvement suggestions.

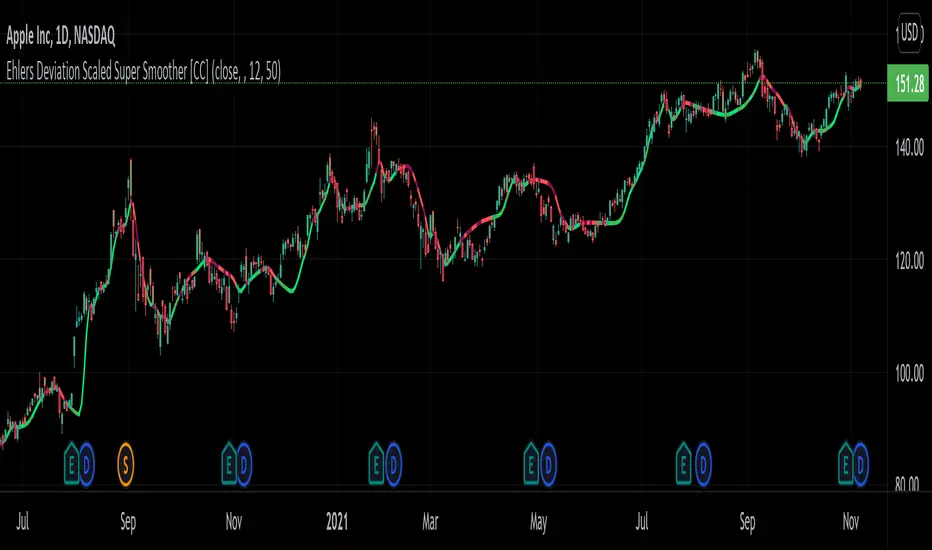
Ehlers Deviation Scaled Super Smoother [CC]The Deviation Scaled Super Smoother was created by John Ehlers and this is an excellent moving average that changes direction very quickly and can keep up with the current underlying trend. This indicator works by applying a Hann Windowed Moving Average to the stock's momentum and scaling that by the Root Mean Square and then using that value in the input for a Super Smoother . I have included strong buy and sell signals in addition to normal ones so lighter colors are normal signals and darker colors are strong ones. Buy when the line turns green and sell when it turns red.
Let me know if there are any other scripts you would like to see me publish!
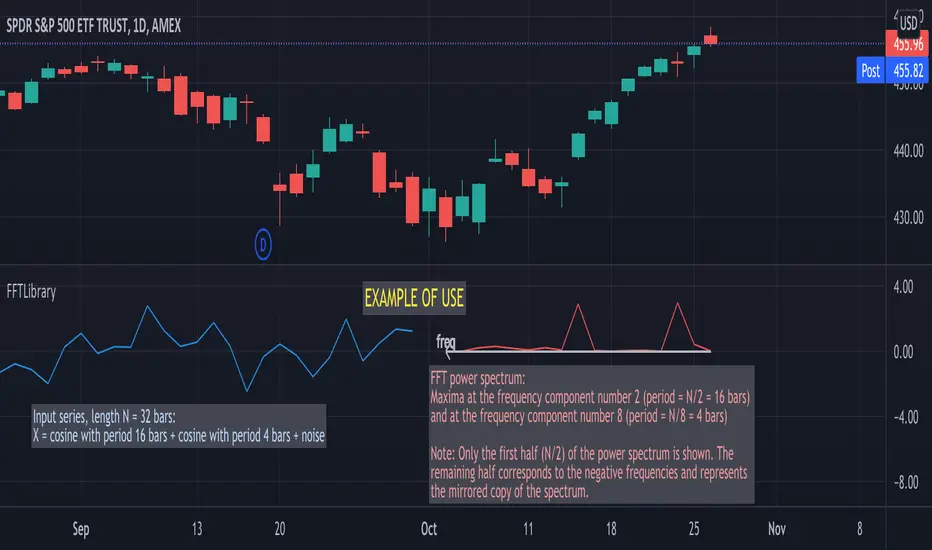
FFTLibraryLibrary "FFTLibrary" contains a function for performing Fast Fourier Transform (FFT) along with a few helper functions. In general, FFT is defined for complex inputs and outputs. The real and imaginary parts of formally complex data are treated as separate arrays (denoted as x and y). For real-valued data, the array of imaginary parts should be filled with zeros.
FFT function
fft(x, y, dir) : Computes the one-dimensional discrete Fourier transform using an in-place complex-to-complex FFT algorithm . Note: The transform also produces a mirror copy of the frequency components, which correspond to the signal's negative frequencies.
Parameters:
x : float array, real part of the data, array size must be a power of 2
y : float array, imaginary part of the data, array size must be the same as x ; for real-valued input, y must be an array of zeros
dir : string, options = , defines the direction of the transform: forward" (time-to-frequency) or inverse (frequency-to-time)
Returns: x, y : tuple (float array, float array), real and imaginary parts of the transformed data (original x and y are changed on output)
Helper functions
fftPower(x, y) : Helper function that computes the power of each frequency component (in other words, Fourier amplitudes squared).
Parameters:
x : float array, real part of the Fourier amplitudes
y : float array, imaginary part of the Fourier amplitudes
Returns: power : float array of the same length as x and y , Fourier amplitudes squared
fftFreq(N) : Helper function that returns the FFT sample frequencies defined in cycles per timeframe unit. For example, if the timeframe is 5m, the frequencies are in cycles/(5 minutes).
Parameters:
N : int, window length (number of points in the transformed dataset)
Returns: freq : float array of N, contains the sample frequencies (with zero at the start).
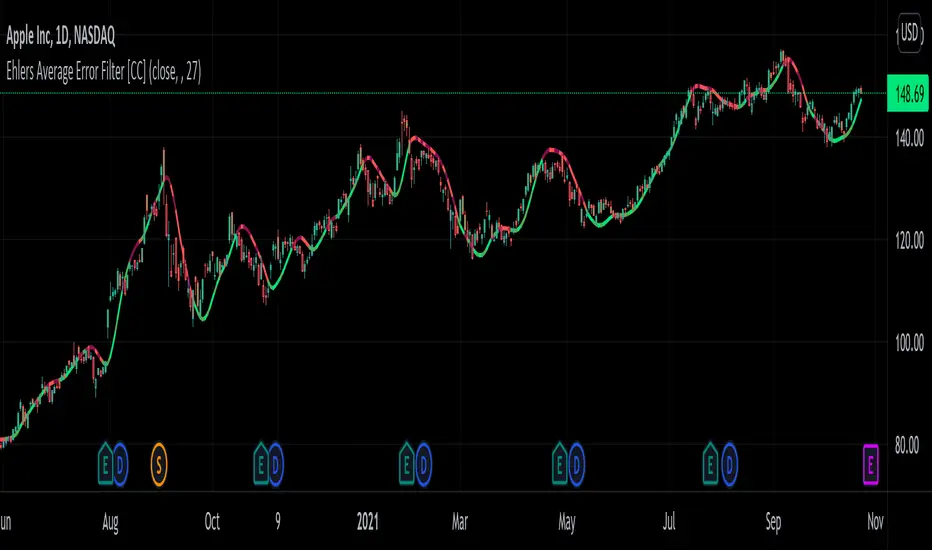
Ehlers Average Error Filter [CC]The Average Error Filter was created by John Ehlers and this is a variation of a Zero Lag Exponential Moving Average that uses a Super Smoother to filter out the noise and then uses a second Super Smoother of the difference between the current price and the filtered data. This works well as a trendline and does give out a few false signals like all indicators inevitably do but most signals do a good job of keeping up with the trend and providing clear entries and exits when the trend changes. I have included strong buy and sell signals in addition to normal ones so like always darker colors are strong signals and lighter colors are normal ones. Buy when the line turns green and sell when it turns red.
Let me know if there are any other scripts you would like to see me publish!