Smart MA Zone Crossover [HMA-EMA]Smart MA Zone Crossover is a trend-following indicator designed to capture early momentum shifts using the crossover between Hull Moving Average (HMA) and Exponential Moving Average (EMA).
The indicator visually highlights trend direction using a dynamic colored zone, making it easy to identify bullish and bearish market phases at a glance.
🔸 Step 1: Moving Average Calculation
HMA (Hull Moving Average) → Faster, smoother, reacts quickly to price
EMA (Exponential Moving Average) → Stable trend reference
Both MA lengths are **fully adjustable** from the settings panel.
🔸 Step 2: Trend Detection
Bullish Trend: HMA is above EMA
Bearish Trend: HMA is below EMA
The area between the two averages is filled with color to visually represent the current trend state.
Step 3: Signal Generation (Non-Repainting)
Signals are generated **only on confirmed crossovers**:
✅ BUY Signal- HMA crosses above EMA
❌ SELL Signal-HMA crosses belowEMA
Signals do **not repaint** and appear only once per crossover.
🔸 Step 4: Visual Customization
Users can enable or disable:
* Moving average lines
* Colored MA zone fill
* Buy/Sell arrows
* Buy/Sell text labels
This allows the indicator to remain **minimal or detailed**, depending on user preference.
🔹 Key Features
✔ Non-repainting logic
✔ Clean crossover-based signals
✔ Customizable HMA & EMA lengths
✔ Optional MA zone fill
✔ Buy/Sell arrows & labels
✔ Works on all timeframes
✔ Beginner-friendly & scalper-ready
🔹 Best Use Cases
* Trend confirmation
* Momentum trading
* Scalping & intraday trading
* Swing trend filtering
For best results, combine with:
* Support & resistance
* Volume
* Higher-timeframe trend
🔹 Disclaimer
This indicator is provided for **educational purposes only**.
It is **not financial advice**. Always backtest and use proper risk management before trading live markets.
Đường trung bình trượt Hull (HMA)

Sultan Weekly Level Manager XAUUSDThis script is a comprehensive "Level Management Utility" designed to help traders efficiently map, monitor, and react to their weekly Support and Resistance plans.
Instead of manually drawing rectangles and lines every week, this tool allows traders to input their specific price levels (Buy Zones, Sell Zones, and Invalidation Levels) into the settings. The script then automatically renders these zones, sets up alert conditions, and provides essential technical context (Trend and Momentum) in a single workspace.
Why this is a "Manager" (Use Case): Many traders execute "Level-to-Level" plans. This script streamlines that workflow by:
Visual Automation: Instantly drawing standardized zones based on user inputs.
Context Integration: Unlike simple drawing tools, this script integrates EMA Trend Filters (50/200 EMA) and RSI Momentum monitoring directly alongside the manual levels. This allows the trader to see if a price level is being approached with high momentum (RSI Overbought/Oversold) or against the major trend (EMA Cross), reducing the risk of blind limit orders.
Dashboard: A mini-dashboard tracks the current status (e.g., "Inside Buy Zone 1") so traders can assess the state of their plan at a glance.
How to Use:
Step 1: Open the settings and input your weekly Buy/Sell zone coordinates (High and Low prices). Note: The default values are placeholders; you must update them based on your analysis.
Step 2: Use the Trend Context (EMAs) to decide if you are trading with the flow or against it.
Step 3: Use the Momentum Context (RSI) to wait for overbought/oversold conditions before entering a zone.
Features:
Customizable Zones: 2 Buy Zones, 1 Sell Zone, 1 Invalidation Line.
Confluence Tools: Integrated 50/200 EMA and RSI readout.
Alerts: Built-in alert conditions trigger when price enters any of your defined zones.
Credits:
EMA and RSI logic are based on standard open-source library calculations.
Zone plotting logic utilizes standard Pine Script drawing functions.

NeoChartLabs Hull Moving AverageOne of our Favorite Indicators - The NeoChart Labs Hull Moving Average
Shout out to r0m3 for creating the original Hull Momentum
This indicator changes green when the Stochastic RSI moves into Bullish territory , white when Neutral, and red when Bearish.
Smoothed out and sped up to be more compatible with the fast paced Crypto market.

Trinity Ultimate 10 MA Ribbons)I got tired of trying to find a multi MA ribbon that could also color change and allow different types, if it exists then I could not find it... So here it is...
The **Trinity Ultimate 10 MA Ribbon** is a highly customizable, professional-grade moving average ribbon that combines extreme flexibility with beautiful visual feedback. Designed for traders who want full control without sacrificing clarity, it allows you to build a ribbon using up to ten completely independent moving averages — each with its own length, type, color, thickness, and visibility setting — while automatically coloring both the lines and the fills according to bullish or bearish conditions.
### Key Features
- Ten fully independent moving averages that can be mixed and matched exactly as you want.
- Each MA has its own selectable type: EMA (default), SMA, WMA, HMA, RMA, VWMA, or ALMA — perfect for combining fast EMAs with a slow HMA or a classic 200-period SMA.
- Every single MA line automatically changes color in real time: bright green when price is above the MA (bullish) and red when price is below the MA (bearish), making trend strength instantly visible across all timeframes.
- Smart, reactive ribbon fills that appear only between consecutive enabled MAs. Turn any MA on or off and the fills instantly adjust — no gaps, no broken bands, no manual rework.
- Nine layered fills with individually adjustable transparency (default is gradually increasing transparency from the fastest to the slowest MA), creating a smooth, depth-like ribbon effect that looks stunning on any chart background.
- Fill color itself is dynamic: green for bullish candles (close > open) and red for bearish candles, or you can customize both colors to any shade you prefer.
- Full control over every visual element: base colors, line thickness (1–10), lengths, and show/hide toggles for each of the ten MAs.
- Clean and lightweight code that compiles instantly in Pine Script v5 and works on all markets and timeframes without lag.
In short, this is the most flexible and visually informative moving-average ribbon available on TradingView today. Whether you want a classic 9-EMA ribbon, a Guppy-style multiple-timeframe setup, a hybrid EMA/HMA mix, or just three or four key levels, the indicator adapts perfectly while always telling you at a glance where the bulls and bears are in control.

Supertrend + MACD + HMAIndicator Description: Supertrend + MACD + HMA
General Summary
It is a composite technical indicator that combines three analysis tools to generate buy and sell signals in institutional trading. It uses confirmation from multiple indicators to increase the precision of market entries.
Components
1. Supertrend (ST)
Function: Identifies the main market trend (bullish or bearish)
Parameters: ATR Length 10, Factor 3.0
Visualization:
Green line = Bullish trend
Red line = Bearish trend
Semi-transparent green/red background that fills the area according to direction
How it works: Uses ATR (Average True Range) to calculate dynamic support and resistance bands
2. MACD (Moving Average Convergence Divergence)
Function: Measures price momentum and direction
Parameters: Fast 18, Slow 144, Signal Smoothing 9
Components:
MACD Line (orange): Difference between two EMAs
Signal Line (purple): EMA of the MACD
Histogram (green/red columns): Difference between MACD and its signal
Green = Positive histogram (bullish momentum)
Red = Negative histogram (bearish momentum)
3. HMA 100 (Hull Moving Average)
Function: Identifies support/resistance level and price direction
Parameters: Length 100
Visualization: Blue thick line
Characteristics:
Less lag than traditional moving averages
Price > HMA = Bullish trend
Price < HMA = Bearish trend
Signal Logic
🟢 BUY SIGNAL
Generated when ANY of these conditions is met:
Total Confluence:
MACD positive (histogram > 0)
Price above HMA 100
Supertrend in Bullish mode
Supertrend Change:
Supertrend changes from Bearish to Bullish
MACD remains positive
Price above HMA
Price Crossover:
Price crosses above HMA (at candle close)
Supertrend is in Bullish mode
MACD is positive
🔴 SELL SIGNAL
Generated when ANY of these conditions is met:
Total Confluence:
MACD negative (histogram < 0)
Price below HMA 100
Supertrend in Bearish mode
Supertrend Change:
Supertrend changes from Bullish to Bearish
MACD remains negative
Price Crossover:
Price crosses below HMA (at candle close)
Supertrend is in Bearish mode
MACD is negative
Important Features
✅ Single Signal Per Type
Once a BUY is generated, no other BUY is generated until a SELL appears
Avoids multiple entries in the same direction
✅ Crossover Detection
The indicator generates signals at candle close when price crosses HMA
Allows capturing quick market moves
✅ Trend Changes
Detects when Supertrend changes direction
Provides early exits from the market
✅ Automatic Alerts
Push notifications when BUY or SELL is generated
Ideal for automated trading

Responsive ADX (RADX)Introducing the new Responsive ADX (RADX), running with a (length = 9) and exactly how it differs from the standard built-in ADX you see on TradingView chart.
This indicator is still a true ADX at its core — it measures trend strength from 0 to 100 and uses the classic +DI and –DI lines to show direction — but it has been carefully "tuned" to react noticeably faster while staying smooth and usable. With the length set to 9, it is one of the most responsive versions you can run without turning into noise.
How it behaves differently from the normal (Wilder) ADX
Normal ADX is lagging, now this version gives you the same trend-strength reading 4–8 bars earlier than the built-in ADX. On a daily chart that can easily be 4–8 calendar days of earlier warning. On a 4-hour chart it’s 16–32 hours earlier. That head-start is the whole point.
The ADX line rises and falls much quicker.
When a new trend actually starts, you will often see this Fast ADX cross above 18–20 while the built-in ADX is still sleeping below 15. Conversely, when a trend dies, this version drops faster, so you’re not left holding a dead trade for an extra week.
The +DI and –DI lines are almost identical to the original, but lightly smoothed with a 5-period EMA (you can turn this off). This makes the DI crossovers cleaner and reduces whipsaws without adding meaningful lag.
The final ADX smoothing uses a lightweight Hull-style technique instead of Wilder’s very slow RMA. This is the main “secret sauce” that removes roughly half the lag while keeping the line smooth and readable.
Values are realistic and tradable.
With length 9 you will typically see:
– 0–18 = flat / chop
– 15–20 = emerging trend (background starts colouring)
– 20–50 = strong trend (most people take this as confirmation)
– above 50–60 only in very powerful moves (same as normal ADX)
The aqua / purple background only appears when both conditions are met: the correct DI is on top and Fast ADX is above your chosen “weak-to-trending” level (default 18).
This prevents the background from flashing on and off in sideways markets — exactly the same logic you liked in the original Trinity ADX, but now much earlier.
In very simple terms
Think of the normal built-in ADX as a diesel truck — reliable but slow to accelerate and slow to stop. Fast Responsive ADX with length 9 is the same truck with a turbocharger — same destination and same load capacity, but it gets up to speed twice as fast and brakes earlier when the road turns.
We would recommend people who switch to this version keep the (length 9–12) because the edge in timing is obvious on the chart.
That’s it — this is a new more responsive version, still-logical ADX!

Hull Moving Averages x 4Default Hull Lengths Included
The defaults are:
HMA 14
HMA 35
HMA 55
HMA 89
These are classic Fibonacci-style progression lengths, which work well for trend structure.

Aarika MultiTimeFrame (AMTF)Hello Traders,
In this indicator, we're using MTF concept. I have kept the same MA type (you have option to choose type like EMA, SMA, HMA, etc from dropdown list) for both the MA length (choose your both lengths wisely to get the maximum output).
You must backtest different lengths, timeframe and MA type that suits your trading style. Given here is the default settings which i think works excellent on BTC. But again i'm not a financial advisor so please check-back and look for this indicator as a trend finder. Trade only if you have sufficiently backtested, watched their live moves and if suits your trading style!
✅ Pros of MTF (Why Traders Use It)
1. Trend clarity: The higher timeframe filters out noise and shows the real direction of the market.
2. Reduced false signals: Lower timeframe indicators often give too many signals.
MTF keeps you trading only in the higher timeframe direction.
3. Better entries: You can align HTF trend, LTF trigger, This results in higher-quality trades.
4. Helps avoid chop: Markets are usually messy on lower charts. HTF trends cut through the noise.
5. Works across all markets: Crypto, forex, stocks — MTF improves signal reliability everywhere.
❌ Cons of MTF (What You Must Be Aware of)
1. Signals come late: Since HTF candles take longer to form, signals may lag.
2. Fewer trade opportunities: Filtering signals reduces frequency. High accuracy but lower quantity.
3. Beginners may find multi-timeframe correlation harder to learn.
4. Wrong TF combinations may give bad results: Not all timeframe pairs work well.
Example: 1D + 5m is too far apart; the trend becomes irrelevant.
Happy trading!
#ShareMarketSaga

paigep.llc - SuperMASuperMA is a multi-layered moving-average and candle-coloring system that combines SMA, EMA, and optional HMA logic to help traders visualize trend shifts, pullbacks, and momentum changes in a clean, structured way.
The script includes multiple modules: trend-based moving averages, pullback signals, exit logic, and an optional HMA cross engine.
📌 Core Features
1. Full SMA + EMA Framework
The indicator plots multiple moving averages (8, 9, 13, 20, 50, 200) using both SMA and EMA calculations. Each line automatically colors bullish or bearish based on its relationship to the 200-period baseline.Users can toggle SMAs and EMAs independently for clearer chart control.
2. Main Trend Entry & Exit Logic (8×200 and 8×20)
Built-in crossover logic detects:
Main Entry: SMA 8 crossing above/below EMA 200
Main Exit: SMA 8 and SMA 20 cross (with an option to choose which SMA is treated as the “fast” leg)
A “first exit only” option allows the script to ignore additional exit signals until a new trend regime begins.
3. Pullback Module (20 SMA Interaction)
Pullback entries and exits occur when price crosses the 20 SMA during existing trend conditions.
This includes:
Pullback entries through the 20 SMA
Pullback exits back across the 20 SMA
Labels and candle colors are available for all pullback events.
4. Optional HMA Cross Module
A separate module allows traders to use two Hull Moving Averages (HMA) with customizable:
Lengths
Independent timeframes
Line colors
Cross-based entries and exits
This module has its own events, labels, and optional candle coloring.
5. Advanced Candle Coloring System
Candle coloring is layered in priority order, based on:
Main trend entries
Main exits
HMA entries
HMA exits
Pullback entries
Pullback exits
Trend-only candles (based on SMA 8 relative to EMA 200)
Users may also independently color wicks and borders.
6. Configurable Alerts (Fully Decoupled from Visuals)
Alerts are available for all major events, including:
Main Entries (8×200)
Main Exits (8×20)
Pullback Entries and Exits
HMA Entries and Exits
Bull or Bear Trend candles
Any colored candle event
Alerts can fire on bar close only or intrabar, depending on user preference.
📌 Use Cases
SuperMA helps traders visualize:
Trend direction using SMA/EMA structure
Momentum shifts through HMA crosses
Pullback zones around the 20 SMA
Early regime transitions based on the 8×200 relationship
Candle-level context through color-coded bars
The indicator works across all markets and timeframes.
⚠️ Note
This tool is for visual and analytical assistance only. It does not guarantee future performance and should be combined with additional analysis and risk management.

paigep.llc - SuperMA
SuperMA is a multi-layered moving-average and candle-coloring system that combines SMA, EMA, and optional HMA logic to help traders visualize trend shifts, pullbacks, and momentum changes in a clean, structured way.
The script includes multiple modules: trend-based moving averages, pullback signals, exit logic, and an optional HMA cross engine.
📌 Core Features
1. Full SMA + EMA Framework
The indicator plots multiple moving averages (8, 9, 13, 20, 50, 200) using both SMA and EMA calculations. Each line automatically colors bullish or bearish based on its relationship to the 200-period baseline. Users can toggle SMAs and EMAs independently for clearer chart control.
2. Main Trend Entry & Exit Logic (8×200 and 8×20)
Built-in crossover logic detects:
Main Entry: SMA 8 crossing above/below EMA 200
Main Exit: SMA 8 and SMA 20 cross (with an option to choose which SMA is treated as the “fast” leg)
A “first exit only” option allows the script to ignore additional exit signals until a new trend regime begins.
3. Pullback Module (20 SMA Interaction)
Pullback entries and exits occur when price crosses the 20 SMA during existing trend conditions.
This includes:
Pullback entries through the 20 SMA
Pullback exits back across the 20 SMA
Labels and candle colors are available for all pullback events.
4. Optional HMA Cross Module
A separate module allows traders to use two Hull Moving Averages (HMA) with customizable:
Lengths
Independent timeframes
Line colors
Cross-based entries and exits
This module has its own events, labels, and optional candle coloring.
5. Advanced Candle Coloring System
Candle coloring is layered in priority order, based on:
Main trend entries
Main exits
HMA entries
HMA exits
Pullback entries
Pullback exits
Trend-only candles (based on SMA 8 relative to EMA 200)
Users may also independently color wicks and borders.
6. Configurable Alerts (Fully Decoupled from Visuals)
Alerts are available for all major events, including:
Main Entries (8×200)
Main Exits (8×20)
Pullback Entries and Exits
HMA Entries and Exits
Bull or Bear Trend candles
Any colored candle event
Alerts can fire on bar close only or intrabar, depending on user preference.
Use Cases
SuperMA helps traders visualize:
Trend direction using SMA/EMA structure
Momentum shifts through HMA crosses
Pullback zones around the 20 SMA
Early regime transitions based on the 8×200 relationship
Candle-level context through color-coded bars
The indicator works across all markets and timeframes.
⚠️ Note
This tool is for visual and analytical assistance only. It does not guarantee future performance and should be combined with additional analysis and risk management.

EMA CrossMoving averages based trend indicator
Plots
Hull Moving average 34
Simple MA 200
Exponential MA 5
Signals on crossing and turn around points.

Hull VWMA Crossover StrategyA simple variation on the Hull Moving Average which reacts faster to high volume events, making it more responsive in those cases than even the standard Hull average -- CREDIT GOES TO Saolof - -- Edited into a strategy with some more options that im going to continue to refine. LMK if theres any features or confluence you want me to add -- cheers!

Dami's HMA Strategy"Dami's HMA Strategy: Dynamic Crossover with Momentum Filter"
Key Points to Include:
Foundation: The strategy is based on the Hull Moving Average (HMA), noted for its speed and reduced lag, making it ideal for identifying trend inflection points early.
Enhanced Logic: Unlike a simple moving average crossover, this strategy incorporates a momentum filter. A signal is only triggered if the HMA crossover coincides with a candle moving in the direction of the new trend (bullish candle for Long, bearish candle for Short). This aims to confirm the impulse and avoid false entries during consolidation periods or 'weak' crossovers.
100% Market Coverage System: It is a continuous reversal system. Every new signal (Long or Short) closes the opposite position, ensuring the trader is always positioned in the direction indicated by the HMA.
Complementary Visualization: It includes the 8-Period High/Low Bands (Dami's Bands) to provide visual context of the recent price range, although they do not affect trading orders.
Adjustment and Optimization: The HMA length (hma_len=9 by default) is the key parameter to optimize based on the specific pair and timeframe. Higher values will generate fewer signals and be slower, while lower values (like the current 9) make it more sensitive.

Buy/Sell Hull Crossover Signals (Fast & Slow)This indicator generates buy and sell signals using fast- and slow-period Hull Moving Averages (HMAs). A bullish signal occurs when the fast HMA crosses above the slow HMA, while a bearish signal triggers when it crosses below. To reduce repainting, you can optionally require confirmation on bar close.
The script includes visual tools such as a color-shifting ribbon between HMAs, optional background shading to show market regime, and lightweight buy/sell labels for quick signal recognition. Alerts are built in so you can automate notifications when crossover conditions occur.
Designed to be simple, responsive, and easy to layer into existing strategies, this indicator helps traders spot momentum shifts and trend transitions with clarity.

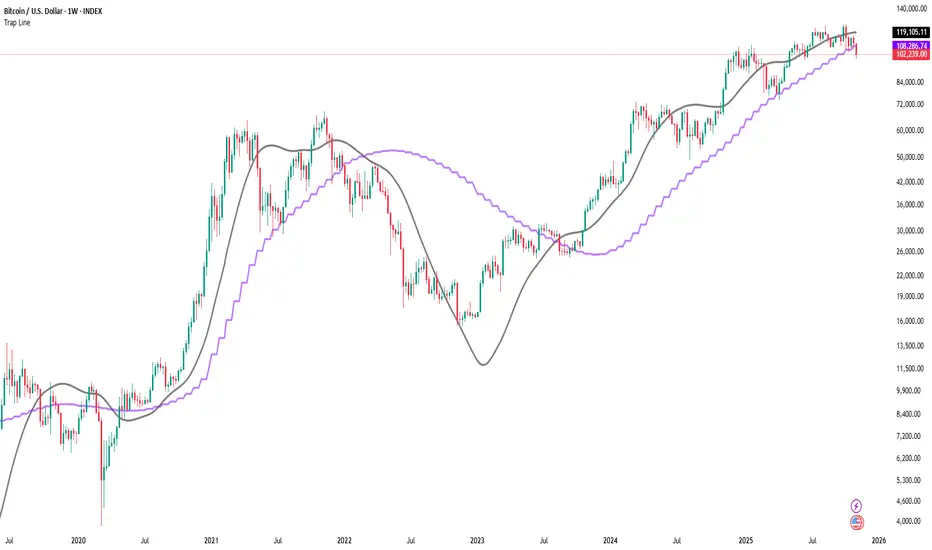
Trap LineOverview
Trap Line is a higher-timeframe trend framework designed to define market regimes using smoothed weekly (1W) and three-week (3W) baselines. Price trading above the line reflects a bullish regime; price below the line reflects a bearish one. The goal is regime discipline—stay aligned with the dominant higher-timeframe direction and avoid late, emotional entries. All parameters are fixed to ensure consistent behavior across symbols.
Core logic (concepts, not full code)
• Computes a Hull-type moving average on 1W and 3W closes (with optional linear-regression pre-filtering) and projects them onto lower timeframes via interpolation.
• Produces a smooth, lag-reduced structural baseline that tracks the weekly trend path.
• Observing price vs. the baseline highlights potential trap zones—temporary breaches that often fail without a confirmed weekly close.
• The 3-Week Trap Line adds a macro confirmation layer and is hidden by default in the Style tab to keep charts clean.
Inputs
• Parameters (length, smoothing type, regression toggle, interpolation mode) are fixed to prevent overfitting and preserve repeatability.
How to read it
• Above the line => bullish regime.
• Below the line => bearish regime.
• A confirmed weekly close through the line suggests a regime transition.
• A weekly close above the line with a green candle supports bullish continuation; a weekly close below the line with a red candle supports bearish continuation.
• Intraweek deviations near the line are often noise and may fade.
Practical use cases
• Weekly bias filter for swing/position frameworks.
• Regime confirmation across related assets or sectors.
• Portfolio overlay: favor long exposure in bullish regimes; reduce risk in bearish regimes.
• Combine with volume or ATR-based tools to assess trend quality.
Best practices
• Wait for the weekly close before declaring regime flips.
• Avoid overreacting to intraweek moves around the baseline.
• Combine with structure analysis (HH/HL vs. LH/LL) and higher-timeframe S/R.
• Use standard time-based candles; avoid interpreting signals on Heikin Ashi, Renko, Kagi, Point & Figure, or Range charts.
Technical notes
• Built on locked higher-timeframe data (1W and 3W).
• Interpolation is used to render HTF structure smoothly on lower charts.
• Non-repainting : values finalize when the higher timeframe closes; lower-TF plotting is interpolated, not forward-looking.
Who it is for
• Traders who want a consistent, rules-based higher-timeframe bias filter.
• Systematic users who prefer fixed-parameter baselines for regime context.
Limitations & disclosures
• Closed-source; educational and analytical use only.
• Not financial advice. Markets involve risk; past performance does not guarantee future results.
Release notes
• Includes the 3-Week Trap Line (3W). It is hidden by default in the Style tab; enable it if you want an additional macro confirmation layer.
• Fixed-parameter design (no user-tweakable inputs) for consistent behavior across symbols.
• Non-repainting values finalize on 1W/3W candle close.
Originality & why closed-source
This is not a reimplementation of public open-source scripts. Trap Line uses a specific combination of higher-timeframe Hull smoothing, optional linear-regression pre-filtering, and lower-timeframe interpolation designed to expose trap zones (temporary regime breaches that often fail without a confirmed weekly close). The integration and thresholds are proprietary and tuned to retain weekly structure with reduced lag. The source is closed to protect this implementation.
Integration, not a mashup
Trap Line is a single, self-contained framework. It does not merely merge other indicators; its components are integrated to produce a unified higher-timeframe baseline (1W/3W) with a defined reading protocol (above/below line, weekly-close confirmation, optional candle-color confirmation).
Indicator, not a strategy
This publication provides an indicator overlay , not a trading strategy. It includes no backtests, position logic, performance claims, or risk assumptions. Use it as an analytical bias filter within your own risk management.
Comparison to common tools
Compared to standard MAs or SuperTrend-style bands, Trap Line prioritizes (1) higher-timeframe structure fidelity, (2) reduced lag via HMA-type smoothing, and (3) explicit weekly-close confirmation to avoid premature regime flips. The optional 3-Week line acts as a macro confirmation layer and is hidden by default in the Style tab.
WSH - Calvin / Scott EMA'sProvides EMA's as described by Calvin Hill along with some other EMA's including Hull, SSMA and some settings to turn on or off some of the noise.

Colored HMASimply a colored HMA. Perfect for trend following systems in combination with other indicators.

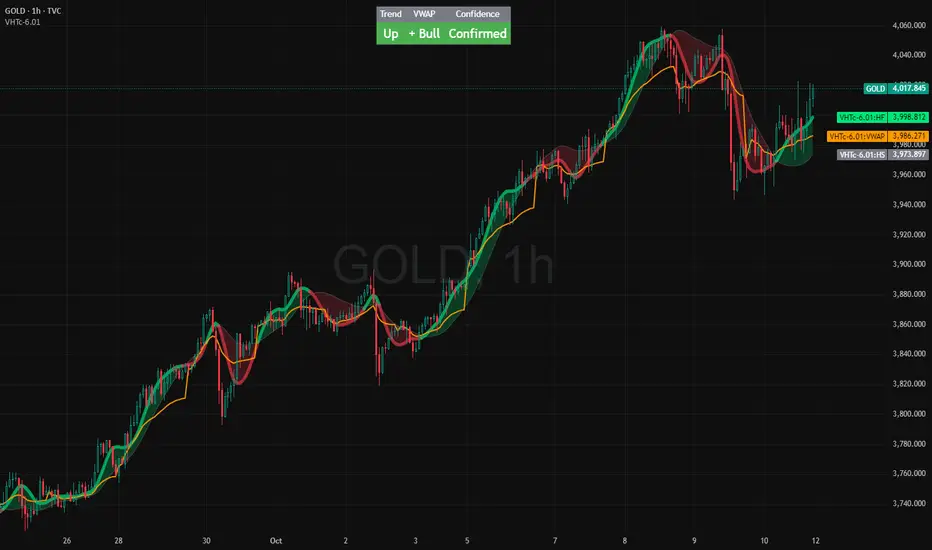
VWAP HMA Trend Execution SystemVWAP Trend Execution System
🧭 Purpose
Most traders don’t fail from bad charts — they fail from bad timing.
Jumping in too early, bailing too soon, or freezing when the real move begins.
The VWAP Trend Execution System cuts through that chaos.
It visually syncs Trend, VWAP, and Confidence — giving you instant clarity to trade with calm precision.
⚙️ The Three Core Gauges:
1. 📈 Trend Green for up, Red for down (Trend: Confirms direction)
2. 💰 VWAP Price vs. Volume Weighted Average Price. Institutional Fair Value. (Bull or Bear)
3. 🎯 Confidence Agreement between trend & VWAP. Dont fight the trend.
Bonus Feature: Confidence Turns 🟢 Confident when aligned, 🟡 Cautious when mixed.
Bonus 2: This version has the cross / confirmed direction arrow in the table.
Together, these create a clean, visual readout of the market’s health.
🧩 How to Use
Watch the Color Flow:
🟢 Green Cloud → Buyers in control.
🔴 Red Cloud → Sellers in control.
Check VWAP (Orange Line):
Price above VWAP → bullish strength.
Price below VWAP → bearish control.
Hovering at VWAP → indecision. Wait.
---
Act With Discipline:
Trade only when all gauges agree.
Add size only in Confident conditions.
Trim or tighten stops when it shifts to Cautious.
⚡ Quick Reference:
🟢 Green cloud + above VWAP + Confident | Uptrend continuation | Favor long bias
🔴 Red cloud + below VWAP + Confident | Downtrend continuation | Favor short bias
Mixed colors or Cautious: Wait or scale back
Cloud flips color: Possible shift. Reassess bias next bar
🧠 Best Practices
Works best on liquid symbols (SPY, QQQ, BTC, GOLD).
Ideal timeframes: 5m to 1h.
Use at bar close for confirmation, but enjoy live responsiveness for awareness.
Combine with your existing risk management — VTES is a timing enhancer, not a signal generator.
Designed for clarity on both light and dark themes (optimized for dark).
💡 Mindset
This isn’t a prediction tool — it’s a discipline tool. Wait for agreement.
Execute when the picture is clear. Protect capital when it’s not.
🧘 Clarity over clutter. Timing over guessing.
⚖️ Disclaimer: Educational and informational use only. Not financial advice. Always use independent judgment and position sizing.

VWAP HMA Trends
It visually syncs Trend, VWAP, and Confidence — giving you instant clarity to trade with calm precision.
⚙️ The Three Core Gauges:
1. 📈 Trend Green for up, Red for down (Trend: Confirms direction)
2. 💰 VWAP Price vs. Volume Weighted Average Price. Institutional Fair Value. (Bull or Bear)
3. 🎯 Confidence Agreement between trend & VWAP. Dont fight the trend.
Bonus Feature: Confidence Turns 🟢 Confident when aligned, 🟡 Cautious when mixed.
Together, these create a clean, visual readout of the market’s health.
🧩 How to Use
Watch the Color Flow:
🟢 Green Cloud → Buyers in control.
🔴 Red Cloud → Sellers in control.
Check VWAP (Orange Line):
Price above VWAP → bullish strength.
Price below VWAP → bearish control.
Hovering at VWAP → indecision. Wait.
---
Act With Discipline:
Trade only when all gauges agree.
Add size only in Confident conditions.
Trim or tighten stops when it shifts to Cautious.
⚡ Quick Reference:
🟢 Green cloud + above VWAP + Confident | Uptrend continuation | Favor long bias
🔴 Red cloud + below VWAP + Confident | Downtrend continuation | Favor short bias
Mixed colors or Cautious: Wait or scale back
Cloud flips color: Possible shift. Reassess bias next bar
⚖️ Disclaimer: Educational and informational use only. Not financial advice. Always use independent judgment and position sizing.
TGFA Flexible Alerts Multi-MA CrossoversTGFA Flexible Alerts, Multi-MA Crossovers
Description
Flexible MA crossovers with BUY/SELL alerts, customizable candle colors, and an info box for ATR/volatility insights. Supports EMA/SMA/HMA/VWAP on any chart.
Overview
TGFA Flexible Alerts is a versatile Pine Script indicator for traders seeking customizable moving average (MA) crossovers, visual signals, and quick-reference metrics. It overlays crossover lines (e.g., fast EMA over slow SMA), generates BUY/SELL labels and alerts, colors candles based on themes, and includes an optional info box with ATR bands, support/resistance, and trend projections. Built for any symbol and timeframe (optimized for 1H intraday), it auto-detects Heikin Ashi charts and handles mixed MA types like responsive HMA with lagging EMAs. All logic uses built-in TA functions for reliability—no repainting on confirmed bars.
Key Features
MA Crossover Engine: Configurable lines (EMA, SMA, HMA, VWAP) with dynamic colors (HMA tints green/red based on slope). Enable/disable via inputs.
Invert Signals Toggle: Flips BUY/SELL logic for mixed MA setups (e.g., HMA as fast line over EMA).
Reasoning: Traditional crossovers assume a fast line (low lag) crossing above a slow line (high lag) for buys. HMA's hull design makes it ultra-responsive, so it may "lead" too aggressively—causing premature signals. Inverting aligns it with user intuition (e.g., HMA dipping below then recovering signals strength), reducing false positives in trending markets. Test on your pairs!
Visual Alerts: BUY/SELL labels at crossover price (with optional price display and offset adjustment).
Single MA Overlays: Independent plots for EMA/SMA/HMA/VWAP (length 0 to hide).
Info Box: Real-time table with current price, ±1/2 ATR bands, median price (over lookback), trend (SMA50 slope), volatility % (ATR normalized), support/resistance (recent highs/lows), and reversal projections (tied to SMA50 pivot for up/down bias).
Candle Coloring: 20+ themes (dark/light canvases) for bull/bear/reversal/low-volume bars—e.g., Emerald Blaze greens uptrends, dims on low vol. Toggle off for no changes.
Chart Source Flexibility: Auto-switches to Heikin Ashi if detected; manual override for Regular/HA.
Alerts fire on crossovers/crossunders (custom messages with ticker/interval). Open-source for forking.
How to Use
Add to Chart: Search in TradingView's public library, apply to any symbol (e.g., stocks, forex). Best on 1H for intraday, but works on daily/weekly too.
Setup Crossovers: Choose Line 1/2 types/lengths (e.g., HMA 9 over SMA 20). Enable "Invert Signals" if using HMA—prevents lag mismatches in volatile assets.
Alerts & Labels: Toggle labels for visuals; set TradingView alerts on "Buy"/"Sell" conditions. Use offset for crowded charts.
Info Box Insights: Enable for quick scans—e.g., enter long near support if trend is bullish and price > median. Adjust ATR length (default 14) for sensitivity.
Candle Themes: Pick a scheme (e.g., Neon Pulse for dark mode); it overrides bar colors without altering data.
Customization Tip: For HMA-heavy setups, invert + short lengths (5-9) catch turns early; pair with volume filter in alerts.
Limitations & Disclaimers - Designed for overlay on price charts; may overlap in tight ranges—adjust transparency via styles.
HMA can repaint intra-bar; signals confirm on close. Not back tested for all assets—validate with strategy tester.
Info box projections use SMA(50) as a trend pivot (same for up/down as reference); customize via code for advanced calcs. Candle colors are cosmetic only.
This is an analysis tool, not advice. Trading involves risk; combine with fundamentals/news. Past performance isn't indicative of future results. No liability for losses.
I'm still a newbie, so feedback encouraged!
Thank you!!
ThisGirl

[DEM] Double Hull Moving Average (DHMA) Double Hull Moving Average (DHMA) is designed to create an ultra-smooth and responsive trend-following indicator by applying the Hull Moving Average calculation twice to reduce lag while maintaining smoothness. The indicator first calculates a Hull Moving Average of the source price over the specified length (default 233), then applies another Hull Moving Average to the result, and finally uses the standard Hull formula (2 * HMA1 - HMA2) to create the Double Hull Moving Average. The resulting line changes color dynamically from green when trending upward to red when trending downward, with matching bar colors to provide clear visual confirmation of trend direction, offering traders a highly refined moving average that responds quickly to price changes while filtering out most market noise.