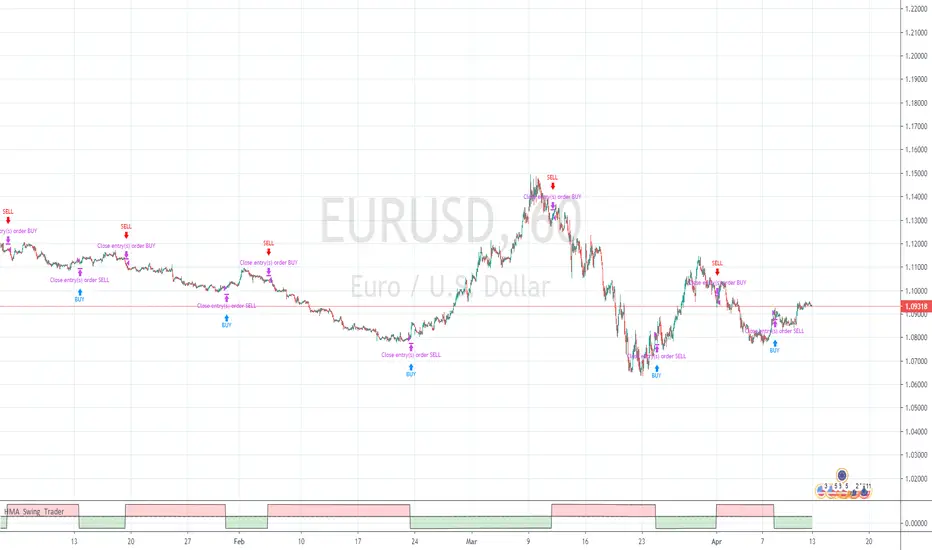
Hull Moving Average Swing TraderHull Moving Average Strategy
2 X HMA's,
1st HMA on current price (recommended source OPEN)
2nd HMA on previous candle. signal on crossover.
Buy and Sell signals on chart, red & green view pane (Green Buy, Red Sell)
Đường trung bình trượt Hull (HMA)
Hull MA and rate of changeUse of hull moving average and rate of change to get buy and sell signals.
Feedback is most welcomed.

HMA-Crossover AlertsThis simple script plots bullish and bearish Hull Moving Average Crossovers and fires Alerts when long or short conditions are met.

Smooth HA / Hull MA / MTF===========
Smooth HA / Hull MA / MTF
===========
A combination of a Smoothed Heikin Ashi Chart Line and a Hull MA Line, paints a "Long" or "Short" alert when the Hull MA changes color - editable settings for the smoothing of HA data and Hull MA Length; you can also change the time frame used (must be the same or longer as the chart).
-----------
This indicator does a real good job at finding highs and lows (otherwise known as entry and exit points!) picking up on just about every large, decent swing and making the most from those big moves! The disadvantage of all Smoothed HA strategies are when times are choppy or ranging - given the natural lag of the indicator you can be sure in choppy times you'd be buying at the top and selling at the bottom almost every time ~ No indicator is perfect!
This Smooth HA/Hull MA indicator also has a built in MTF function (Multi-Time-Frame). This means you can be using a 1hr chart and set the indicator to a 4hr chart - generally any movements on a greater time frame will overcome any movements of the smaller time frame, so this is where you should be gathering data about which direction the market is moving - as always, follow the trend.
Hope (like always) this is of at least some use to some people.
Good Luck and Happy Trading!

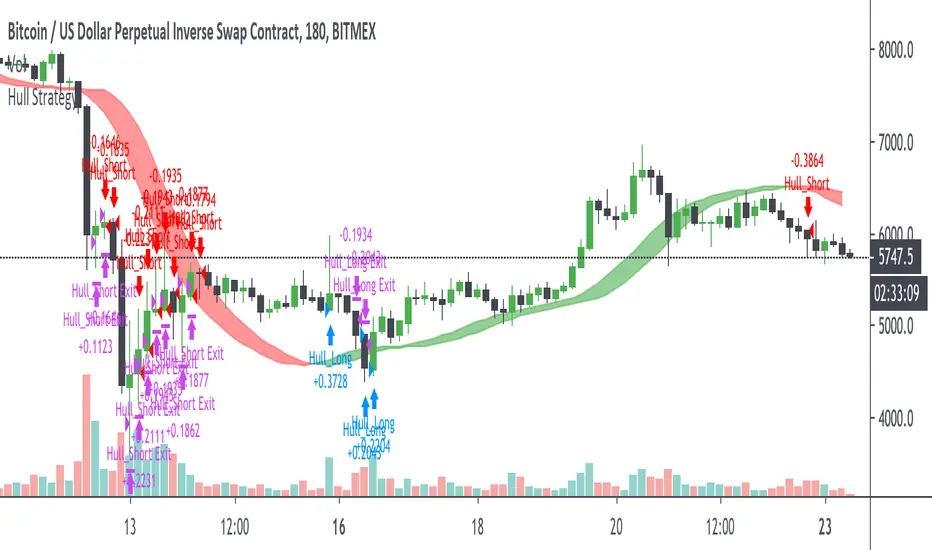
Hull Strategy [Bitduke]Description
The Hull Moving Average (HMA) was developed by Alan Hull for the purpose of reducing lag, increasing responsiveness while at the same time eliminating noise. Its calculation is elaborate and makes use of the Weighted Moving Average (WMA).
It uses two lagged hull moving averages at the intersection of which a change in trend is determined.
Risk Management
Risk is managed by limiting the loss per trade (in%) using stop loss variable.
Improvements
Can be improved by experiments with stop loss and take profit.
Backtesting
Bitmex XBTUSD
Timeframe 3H
Stop 2%, take profit : n/a
193.5% profit
22.42% drawdown
FTX BTC-PERP
Timeframe 3H
Stop 2%, take profit : n/a
187.5% profit
14.79% (!) drawdown
FTX SHIT-PERP
Timeframe 3H
Stop 2%, take profit : n/a
112.5% profit
13.79% (!) drawdown
RSI and Smoothed RSI Bull Div Strategy [BigBitsIO]This strategy focuses on finding a low RSI value, then targeting a low Smoothed RSI value while the price is below the low RSI in the lookback period to trigger a buy signal.
Features Take Profit, Stop Loss, and Plot Target inputs. As well as many inputs to manage how the RSI and Smoothed RSI are configured within the strategy.
Explanation of all the inputs
Take Profit %: % change in price from position entry where strategy takes profit
Stop Loss %: % change in price from position entry where strategy stops losses
RSI Lookback Period: # of candles used to calculate RSI
Buy Below Lowest Low In RSI Divergence Lookback Target %: % change in price from lowest RSI candle in divergence lookback if set
Source of Buy Below Target Price: Source of price (close, open, high, low, etc..) used to calculated buy below %
Smoothed RSI Lookback Period: # of candles used to calculate RSI
RSI Currently Below: Value the current RSI must be below to trigger a buy
RSI Divergence Lookback Period: # of candles used to lookback for lowest RSI in the divergence lookback period
RSI Lowest In Divergence Lookback Currently Below: Require the lowest RSI in the divergence lookback to be below this value
RSI Sell Above: If take profit or stop loss is not hit, the position will sell when RSI rises above this value
Minimum SRSI Downtrend Length: Require that the downtrend length of the SRSI be this value or higher to trigger a buy
Smoothed RSI Currently Below: Value the current SRSI must be below to trigger a buy


Hull Signal and Auto Fib 30 secThis script will not be given away for free. Been months of developing and the effort is paying off.
The code uses a 40 HULL MA on the 30 second chart to identify up/down changes in trend. It ensures the equity is positive on the day to go long, or negative on the day to go short.
It draws the stop and fib lines according to the current 3 min ATR over the last 4 periods (12 minutes) : x1 x2 x3 x4 x6
Candles are highlighted upon entries. Grid begins.
Code resets upon one of the following:
- 4x target achieved and the trade has been active for 30 minutes
- 6x target achieved
- Stop hits
- 30 minutes have lapsed and the close is less than target x2
I have performed simple strategy analyses and have determined:
(Approximately)
34% lose x1
66% achieve 1:1, manually stop out at B/E after first target hits
48% achieve 2:1, manually stop out above B/E after x2 target hits
38% achieve 3:1, manually stop out above x1 after x3 target hits (will reset fib grid without change in trend)
13% achieve 4:1, manually stop out above x3 after x4 target hits (will reset fib grid without change in trend)
I have not evaluated for x6 though it expected to be around 5% of the winning trades. (will reset fib grid without change in trend)
Message me if your interested further.

HEMA - A Fast And Efficient Estimate Of The Hull Moving AverageIntroduction
The Hull moving average (HMA) developed by Alan Hull is one of the many moving averages that aim to reduce lag while providing effective smoothing. The HMA make use of 3 linearly weighted (WMA) moving averages, with respective periods p/2 , p and √p , this involve three convolutions, which affect computation time, a more efficient version exist under the name of exponential Hull moving average (EHMA), this version make use of exponential moving averages instead of linearly weighted ones, which dramatically decrease the computation time, however the difference with the original version is clearly noticeable.
In this post an efficient and simple estimate is proposed, the estimation process will be fully described and some comparison with the original HMA will be presented.
This post and indicator is dedicated to LucF
Estimation Process
Estimating a moving average is easier when we look at its weights (represented by the impulse response), we basically want to find a similar set of weights via more efficient calculations, the estimation process is therefore based on fully understanding the weighting architecture of the moving average we want to estimate.
The impulse response of an HMA of period 20 is as follows :
We can see that the first weights increases a bit before decaying, the weights then decay, cross under 0 and increase again. More recent closing price values benefits of the highest weights, while the oldest values have negatives ones, negative weighting is what allow to drastically reduce the lag of the HMA. Based on this information we know that our estimate will be a linear combination of two moving averages with unknown coefficients :
a × MA1 + b × MA2
With a > 0 and b < 0 , the lag of MA1 is lower than the lag of MA2 . We first need to capture the general envelope of the weights, which has an overall non-linearly decaying shape, therefore the use of an exponential moving average might seem appropriate.
In orange the impulse response of an exponential moving average of period p/2 , that is 10. We can see that such impulse response is not a bad estimate of the overall shape of the HMA impulse response, based on this information we might perform our linear combination with a simple moving average :
2EMA(p/2) + -1SMA(p)
this gives the following impulse response :
As we can see there is a clear lack of accuracy, but because the impulse response of a simple moving is a constant we can't have the short increasing weights of the HMA, we therefore need a non-constant impulse response for our linear combination, a WMA might be appropriate. Therefore we will use :
2WMA(p/2) + -1EMA(p/2)
Note that the lag a WMA is inferior to the lag of an EMA of same period, this is why the period of the WMA is p/2 . We obtain :
The shape has improved, but the fit is poor, which mean we should change our coefficients, more precisely increasing the coefficient of the WMA (thus decreasing the one of the EMA). We will try :
3WMA(p/2) + -2EMA(p/2)
We then obtain :
This estimate seems to have a decent fit, and this linear combination is therefore used.
Comparison
HMA in blue and the estimate in fuchsia with both period 50, the difference can be noted, however the estimate is relatively accurate.
In the image above the period has been set to 200.
Conclusion
In this post an efficient estimate of the HMA has been proposed, we have seen that the HMA can be estimated via the linear combinations of a WMA and an EMA of each period p/2 , this isn't important for the EMA who is based on recursion but is however a big deal for the WMA who use recursion, and therefore p indicate the number of data points to be used in the convolution, knowing that we use only convolution and that this convolution use twice less data points then one of the WMA used in the HMA is a pretty great thing.
Subtle tweaking of the coefficients/moving averages length's might help have an even more accurate estimate, the fact that the WMA make use of a period of √p is certainly the most disturbing aspect when it comes to estimating the HMA. I also described more in depth the process of estimating a moving average.
I hope you learned something in this post, it took me quite a lot of time to prepare, maybe 2 hours, some pinescripters pass an enormous amount of time providing content and helping the community, one of them being LucF, without him i don't think you'll be seeing this indicator as well as many ones i previously posted, I encourage you to thank him and check his work for Pinecoders as well as following him.
Thanks for reading !

Colored Moving Averages Can Help You Spot TrendsMoving averages are perhaps the most popular indicator in technical analysis. But sometimes they're not the easiest to interpret.
This indicator helps you see the trend by coloring the MA based on its direction. It's green when rising and red when falling. Of course, you can easily change that in the Style tab under Settings.
Color MA also lets you select from five different types of moving averages, including simple, exponential and Hull. We've included a list for easy reference below. Just change the "AvgType" on the Input tab under Settings.
This chart of Facebook shows the 20-day simple moving average. Notice how swings often marked turns in the stock price.
AvgType codes:
1 - Simple Moving Average
2 - Exponential Moving Average
3 - Hull Moving Average
4 - Weighted Moving Average
5 - Volume Weighted Moving Average

SSL HybridThis script is designed for the NNFX Method, so it is recommended for Daily charts only.
Tried to implement a few VP NNFX Rules
This script has a SSL / Baseline (you can choose between the SSL or MA), a secondary SSL for continiuation trades and a third SSL for exit trades.
Alerts added for Baseline entries, SSL2 continuations, Exits.
Baseline has a Keltner Channel setting for "in zone" Gray Candles
Added "Candle Size > 1 ATR" Diamonds from my old script with the criteria of being within Baseline ATR range.
Credits go to:
Strategy causecelebre www.tradingview.com
SSL Channel ErwinBeckers www.tradingview.com
Moving Averages jiehonglim www.tradingview.com
Moving Averages everget www.tradingview.com
"Many Moving Averages" script Fractured www.tradingview.com

Simple EMA_Hull_RSI StrategyAnother simple strategy. Crossing EMA & Hull MA and the level of RSI (overbought/oversold) defines long or short.
Can be improved by varying the parameters and adding take profit / stop loss.
Backtest: ETHUSD (Bitmex): 5m

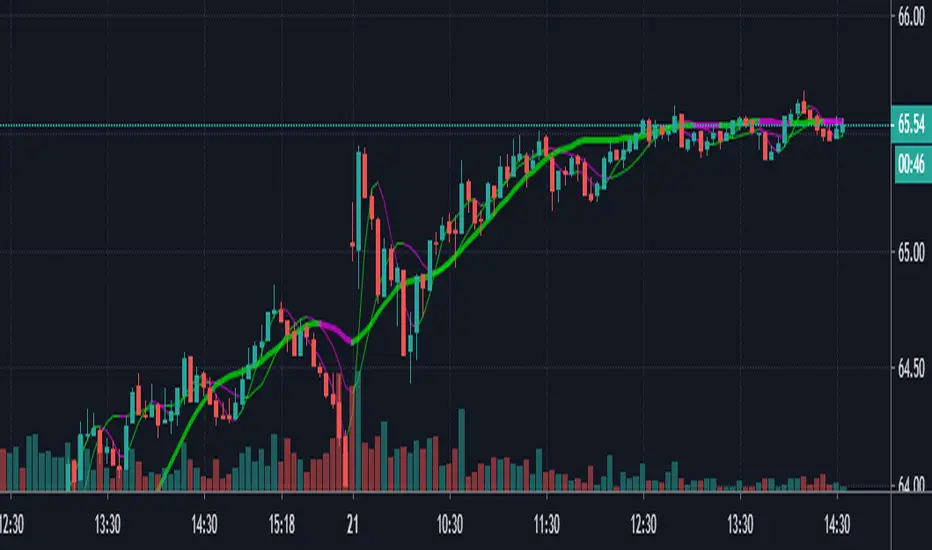
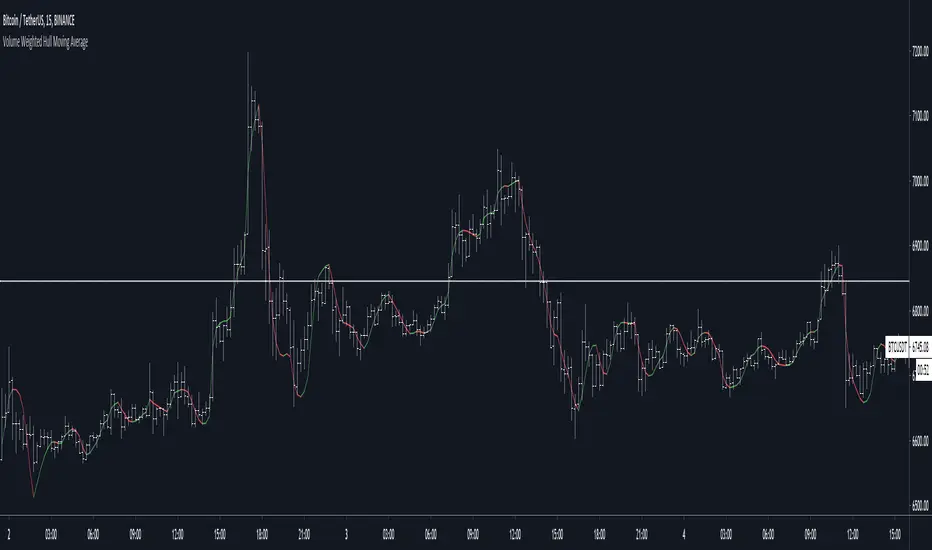
Volume weighted Hull moving averageA simple variation on the Hull Moving Average which reacts faster to high volume events, making it more responsive in those cases than even the standard Hull average.

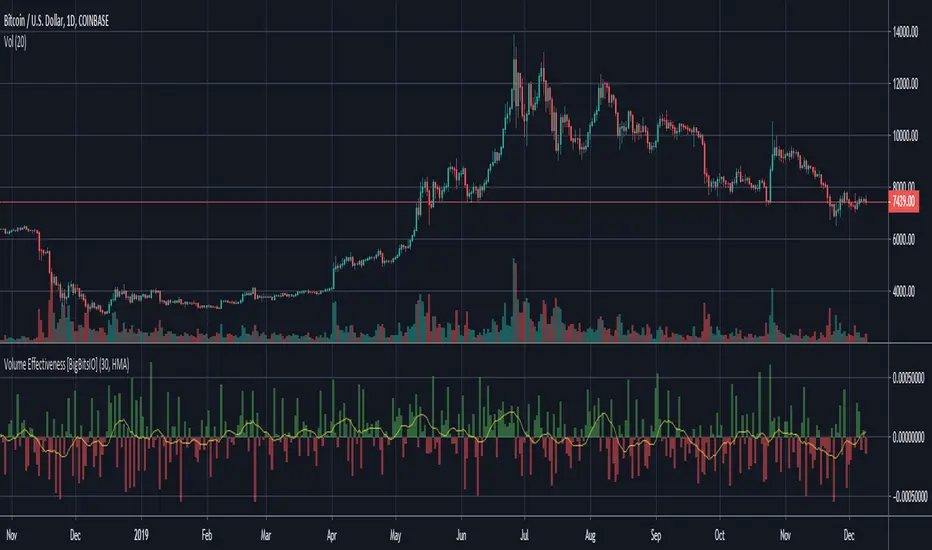
Volume Effectiveness [BigBitsIO]This Volume Effectiveness indicator is designed to allow users to try and identify how effective volume is on each candle, and smoothing those values over time to try to find trends.
Volume Effectiveness is the % change in price for each single unit of volume on the associated candle. The value can be positive or negative, but there is an option to just monitor an absolute value.
Features:
- Volume Effectiveness
- Toggle if Volume Effectiveness should be an absolute value
- Toggle visibility of bars
- Smoothed moving average of Volume Effectiveness
- Adjustable period on the smoothed moving average
- Several moving average types available to use for the smoothed moving average
- Toggle visibility of smoothed moving average

Direction TradeDirection Trade is a moving average based indicator which combines power of SMA and WMA together.
The Buy/Sell (Arrow) signals comes from the combination of SMA and Hull MAs and works on multiple time frames.
The cross of yellow and blue indicates major trend change on bigger TFs, especially on Daily, these are also highlighted in the background color change.
In addition this indicator also adds power of Ichimoku which uses an optimized settings for crypto.

MasterMAThis study demonstrates 15 different common moving averages.
SMA, Double SMA, Triple SMA
EMA, Double EMA, Triple EMA
WMA, Double WMA, Triple WMA
VWMA, Double VWMA, Triple VWMA
Hull, Double Hull, Triple Hull
Buy/Sell alerts are given for crossover/under conditions.
Triangles at the bottom, pointing up are buy signals. Triangles at the top, pointing down, are sell signals

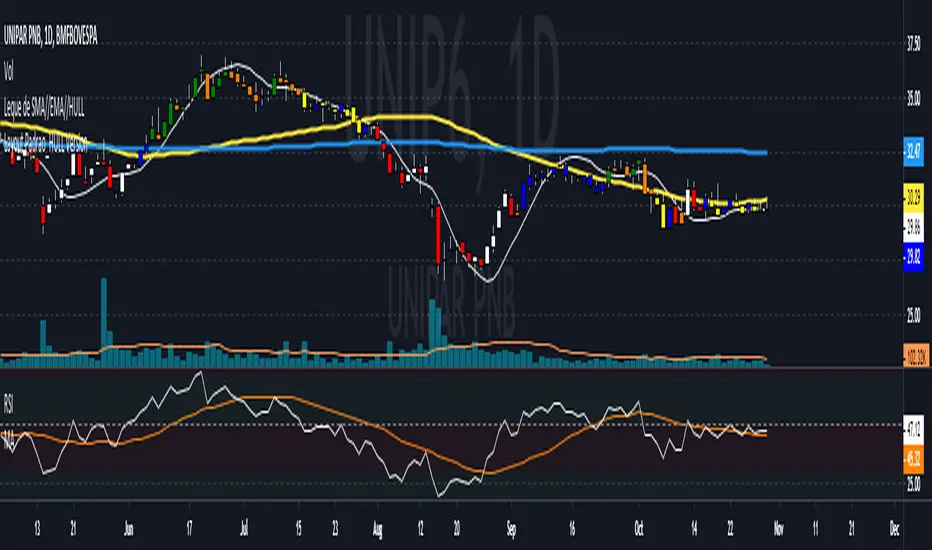
Layout Padrao_HULL Version This layout was inspired by the Andre Machado´s Tabajara set of rules.
The adaptation are the following:
-Usage of Hull Average instead of simple moving average
-Usage of 2 Averages instead of just one
-Implementation of a "transition zone"
Average Candle Color
p1 // p2 // Prior
> // > // > Set Color 1
> // > // < Set in your layout settings color (down candle)
> // < // > Set Color A1
> // < // < Set Color A2
< // > // > Set Color A1
< // > // < Set Color A2
< // < // > Set in your layout settings color (up candle)
< // < // < Set Color 2
The A1 // A2 colors are for the transition zone.
Either the average 1 or the average 2 will be lower than the previous average.
This is a way to show how both averages are developing without having to look at 2 additional lines, making the layout more clear (at least, for me).
Feel free to comment
PS: Thank you for all the people who have implemented Machado´s work in pine editor
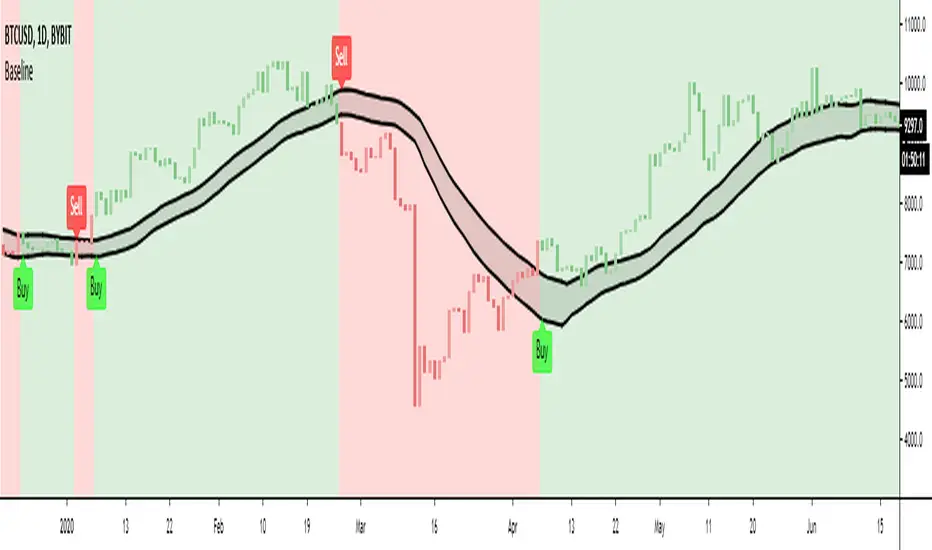
Baseline - evoPlots the high and low of your chosen moving average.
Options are:
SMA = Simple Moving Average
EMA = Exponential Moving Average
WMA = Weighted Moving Average
HMA = Hull Moving Average
VWMA = Volume Weighted Moving Average
RMA = Exponetial Weighted Moving Average
ALMA = Arnaud Legoux Moving Average
Unbox "Use Current Timeframe" to use chosen timeframe below
I mainly use this to get in and out of the market for futures trading, to reduce fake outs of having just one moving average line.
Let me know if you like it..
Inspired from LazyBear's EMAenvelope :)
Scripting Tutorial 9 - TManyMA Strategy - Long Market Order OnlyThis script is for a triple moving average strategy where the user can select from different types of moving averages, price sources, lookback periods and resolutions.
Features:
- 3 Moving Averages with variable MA types, periods, price sources, resolutions and the ability to disable each individually
- Crossovers are plotted on the chart with detailed information regarding the crossover (Ex: 50 SMA crossed over 200 SMA )
- Forecasting available for all three MAs. MA values are forecasted 5 values out and plotted as if a continuation to the MA.
- Forecast bias also applies to all forecasting. Bias means we can forecast based on an anticipated bullish, bearish or neutral direction in the market.
- To understand bias, please read the source code, or if you can't read the code just send me a message on here or Twitter. Twitter should be linked to my profile.
- Ribbons added and on by default. Optional setting to disable the ribbons. 5 ribbons between MA1 and MA2 and another 5 between MA2 and MA3.
- Ribbons are alpha-color coded based on their relation to their default MAs.
- Ribbons are only visible between MAs if the MAs being compared share the same Type, Resolution, and Source because there is no way to consolidate those three in a simple manner.
- Ribbon values are calculated based on calculated MA Periods between the MAs.
- Converted the existing study into a strategy
- Strategy only enters long positions with a market order when MA crossovers occur
- Strategy exits positions when crossunders occur
- Trades 100% of the equity with one order/position by default
- Ability to disable trading certain crosses with input checks
This script is meant as an educational script with well-formatted styling, and references for specific functions.
*** PLEASE NOTE - THIS STRATEGY IS MEANT FOR LEARNING PURPOSES. DEPENDING ON IT'S CONFIGURATION IT MAY OR MAY NOT BE USEFUL FOR ACTUAL TRADING. THE STRATEGY IS NOT FINANCIAL ADVICE ***

TSI CCI HullThis is TSI and CCI combined. The CCI is customized and is using HullMA, but the TSI is default TSI
For use with the HMAv420 indicator, to form trading strategy based on the 3 indicators.
Best as all 3 indicators used on 3 timeframes at once, ie 1m 5m 1H

Triple Hull Moving AverageCalculates and plots 3 Hull Moving Averages. Color of plot changes to indicate positive or negative slope. Original Hull MA code written by mohamed982.