Make & Track An Index — Custom Weighted (by Quinn Millegan)Fixed pinescript security call issue limiting to 40 calls
Indexes
Index Position Size Calculator for [US30 / US100 / SP500]What it does
This tool helps you size positions consistently for index trades on US30 (Dow Jones), NAS100 (Nasdaq-100), and SP500 (S&P 500). Enter your account balance, risk %, and your planned Entry / Stop-Loss / Target and the script calculates:
• Position Size (rounded to your lot/contract step)
• Risk-to-Reward (R/R)
• Potential P/L in USD based on your inputs
• Visual Entry / SL / TP lines with green/red zones and concise labels
Supported contract styles
Choose a preset for common products (e.g., CFD $1/pt, YM/NQ/ES futures, MYM/MNQ/MES micros) or override the economics yourself. You remain in control of the two key levers:
• $/point — how many dollars you gain/lose per 1 index point per contract/lot
• Point size — how many price units equal 1 index point on your chart (often 1.0, but some brokers use 0.1 or 0.5)
Inputs
• Account Balance ($) and Risk % per trade
• Index: US30 / NAS100 / SP500
• Contract: CFD / Futures (YM, NQ, ES) / Micros (MYM, MNQ, MES)
• $/point: auto from Contract or manual override
• Point size: auto from Index or manual override
• Position size step: rounding (e.g., 1 for futures, 0.01 for CFDs)
• Entry / SL / TP: typed values (snapped to tick), with on-chart zones and labels
• Display toggles for lines and labels
How the math works
• StopPoints = |Entry − SL| ÷ PointSize
• ProfitPoints = |TP − Entry| ÷ PointSize
• Position Size = (AccountBalance × Risk%) ÷ (StopPoints × $/point)
• R/R = ProfitPoints ÷ StopPoints
• Potential P/L = PositionSize × Points × $/point
How to use (quick start)
1. Select Index and Contract.
2. Confirm $/point and Point size match your broker’s specs.
3. Enter Entry / SL / TP for the trade idea.
4. Read the Position Size, R/R, and Potential P/L in the info box.
5. Adjust for fees, spreads, and slippage as needed.
Notes & limitations
• Broker symbols can vary. Always verify $/point and Point size for your instrument before risking capital.
• The script does not place orders and does not generate trade signals; it’s a sizing/visualization tool.
• Results can differ across brokers due to pricing, spreads, minimum lot sizes, and execution rules.
• Use on the intended indices; you’ll see a reminder if you load it elsewhere.
Changelog highlights
• Pine v6, constant-safe inputs, tick-snapping, global fills (no local-scope errors).
• Robust label handling and optional minimal chart markers.
Disclaimer
This script is provided for educational purposes only and does not constitute financial advice or a recommendation to buy or sell any security or derivative. Trading involves risk, including the possible loss of principal. Always do your own research, verify contract specifications with your broker, and consider testing in a demo environment before trading live.

swing_fun_advancedThis indicator is similar to my free open-source swing_fun indicator, but it contains sell signals and sell alerts too.
Design to be used on the indexes with the 4hr chart. It gives alerts whenever a long or short signal is found.
I have tested it with US100, UK100, DE40, US30, US500, J225.

CAM | Comparison and Normalisation Indicator Description: "CAM | Comparison and Normalisation" 🌟
Overview 📊
The "CAM | Comparison and Normalisation" indicator is a must-have tool for forex traders! 🚀 It analyzes the strength of a currency pair’s base and quote currencies against the pair’s price movement, using automatic detection, composite calculations, and normalization—all wrapped in a colorful, easy-to-read package. 🎨
How It Works 🛠️
- 🔍 **Automatic Currency Detection**: Instantly spots the base (e.g., EUR in EURUSD) and quote (e.g., USD) currencies—no manual setup needed!
- 💪 **Composite Strength Calculation**: Measures each currency’s power by averaging its rate against 9 major currencies (GBP, EUR, CHF, USD, AUD, CAD, NZD, JPY, NOK). A true strength test! 🏋️♂️
- 📏 **Normalization**: Scales everything with a smart formula (price minus moving average, divided by standard deviation) so base, quote, and pair prices play on the same field. ⚖️
- 🎨 **Dynamic Visualization**:
- Plots 3 normalized lines with unique colors:
- **Base Composite** (e.g., purple for GBP, blue for EUR)
- **Quote Composite** (e.g., green for USD, yellow for JPY)
- **Actual Pair** (⚪ white)
- Adds labels on the last bar (e.g., "Base: GBP" in purple). 🏷️
- 📊 **Performance Histogram**: Shows the base vs. quote strength gap with a green (👍) or red (👎) area chart—adjusted by the pair’s price.
- ⚙️ **Customizable Settings**: Adjust Scaling Period (50), Histogram Scale (0.5), and Levels (1, -1) to fit your style! 🎚️
Benefits 🌈
- 🧠 **Simplified Analysis**: Normalized data cuts through the noise, making trends crystal clear.
- ✅ **Enhanced Decisions**: Colorful lines and histograms spotlight trading signals fast.
- ⏱️ **Time-Saver**: No setup—just drop it on a chart and go!
- 🌍 **Versatile**: Works on any supported pair, with colors adapting automatically (e.g., orange AUD on AUDCAD).
- 👀 **Eye-Catching**: Currency-specific colors (like purple GBP from pound notes) make it fun and easy to follow.
How It Helps Traders 💡
- 📈 **Spot Trends**: See if the base is flexing 💪 or the quote is fading 📉, and how it ties to the pair’s price.
- ⚠️ **Catch Divergences**: Histogram flags when currency strength and price don’t match—hello, opportunity! 🚨
- 🛡️ **Manage Risk**: Normalized values and levels help gauge overbought/oversold zones for smarter stops.
- **Big Picture**: Compare currency strength to pair price for strategic edge, whether scalping or swinging.
Example in Action 🎬
- **GBPUSD Chart**:
- purple GBP line climbs, greenUSD dips, histogram turns green 👍—GBP’s gaining! If the white pair line rises too, it’s a bullish hint.
Conclusion ✨
"CAM | Comparison and Normalisation" turns forex complexity into clear, actionable insights. With its auto-detection, vibrant visuals, and trader-friendly design, it’s your shortcut to smarter trades! 📈💰

Index investingThe Index Investing indicator simplifies decision-making for adding to Index ETF's Long-term investments. By utilizing a percentage discount methodology, it highlights potential opportunities to enhance portfolios. This straightforward tool aids in identifying favorable moments to invest based on calculated price discounts from selected reference points, making the process more systematic and less subjective.
🔶 SETTINGS
Reference Price: Choose between 'All-Time-High' or 'Start of the Year' as the basis for calculating discount levels. This allows for flexibility in strategy depending on market conditions or investment philosophy.
Discount 1 %, Discount 2 %, Discount 3 %: These inputs define the percentage below the reference price at which buy signals are generated. They represent strategic entry points at discounted prices.
🔶 Default Parameters
The default parameters of 4.13%, 8.26%, and 12.39% for the discount levels are chosen based on the average 5-year return of the NSE:NIFTY Index, which stands at approximately 12.39%. By dividing this return into three parts, we obtain a structured approach to capturing potential upside at varying levels of market retracement, providing a logical basis for the selected default values.
Users have the flexibility to modify these parameters, tailoring the indicator to fit their unique approach and market outlook.
🔶 How Levels Are Calculated
Discount levels are calculated using the formula: Discount Price = Reference Price * (1 - Discount %) . This succinct approach establishes specific entry points below the chosen reference, such as an all-time high or the year's start price.
🔶 How Are the Buy Labels Generated
Buy signals are generated when the market price(Low of the candle) crosses under any of the defined discount levels. Each level has a corresponding buy label ('Buy 1', 'Buy 2', 'Buy 3'), which is activated upon the price crossing below the specified discount level and is only reset at the beginning of a new year or upon reaching a new reference high, ensuring signals are not repetitive for the same price level.
🔶 Other Features
Alerts: The indicator provides alerts for each buy signal, notifying potential entry points at their defined discount levels. The alert triggers only once per candle.
Year Marker: A vertical line with an accompanying label marks the start of each trading year on the chart. This feature aids in visualizing the temporal context of buy signals and reference price adjustments.

Market Performance TableThe Market Performance Table displays the performance of multiple tickers (up to 5) in a table format. The tickers can be customized by selecting them through the indicator settings.
The indicator calculates various metrics for each ticker, including the 1-day change percentage, whether the price is above the 50, 20, and 10-day simple moving averages (SMA), as well as the relative strength compared to the 10/20 SMA and 20/50 SMA crossovers. It also calculates the price deviation from the 50-day SMA.
The table is displayed on the chart and can be positioned in different locations.
Credits for the idea to @Alex_PrimeTrading ;)

Global Index SMA OverlayGlobal Index SMA Overlay
The Global Index SMA Overlay indicator allows traders to compare the price movements of a chosen stock with a chosen global index by overlaying the SMA of the index onto the stock's price chart.
The indicator supports major global indexes such as the S&P 500, NASDAQ 100, Dow Jones, DAX, CAC 40, FTSE 100, Nikkei 225, and ASX 200.
The indicator normalizes the SMA value by applying the price ratio between the stock and the index, which allows traders to easily compare the relative performance of the stock with respect to the index.
The user can choose the length of the SMA and the index to compare against, making it a versatile tool for a variety of trading strategies.
With the Global Index SMA Overlay indicator, traders can quickly and easily identify trends and potential trading opportunities by comparing the price movements of a stock with a chosen global index.

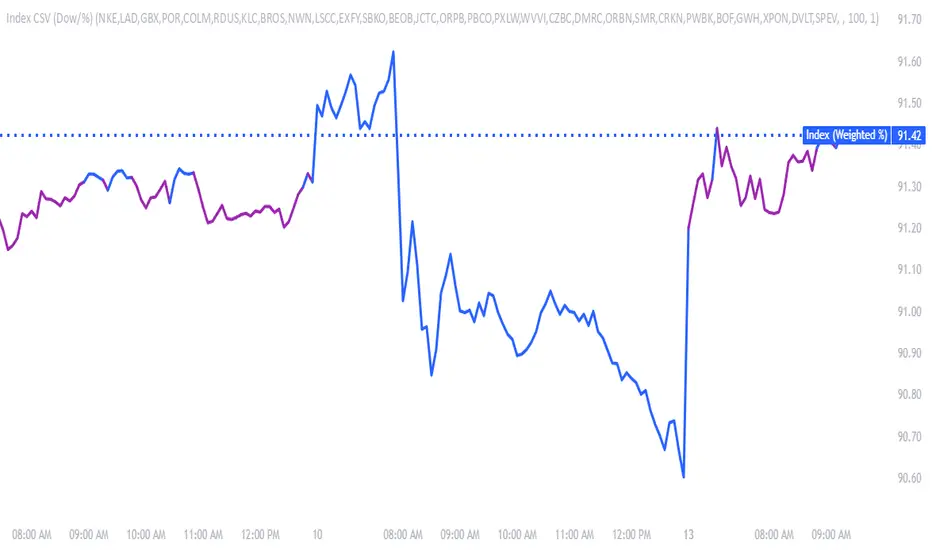
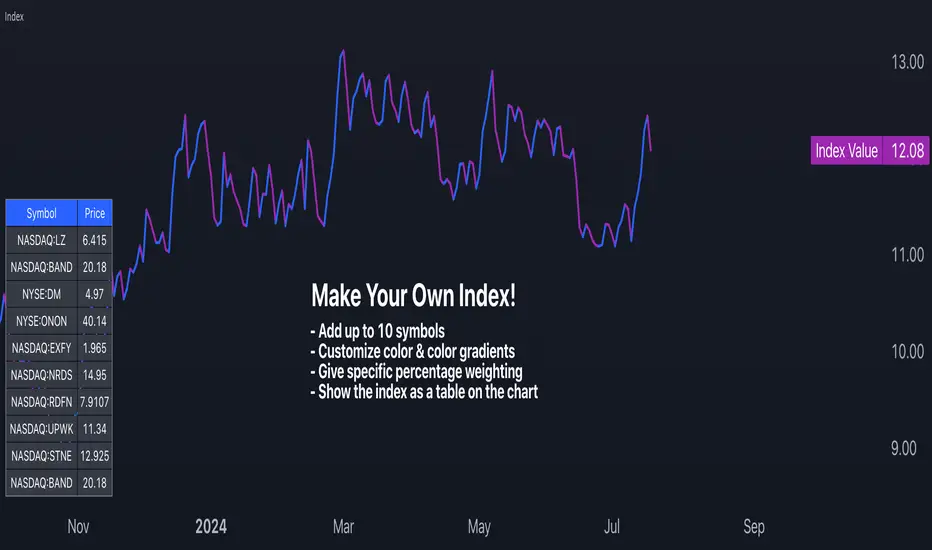
Make Your Own Index!Intro
For my first script, I have released Make Your Own Index version 1. It has a long way to go so please stay tuned. Scroll down to read all the updates and notes as they come in.
Why it matters
Making your index is important to quickly see an index of symbols that you want to chart. Having the ability to assign weightings gives you the opportunity to make the index equal weighted or custom weighted. As we all know, indexes like the S&P 500 are NOT equal weighted, but more heavily weighted toward the winners. Now, you can make your own of a basket of symbols and make them custom weighted or equal weighted. Have some fun exploring this.
Features
You select the symbols of your choice and then chart them as one line with a specific weighting. This can be done in the settings menu once the indicator is selected. Use the symbol search field to add a symbol. From what I have tested, it works for any symbol whether it's stocks, crypto, FX and more. The default is set to stocks.
The Weight field in the settings menu is where you can assign a specific weight to the symbol of your choice. This way you can make an equal weighted index or a custom weighted index. By default each symbol is set to 10 or 10%. There are 10 symbols in the menu, so at 10%, they are equally weighted! In the script I have made it so each weighting is in percentage terms. So type in the percentage and you're good to go.
The chart is currently displayed in a separate window and not as an overlay. This may change in the future. The line can also be changed slightly and the color of it. Stay tuned for more on this.
Send in feedback
I am a Pine rookie in all regards and I am surely looking for support, feedback, and/or ideas. I want to add a lot more to this. If you look at the settings you will see have some input fields that are in their first iteration and currently needing to be improved. Rather than waiting to make them perfect, I just want to get this out there and update as I go. Also, as mentioned, I will definitely need a little support at adding more features that I have in mind.
Credit where credit is due
I used a lot of Open Source indicators as inspiration to quickly get going so thank you to the following people and accounts who share open source scripts that you can use to learn, test, and get started instantly:
@TradingView
@LucF
@PineCoders
@KioseffTrading
@norok
@RedKTrader
@NeoButane
And many others. That's the beauty of open source!
Closing note
Publishing it open source so people can fact check my code and thinking. One thing I know for sure is that this can probably be created in a more efficient way. Nonetheless, please a take look and let me know what you think - I am excited to make some updates over the coming weeks.
Thanks for reading!
Commitment of Traders ~ INDEXESMy intention was to create 1 script for the Commitment of Traders report but I wasn't not aware there is a limit on how many instrument calls can be made in PineScript so I had no choice but to divide the script into instrument categories. So far I have created 4 of them: Forex, Metals/ Commodities, Treasuries & Indexes which is the one presented here. If you are interested in the other ones, feel free to do a search.
Available Instruments: Mini S&P, VIX, Mini NASDAQ, Mini RUSSELL, EAFE Index (Global Developed Markets & EMRG Index (Global Emerging Markets)
The script calculates and plots the ZScore of both Net Long (Money Managers / Asset Managers) and Net Long (Dealers / Swap). In some instrument categories you will also see Open Interest. It depends on whether I was maxed out or not on making security calls.
If you are not familiar with ZScore, it basically calculates the distance of price from a mean average in units of Standard Deviation. In theory when price reaches +2 it signifies overbought while if it reaches -2 is oversold. However just because it's hitting an extreme in one particular average doesn't necessarily mean it will reverse as the position of price in relation with the next longer average might not be so out of range.
Must be attached to weekly chart.
If you have any questions/suggestions, feel free to add them in the comments below

Confluence CandlesThis indicator looks for confluence among three indicators (RSI, Stochastic, and MACD), a strategy popularized by Markus Heitkoetter in his book, “The PowerX Strategy: How to Trade Stocks and Options in Only 15 Minutes a Day”, and expands it to look for agreement on up to four symbols.
Each indicator is configurable in the settings, as well as the ability to choose which of the indicators are used.
Default Logic
Green Candles
RSI > 50
Stochastic > 50
MACD Histogram > 0
Red Candles
RSI < 50
Stochastic < 50
MACD Histogram < 0
When multiple symbols are selected, the above needs to be true for all selected symbols.
Example Use Cases
- Setting the indicator to the Nasdaq 100 (QQQ or NQ1!) while trading a stock that is part of that index such as AAPL or TSLA
- Setting the indicator to multiple indexes that tend to move together in order to trade one of them since they tend to make stronger moves when moving together (ex. SPY & QQQ, or ES1! & NQ1!)
- Setting the indicator to Bitcoin while trading a smaller crypto pair that moves as a sympathy play.
Tip
If you have trouble finding the full name for a specific instrument from an exchange such as BTCUSD from Coinbase, you can bring up TradingView’s “Symbol Search” pop-up modal, enter your search term, use the down arrow key on your keyboard to move the focus to the symbol you want, and you will see the full name in the search field such as “COINBASE:BTCUSD”.

Mayfair Risk On/OffWe take the relative strength of the 4 Risk-On currencies (AUD, NZD, CAD, GBP) all together, and compare with the relative strength of the Risk-Off currencies (USD, EUR, JPY, CHF).
Green line above the 50? We are generally Risk-On. Red line above? Risk-Off.
You can switch between RSI and TSI, see what you prefer.

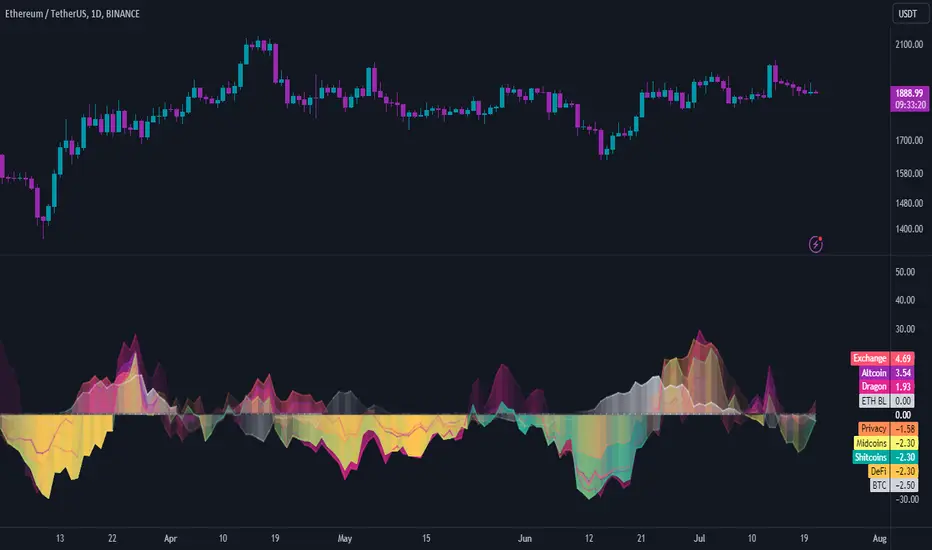
INDICES against BTC & ETHThe idea is the following; you can easily chart the FTX perp indices against (currently) two baselines, ETH & BTC.
I always choose ETH since it is way harder to outperform ETH at the moment. Doing this helps me see certain trends and/or fractal that might happen again in the future.
Since I already made D.A.M (Defi against Majors / Pricing Defi categories against BTC & ETH: ) I came across the idea of doing the same thing but with the perp indices that FTX offer. At first, I wanted to add this to D.A.M but it has no place in this indicator since this will not only look at Defi but the macro market as a whole.
The indicator currently only looks at the following indexes (weighting can be found here: https:// help. ftx. com/hc/en-us/articles/360027668812-Index-Calculation) :
DRGN: THE DRAGON INDEX
ARPA, BTM, IOST, NEO, NULS, ONT, QTUM, TRX, VET
ALT: ALTCOIN INDEX
BCH, BNB, EOS, ETH, LTC, XRP, TRX, DOT, LINK, ADA
MID: THE MID CAP INDEX
ALGO, ATOM, BAT, CRO, DASH, DCR, DOGE, HT, IOTA, LEO, NEO, OKB, ONT, QTUM, VET, XEM, XLM, XMR, XTZ, ZEC, ZRX, OMG, COMP, BSV, FTT, YFI, UNI, SNX, MKR, AAVE
SHIT: THE SHITCOIN INDEX
AE, AION, ARDR, ARPA, BCD, BEAM, BTG, BTM, BTS, BTT, CHZ, CKB, DGB, ELF, ENJ, GNT, GRIN, GT, HBAR, HC, ICX, IOST, KMD, KNC, LAMB, LRC, LSK, MANA, MATIC, MCO, NANO, NULS, OMG, POWR, PUNDIX, REN, REP, RVN, SC, SNT, STEEM, THETA, TOMO, VSYS, WAVES, XVG, XZC, ZEN, ZIL, ZRX
PRIV: THE PRIVACY INDEX
BEAM, DCR, GRIN, KMD, XMR, XVG, XZC, ZEC, ZEN
DEFI: THE DECENTRALIZED FINANCE INDEX
KNC, MKR, ZRX, REN, REP, SNX, COMP, TOMO, RUNE, CRV, DOT, LINK, MTA, SOL, CREAM, BAND, SRM, SUSHI, SWRV, AVAX, YFI, UNI, WNXM, AAVE, BAL
[astropark] Volume AnalyzerDear Followers,
today another awesome Analysis Tool, that you can use for day scalping: Volume Analyzer !
This indicator
works on every market, pair and timeframe
lets you see analysis of a different timeframes using the resolution parameter
has an optional trend colored background (I suggest to disable it if you use a different resolution)
integrates a tape profit strategy based on RSI (you can config it and enable/disable it)
lets you setup alarms on bull/bear signal as well as on TP RSI-based signals
I prefer to use this indicator in my day trading on low timeframes , like 5m - 15m - 1h, as you can have access to a more detailed volume information, but it works on high timeframes too as you can see in examples at the bottom of the description.
I truly think that Volume says a lot about future price action, as stated in my Cumulative Volume Delta (CVD) indicator, which you can find here below:
In this indicator, I'm much more interested in the bullish or bearish effect of volume generated by traders and following price action.
Be sure to understand that at current status this is not a complete automated strategy, but an analysis tool which aims to give you a positive bias, a profitable hedge in your trading journey.
As I always say, all tools are great if you use them correctly: this is not the "Holy Grail", so always use proper money and risk management strategies.
This indicator quite often calls bottoms and tops , most of the times it announces a coming reversals , sometimes it fails too of course.
Check this screenshot to have a clear idea of what I'm talking about:
You are supposed to discard signals of the same type that comes later and at a worse price (related to the trend) or you can use to re-fill your still-open position, using it as a re-entry.
You are supposed to act at first signals and average up/down if price goes against you when a new bear/bull signal appears at a better price.
Here it is another element you must consider: price action can deny a reversal stated by volume analysis .
In these cases, you must apply a stop loss in your trade and reverse your position. Don't average up/down your entry.
The reason in this screenshot below:
As you can see, the local downtrend was broken, as it was a simple pullback, previous bull trend was restored and price went up a lot!
The indicator here detected bears rejecting the run-up as much violently as they could, but that was a pullback, nothing more than that: main bull trend was still intact.
Another important advice: don't be greedy, always remember to take profits ! Avoid turning a winning trade into a losing one, which is a common mistake traders do.
That's why I decided to include an RSI based Take Profit algorithm inside:
when background is colored by green (and you can't see any bull signal), then you are in over bought region: start taking profits on you buy/long position or close it or set a trailing stop or a stop loss in profit!
when background is colored by red (and you can't see any bear signal), then you are in over sold region: start taking profits on you sell/short position or close it or set a trailing stop or a stop loss in profit!
when price is in a big overbought or oversold region, then you can see a "ob" label or a "os" label respectively
if you are in a bullish trend (you can see it from the trend colored green background as last signal was a "bull" one), "ob" becomes a clear "tp" - Take Profit advice
if you are in a bearish trend (you can see it from the trend colored red background as last signal was a "bear" one), "os" becomes a clear "tp" - Take Profit advice
Here some examples how you can use the signals produced by the indicator in order to be a successful trader.
I circled with pink signals you as supposed to take, then with a "$" pink backgrounded region where you are supposed to take profits, I finally put an X on failing signals, where you would theoretically have been stopped-out.
GBPUSD, 15m
ETHUSD, 1h
TSLA, 5m
BTCUSD, 15m
XAGUSD, 1h
EURUSD, 15m
SPX500, 1h
ETHUSD, 1D
ETHBTC, 6h
This is a premium indicator , so send me a private message in order to get access to this script.

[astropark] Fast Supply Demand Order Blocks FinderDear Followers,
today another awesome Analysis Tool, that you can use both for Swing and Scalping Trading: Fast Supply Demand Order Blocks Finder !
Every time it finds a bullish Order Block (Demand) or a bearish OB (Supply), it shows it immediatelly and when the OB is touched by price, an alert is triggered and a circle is displayed.
Keep in mind that trading Supply and Demand is quite easy:
short/sell at Supply (Bearish OB)
long/buy at Demand (Bullish OB)
short/sell if Demand (Bullish OB) gets broken
long/buy if Supply (Bearish OB) gets broken
This indicator has the resolution option , so you can checkout higher timeframes OBs, whatever timeframe you are.
Also you can refine the OBs finder algo fine tuning some filter options or you can just disable them all.
The indicator keeps track of all previous historic Supplies and Demands , but if too much are shown and you don't like it, you can just cut them by defining a specifc Analysis Starting Date/Time using the specific input options in the indicator settings.
Optionally you can also change lines' color and width, as well as enable/disable the OB hits circles.
Here below you can see some charts that shows how the indicator works on many timeframes, resolutions and markets.
XAUUSD 1h, using 6h resolution - part 1
XAUUSD 1h, using 6h resolution - part 2
XAUUSD 1h, using 6h resolution - part 3
BTCUSD 1h, without using resolution
EURUSD 5m, using 30m resolution
SPX500 5m, using 30m resolution
As I always says, all tools are great if you use them correctly: this is not the "Holy Grail", so always use proper money and risk management strategies.
This is a premium indicator , so send me a private message in order to get access to this script.

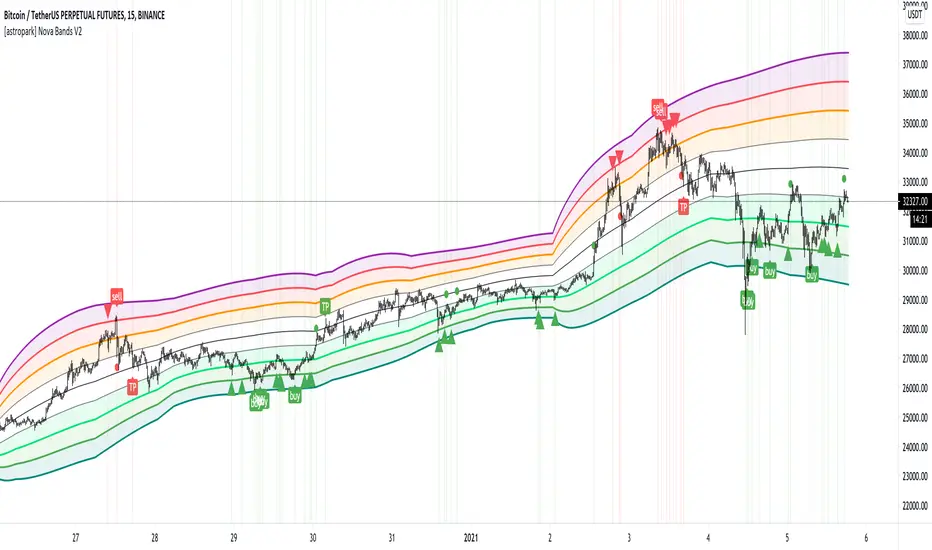
[astropark] Nova Bands V2Dear followers,
today an upgraded version of Nova Bands indicator, here below the previous V1
This is a great analysis and scalping tool for day trading on low timeframes (5-15 minutes) or to plan swing trades on hourly timeframes. It can be used also on high timeframes just for analysis current market trend.
The indicator plots a series of levels which create a nice bands flow.
The slope of levels make you easily understand when price is in consolidation, in uptrend or in downtrend.
The golden rule is always the same: buy low and sell high .
This indicator plots:
3 "price is low here" levels (from dark green to light green)
3 "price is average here" levels
3 "price is high here" levels (from purple to orange)
You can find more details on how to use the indicator in the description of V1.
Please, always remember that:
when bands are flat, price is in consolidation and this is best condition to trade with nova bands
when bands get nearer and nearer is called "Bands Squeeze": price is next to a main breakout move, volatility is coming!
The basic improvement in V2 is a different way to calculate the bands based on different timeframe resolution, default is setup to daily timeframe for example.
A trader who wants to be a winner must understand that money and risk management are very important, so manage your position size and always have a stop loss in your trades.
This is a premium indicator , so send me a private message in order to get access to this script.
Phenom 5.3.1This has been a private script until now. I will be sharing it in order to get some feedback until it is ready to be made "invite only"
WHAT IT IS:
This is a scalping method (mostly) that works on nearly all markets and timeframes. THIS IS A BACKTEST SCRIPT! PLAN ACCORDINGLY!
HOW IT WORKS:
This script uses common indicators (5) in non-standard ways. When combined together, they can give fairly accurate results (40-65%) with acceptable Profit Factor ratings (1.7-3+).
This uses CCI, Moving Average, Stochastic, PSAR, and Bollinger Bands.
With these we have 4 base strategies usable.
Each indicator can be disabled (one at a time).
Each indicator has a SL method (stackable).
Each indicator has a TP method (stackable).
BEST RESULTS:
I have received best results as a scalper on 5min or 1HR timeframes. Mostly used on Index CFD's and CRYPTO markets.
NOT RESPONSIBLE FOR MISUSE OR LOST FUNDS! D.Y.O.R

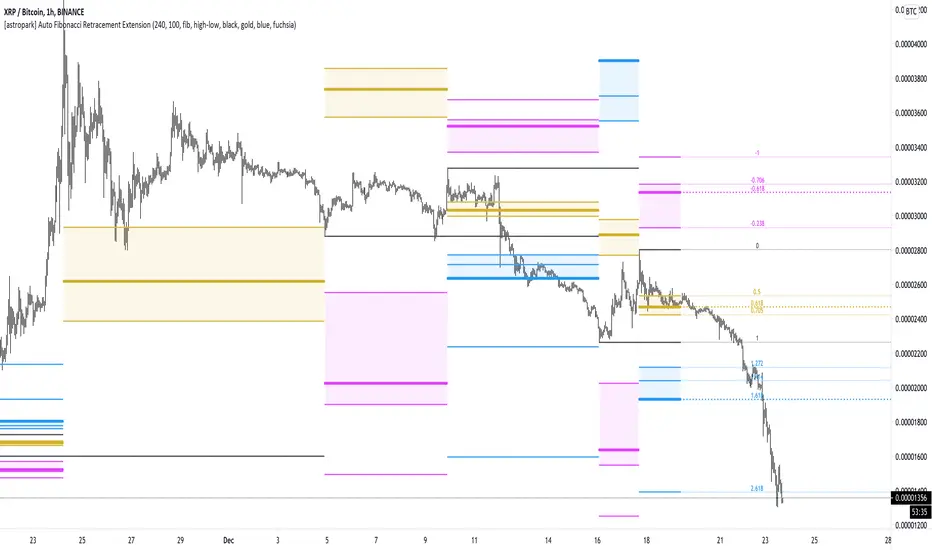
[astropark] Auto Fibonacci Retracement ExtensionDear followers,
today a new analysis tool for day trading, scalping and swing trading: Automatic Fibonacci Retracements and Extensions drawer!
It works on every timeframe and market, as it simply draws automatically most important fibonacci levels on the chart.
Based on the analysis window set (default 100 bars, but you can edit it as you like), it finds recent high and low and start drawing the following levels:
recent high and low (black)
golden retracement range: 0.5 * 0.618 * 0.705 fibonacci retracements (gold)
fibonacci extensions range above 1: 1.272 * 1.424 * 1.618 * 2.618 * 4.236 (blue)
fibonacci extensions range below 0: -0.238 * -0.618 * -0.706 * -1(fuchsia)
Whenever the indicator finds a new high or a new low, al fibonacci levels are re-draw automatically.
The indicator will let you:
change analysis window
enable displaying labels related to current fibonacci levels and/or prices
change colors
show/hide each specific level
How to use the indicator?
Basically, all techniques which apply to fibonacci tool are valid here too.
After a big move up or down, a new high or low is created and a retracement is expected: if trend is strong, retracement to golden ration 0.618 will be a perfect spot for buy or sell respectively in order to continue riding the trend.
In general a bounce is always expected when price hit 0.618 retracement , good to know for scalping traders, while swing trades will continue holding the trade for higher profits.
If the golden retracement range (0.5 - 0.705) is broken and then retested from the other side, a continuation move is expected towards previous high/low (fib level 1) and even more towards the fibonacci extensions range above 1 (1.618 - 2.618 - 4.236).
If the base of bounce and trend continuation on golden retracement range, traders can expect
price to hit again previous high/low and
if trend is strong, a consolidation near the previous high/low range (conditions that are respectively bullish and bearish)
do a further continuation towards -0.618 fib level range
Traders must always understand that
the higher the timeframe, the stronger is the meaning and so the reaction when a specific fibonacci level is hit
don't trade blindly, try to find confluences to have an higher chance to be in a winning trade in near future
money and risk management are very important, so manage your position size and always have a stop loss in your trades
As said, this indicators work on every timeframe and in all markets (Crypto currencies, stocks, FOREX, indexes, commodities). Here some examples:
BTCUSDT 1D: after a long run, a retracement is expected and a bounce at 0.618 golden level is more than obvious: perfect short (sell) entry
BTCUSDT 1D: again as previous example, after a long run, a retracement is expected as well as price's bounces back above
EURUSD 1h: lots of info here, directly in the chart below:
bounces on 0.618 golden zone
double top
price breaks 0.618 level and retests it from below targeting previous low
double bottom and bounce back towards golden zone
bearish consolidation at recent low and further decline towards 1.618 fib extension
AMZN 1h stock: lots of info here too, directly in the chart below:
new high is print, price retrace to golden zone
bounces on 0.618 golden zone
price breaks 0.618 level and retests it from below targeting previous low
double bottom and bounce back towards golden zone
rejection at golden zone, price falling targeting previous low again and probably 1.618 fib extension
price breaks hard previous low and hits fib extension range below recent low
price retraces back up towards new golden retracement range
golden retracement range is broken and used as support: targets are previous high and 1.618 extension
once 1.618 extension level is broken and retested successfully as support, price moves towards 2.618 fibonacci extension level
SPY (SPX500) index: lots of info in the chart
interesting to note that March 2020 huge dump can be totally mapped as a series of fibonacci level bounces, so you understand the importance of riding a trend now, right?
after the low was formed, price retraced perfectly to golden ration 0.618
each time price hit a golden level/range, it retraces creating double top and double bottom configurations too
In the chart below we can see the power of the double bottom at golden retracement level: targets are previous high and -0.618 fibonacci extension level
XAUUSD 15m: as we are in a lower timeframe, the default analysis windows has been reduced to 50.
What can we see here:
golden retracement and price is rejected towards previous low
golden retracement hit and price bounces back lower
new high is formed: golden retracement hit and price bounces back higher
price break previous high and hits fibonacci extensions -0.618 and -1
price continues rising forming a regular bearish divergence with RSI
once uptrend is broken, price falls dramatically
first target is 0.618 retracement level, where you see a very small retracement due to strength of sellers
second target is previous low, which is broken and retested many time from below (bearish retest)
third target is fibonacci extension range (in this case 1.414 is almost hit)
as an hidden bullish divergence with RSI was created, price goes back up
This is a premium indicator , so send me a private message in order to get access to this script.
[astropark] DMI/ADX strategy [alarms]Dear Followers,
today I'm happy to share with you my DMI / ADX Strategy .
It provides directional trend information, so if a bullish or a bearish trend is going to start. Statistically it works better on lower timeframes (from 5 minutes to 1 hour).
It is both a Swing and Scalping Strategy indicator , based on a simple trend following theory , good for trading FOREX, Indexes, Stocks, Commodities and Cryptocurrencies.
To help in Taking Profits, the strategy integrates 2 special other than bull/bear signals:
Overbought and Oversold RSI Signals , which appear both as darker background (the darker the color, the more the price is in overbought/oversold) and green "ob"-"tp" / red "os"-"tp" labels (they optionally pop up only on a configurable stronger overbought/oversold condition) (you can enable/disable it optionally)
Peak Profit Tracker , which resets every time a new trade starts and keeps track of price fluctuation during the trade: the message is don't be too greedy and take profits or lock them with a stoploss in profit (you can enable/disable it optionally)
You can edit many options in order to
have more/less bull/bear signals
enable/disable showing bull/bear signals
enable/disable showing RSI TP signals (you can edit RSI length, overbought (OB) and oversold (OS) levels)
enable/disable showing peak profits on each trade
The user who wants to use this strategy, especially via an automated bot, must always set a stoploss (example 150$ from entry on bitcoin ) or use a proper risk management strategy .
This is not the "Holy Grail", so use it with caution. It's highly suggested to use a proper money management .
This script will let you set all notifications you may need in order to be alerted on each triggered signals.
You can find the strategy version for backtesting here below:
Here there are some examples how this DMI / ADX strategy works on many markets:
LTC/USDT 15m
BTC/USD 15m
BNB/BTC 15m
ETH/USD 15m
GOLD (XAU/USD) 15m
GOLD (XAU/USD) 1h
FB 15m
AAPL 15m
TSLA 1h
BANKNIFTY Index 5m
NIFTY 50 Index 5m
This is a premium indicator , so send me a private message in order to get access to this script .

[astropark] DMI/ADX strategy [strategy]Dear Followers,
today I'm happy to share with you my DMI / ADX Strategy .
It provides directional trend information, so if a bullish or a bearish trend is going to start. Statistically it works better on lower timeframes (from 5 minutes to 1 hour).
It is both a Swing and Scalping Strategy indicator , based on a simple trend following theory , good for trading FOREX, Indexes, Stocks, Commodities and Cryptocurrencies.
To help in Taking Profits, the strategy integrates 2 special other than bull/bear signals:
Overbought and Oversold RSI Signals , which appear both as darker background (the darker the color, the more the price is in overbought/oversold) and green "ob"-"tp" / red "os"-"tp" labels (they optionally pop up only on a configurable stronger overbought/oversold condition) (you can enable/disable it optionally)
Peak Profit Tracker , which resets every time a new trade starts and keeps track of price fluctuation during the trade: the message is don't be too greedy and take profits or lock them with a stoploss in profit (you can enable/disable it optionally)
You can edit many options in order to
have more/less bull/bear signals
enable/disable showing bull/bear signals
enable/disable showing RSI TP signals (you can edit RSI length, overbought (OB) and oversold (OS) levels)
enable/disable showing peak profits on each trade
The user who wants to use this strategy, especially via an automated bot, must always set a stoploss (example 150$ from entry on bitcoin ) or use a proper risk management strategy .
This is not the "Holy Grail", so use it with caution. It's highly suggested to use a proper money management .
This script will let you backtest performance of the indicator based on bear/bull signals.
You can find the alarms version by searching for my DMI / ADX Strategy and choosing the "alarms" named.
Here there are some examples how this DMI / ADX strategy works on many markets:
LTC/USDT 15m
BTC/USD 15m
BNB/BTC 15m
ETH/USD 15m
GOLD (XAU/USD) 15m
GOLD (XAU/USD) 1h
FB 15m
AAPL 15m
TSLA 1h
BANKNIFTY Index 5m
NIFTY 50 Index 5m
This is a premium indicator , so send me a private message in order to get access to this script .

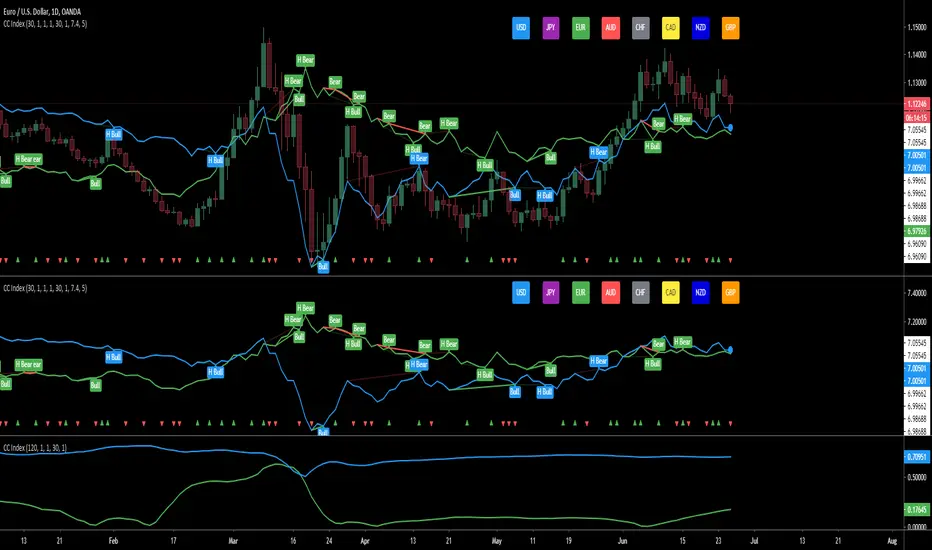
Currency Index - based on Correlation CoefficientThe script is calculating the correlation between the current pair and the corresponding indexes and then displays the driving index based on the higher correlation.
for example: on EURUSD - calculates the correlation between EURUSD with the USD index and the correlation between EURUSD with the EUR index and then displays the winning/driving index.
- the arrows at the bottom are showing when both indexes are going in the same direction
- there are options to show divergences on the winning index
- option to display either the correlation or the winning index
- and option to be able to use while in replay mode for back testing, based on the last close to avoid repainting
- option for the length of the correlation
- the last color of the driving index is related to the index that is being displayed where:
AUD - red
CAD - yellow
CHF - grey
EUR - green
GBP - orange
JPY - magenta
NZD - dark blue
USD - light blue
- it works automatically on all the major pairs
- the last 4 options are for finding divergences between the price and the index
Custom VolumeIdea : Idea of script is getting the volume of index BNF and NIFTY50 ( as Tradingview don't provide the volume information of the indexes )
How it works : Script works on getting the weighted volume of underlying stocks and the plotting them by weight in volume
Benefits:
1. Can server as example how, once can plot the mixed volume of symbols
2. Will help the traders who consider volume also as decision making factor while trading BNF from tradingview chart
3. Can give volume information on any TF **in my knowledge only available for premium users
Important factor to note: Weight of stocks may change time to time depending on Exchange decision.

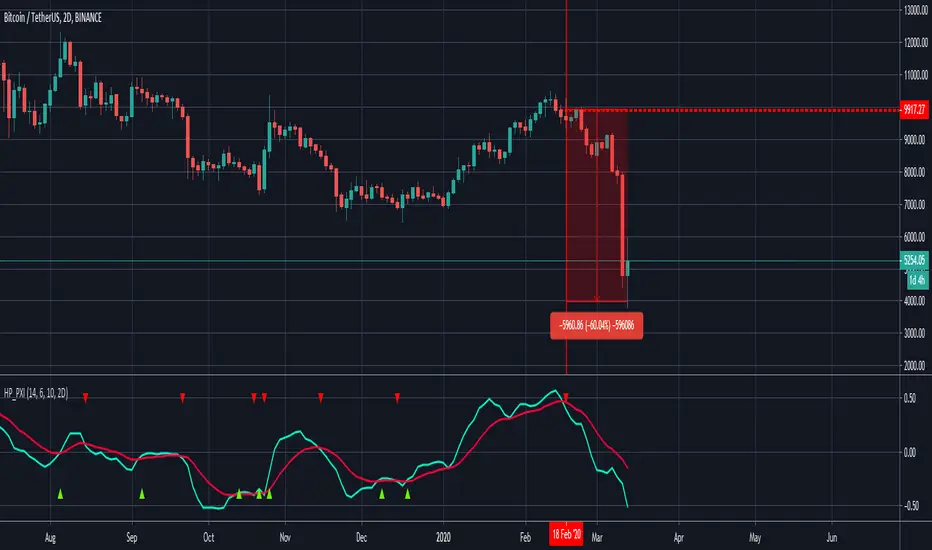
Plutus eXploration Index - PXIGreetings Fellow Traders!
We have developed this simple and easy to use indicator so that all users can benefit from it by:
• Reducing the amount of time spent trading.
• Minimizing the risk of loss.
• Accurate timing on entries and exits.
• Signals are accurate in volatile market conditions.
What is the PXI?
The Plutus eXploration Index falls under the centred momentum oscillator category which means that it fluctuates above and below a central point or line. Apex levels exist, where the indicator will reach a peak, and start moving in the opposite direction. Two lines move in unison and crossovers will signal a buy and a sell.
Setting up the indicator:
Once you have received your invite, the indicator will appear under your "my invite only" scripts in trading view detailed charts screen. Select PXI and add it to your chart. For free accounts on TradingView, the indicator limit is set to x3, so please de-activate something if you hit this limit.
You can access the PXI setting in the string of icons that follow after the indicators name in the top left corner of the indicator chart. In order:
Name | Visibility | Settings | Show source code | Delete | More
Under the settings, there are two tabs. One for the style, which you may freely change to suit your preferences. And then the first tab, for Inputs. The default settings for Long Minima, Short Maxima and Integrated EMA should not be changed.
The critical change to make in the input settings is the time frame !
The time frame on the price chart and the time frame on the indicator have to match! The range of allowable time frames is as follows:
15min | 30min | 1h | 4h | 12h | 1d | 2d | 1week
How to use the PXI:
The apex levels on the oscillator differ for each asset and vary depending on the selected time frame. The signals provided near apex points shall hold more weight. We recommend that traders assess these levels properly before considering a position.
Sell signal: Sell signals occur when the quick line (default blue) crosses over the slow line (default orange) from above.
A red arrow down will mark this point in time out on the chart.
Buy signal: Buy signals occur when the quick line (default blue) crosses the slow line (default orange) from bellow.
A green arrow down will mark this point in time out on the chart.
Maximizing Risk/Reward and profitability:
The indicator strives to keep positions open long enough to reap real rewards in the market. Maximum profit levels naturally occur around the apex points on the indicator chart, and the onus is on the trader to attempt an early exit once these levels are achieved.
Addition points to consider:
Most profitable trading signals occur on the daily time frames while considering the duration of trades and timing of the signals. For the lowest risk levels, weekly time frames are most suitable. From the weekly time frame down, the risk increases incrementally until you reach the 15min time frame. Signals at the lower levels occur more often and they are effective but, they should, however, be monitored closely. Also, the lower the time frame, the higher the chances of false-positive signals.
will not be liable for damages of any kind resulting from your use of or inability to use the indicator or content.
NCTA Trend BiasTrend Bias
The NCTA Trend Bias indicator is designed to show traders the overall directional bias of the market. It is excellent in short 1, 3, and 5 minute timeframes for futures traders and short term options traders. Longer timeframes such as the 5, 10, and 30 minute timeframes work well for options traders.
This indicator is used by displaying it twice on the chart. For 1, 3, and 5 minute charts, one of the Trend Bias indicators is set at Fast and the other is set at Medium.
For 30 min or higher charts, one Trend Bias Indicator is set at Medium and the other one is set at Slow.
The indicator consists of three trend lines; a fast signal, a medium signal, and a slow signal. There is a possible trade entry when the fast signal crosses either the medium and/or slow signals.
HOW TO USE: The most effective way to use this indicator is to have it displayed twice, using the settings described above for the relevant chart timeframe.
When both indicators show the fast line (blue line) crossing above the medium (red) or the slow (green) line, it implies an opportunity to go long or buy a call. When both indicators show the fast line crossing below the medium and/or slow line, it implies an opportunity to go short or buy a put.
The Trend Bias Indicator also provides a powerful directional bias entry when used in alignment with the Awesome Oscillator. Green AO aligned with a long Trend Bias entry or red AO aligned with a short Trend Bias entry.
For information on gaining access to this indicator, please see the link below in our signature field.
RTYZ2019
NASDAQ:AMZN
