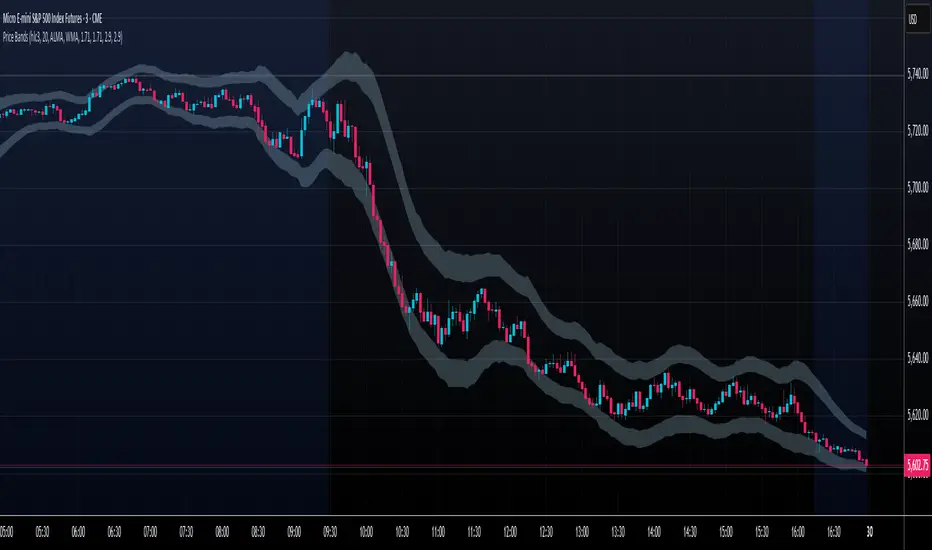
Setup Keltner Banda 3 e 5 - MMS
⚙️ How It Works:
• Calculates a 20-period Simple Moving Average (SMA) as the central line.
• Uses the ATR (Average True Range) to build two volatility bands:
o 3x ATR Band (more sensitive)
o 5x ATR Band (more extreme)
• Detects potential reversals when the price closes outside a band and then re-enters it.
🔍 Signals Generated:
• 🔻 Bearish Reversal: Price re-enters from above the upper band.
• 🔺 Bullish Reversal: Price re-enters from below the lower band.
• Signals are displayed with colored arrows on the chart for easy visual recognition.
🔔 Alerts:
The script also triggers automatic alerts for each type of reversal, so you can be notified in real time.
🧱 Ideal For:
• Traders using Renko, Range, or traditional candlestick charts
• Scalping or swing trading strategies
• Anyone looking for visual confirmation of price exhaustion and potential reversals
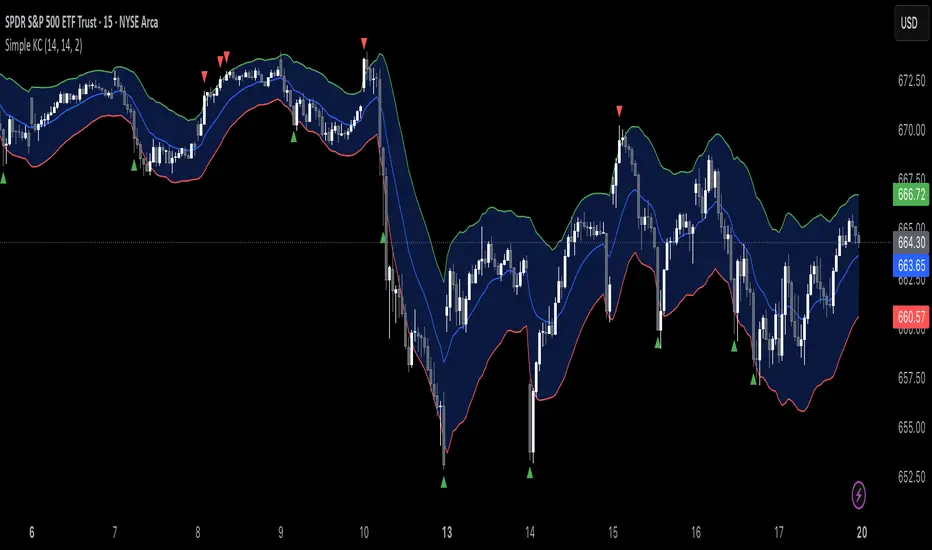
Kênh giá Keltner (KC)

CSS_LFU_v0.1Overview:
A multi-factor, market-adaptive swing strategy designed for intraday and short-term crypto trading. It synthesizes momentum, volatility, and trend signals into a unified composite score over a configurable lookback window. The strategy leverages a modular, signal-weighted approach to ensure robust entry timing while remaining compatible with human-in-the-loop validation and algorithmic execution.
Core Modules:
AJFFRSI (RSX-based Momentum): Measures smoothed price momentum with noise-reduction filters to detect crossovers relative to the QQE trailing stop.
QQE (Quantitative Qualitative Easing RSI): A modified RSI with a dynamic trailing stop that adapts to short-term volatility, identifying exhaustion and potential reversal points.
Keltner Channel Zones: Determines overextension relative to trend, providing buy/sell zones based on ATR-banded EMA.
WaveTrend Oscillator: Confirms short-term swings and market direction through smoothed oscillator cross signals.
Rolling Composite Score: Aggregates module signals over a unified lookback (e.g., 144 bars) to normalize noise and capture consistent trends.
Signal Logic:
Each module outputs a discrete score (+1 / 0 / -1).
The rolling composite score sums all module scores over the lookback period.
Long positions trigger when the rolling score meets or exceeds the long threshold.
Short positions trigger when the rolling score meets or falls below the short threshold.
Multi-dimensional signal aggregation reduces false positives from single indicators.
Rolling lookback ensures score normalization across different volatility regimes.
Highly modular: easy to adapt modules or weights to different instruments or timeframes.
Fully compatible with automated execution pipelines, including custom exchange screener bots.
Use Case:
Ideal for quant-driven altcoin or multi-asset strategies where high-frequency validation is critical and sequential module weighting enhances trend flip detection.

Keltner Channels BandsKeltner Channels Bands - パブリッシュ用説明文
日本語版
タイトル
Keltner Channels Bands (Multi-Timeframe)
説明文
概要
シンプルで視認性の高いケルトナーチャネルインジケーターです。マルチタイムフレーム機能を搭載し、どの時間足でも上位足のケルトナーチャネルを表示できます。
特徴
グレーカラーでチャートを見やすく保持
マルチタイムフレーム対応(デフォルト: 1時間足)
4時間足以上で自動非表示機能(チャートの見やすさを維持)
EMAまたはSMAの選択が可能
ATR倍率とバンド幅を自由にカスタマイズ
トレードコンセプト
ケルトナーチャネルは、価格のボラティリティに基づいたトレンド追従型インジケーターです。
基本的な使い方:
トレンド判定: 価格がバンドの上部で推移している場合は上昇トレンド、下部で推移している場合は下降トレンド
エントリー: 価格がバンド外に出た後、バンド内に戻るタイミングでトレンド方向へエントリー
エグジット: 価格が中心線(MA)に到達、または反対側のバンドに接近した時
ブレイクアウト: バンドを勢いよく突破した場合、新たなトレンドの始まりを示唆
推奨設定:
スイングトレード: Length 20, Multiplier 2.2, 1時間足または4時間足
デイトレード: Length 20, Multiplier 2.0, 5分足または15分足で1時間足を表示
注意事項
このインジケーターは単独での使用ではなく、他のテクニカル指標やプライスアクションと組み合わせて使用することを推奨します。
English Version
Title
Keltner Channels Bands (Multi-Timeframe)
Description
Overview
A simple and visually clean Keltner Channels indicator with multi-timeframe capabilities. Display higher timeframe Keltner Channels on any chart timeframe.
Features
Clean gray color scheme for better chart visibility
Multi-timeframe support (Default: 1-hour)
Auto-hide on 4H+ timeframes to maintain chart clarity
Choice between EMA or SMA
Customizable ATR multiplier and band width
Trading Concept
Keltner Channels is a volatility-based trend-following indicator that helps traders identify trend direction and potential entry/exit points.
Basic Usage:
Trend Identification: Price staying near upper band indicates uptrend; near lower band indicates downtrend
Entry Signals: Enter in trend direction when price returns inside the bands after moving outside
Exit Signals: Consider exits when price reaches the center line (MA) or approaches the opposite band
Breakout Trading: Strong momentum breaks through the bands may signal the start of a new trend
Recommended Settings:
Swing Trading: Length 20, Multiplier 2.2, 1H or 4H timeframe
Day Trading: Length 20, Multiplier 2.0, Display 1H channels on 5M or 15M charts
Disclaimer
This indicator should not be used alone. Combine it with other technical indicators and price action analysis for better trading decisions.

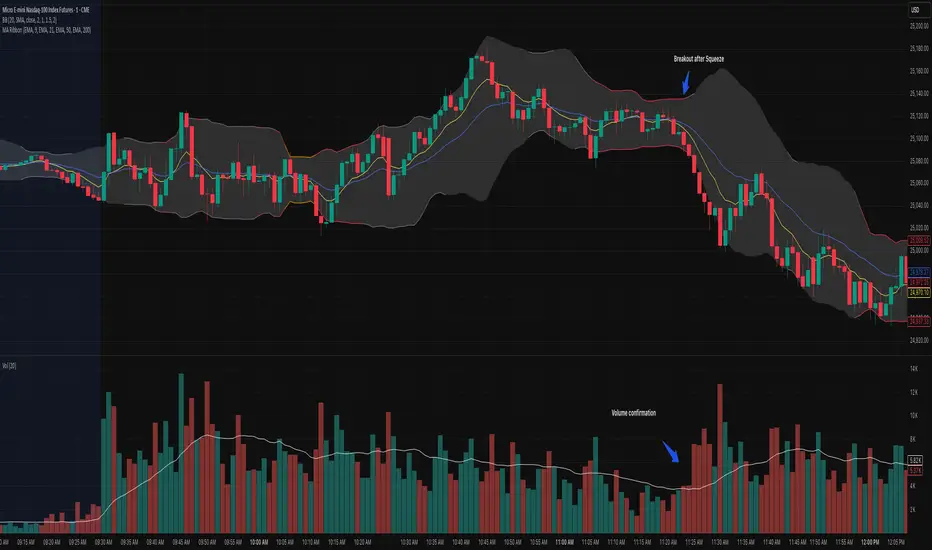
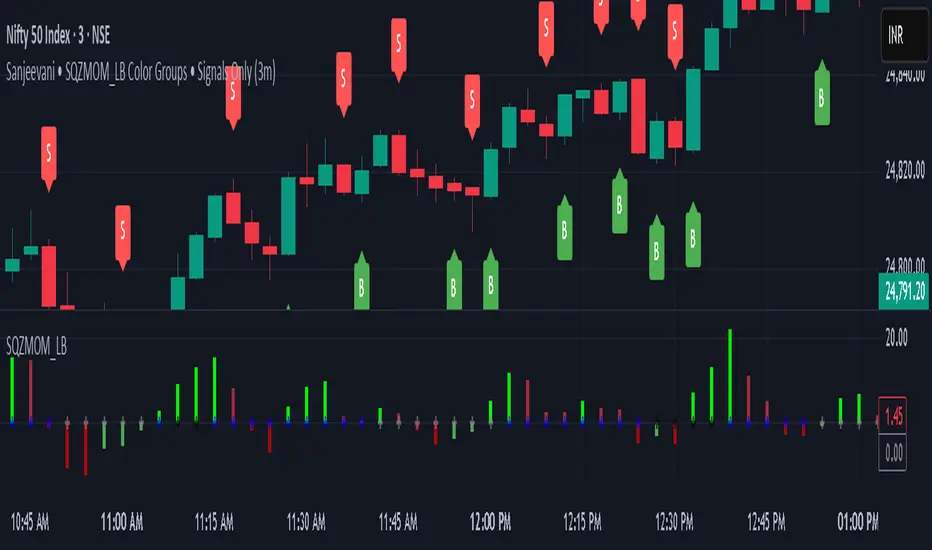
2-Stage Dashboard (SQZPRO Wide + EMA)Dashboard for Darvas Box EMA momentum traders, located in the bottom right, mostly for quickly screening if a setup is viable.
- EMAs are 9 & 21
- SQZPRO set to wide squeezes
Long setup:
- Green SQZPRO row
- Green EMA row
Short setup:
- Green SQZPRO row
- Red EMA row

Emerson v8.4 – Kulture Metrics🜂 Emerson v8.4 – Kulture Metrics
“When volatility breathes, probability answers.”
The Emerson Engine isn’t another indicator—it’s a precision instrument built to exploit the hidden mathematics of motion.
Born from Kulture Metrics’ Nosreme lineage, this model fuses trend architecture, volatility anatomy, and Linetsky’s path-integral weighting into one living signal core. It doesn’t predict — it quantifies belief.
Each trigger passes through three unforgiving filters:
Classical Trend & Momentum Logic — directional strength, pure and unadulterated.
Squeeze Regime Anticipation — volatility compression before the break.
Path-Integral Confirmation — stochastic payoffs weighted by risk-free discounting and volatility density.
The result?
Only signals where the math, the market, and the moment all align — Absolute Confirmations.
No noise. No guessing. No emotion.
In practice, Emerson waits. It calculates. Then it strikes with surgical precision — entries that respect volatility, discount rates, and expected path contributions like a derivatives desk built into your chart.
Each decision point carries the full weight of stochastic probability theory — the same principles driving modern option pricing — yet distilled into something you can read at a glance.
Benefits that separate you from the herd:
✅ Trades filtered by volatility percentile and expected payoff distribution — not gut feel.
✅ Dotted bias line reveals the “probabilistic current” beneath price itself.
✅ Alerts trigger only when logic, momentum, and probability form a unanimous verdict.
✅ Dynamic macro-window shading adapts to volatility pressure in real time.
✅ Every entry inherently respects your risk, target, and discounting horizon.
Emerson v8.4 doesn’t ask the market what’s happening — it tells it what must happen next, given the probabilities.
It’s not designed to comfort. It’s designed to confirm.
Kulture Metrics. Built for traders who understand that randomness is just order not yet resolved.

Volume Weighted Keltner ChannelThis indicator provides a customizable implementation of Keltner Channels (KC), a volatility-based envelope designed to identify trend direction and potential reversal or breakout zones. It allows deep control over its core components and calculation methods.
Key Features:
Customizable Components: This implementation allows for full control over the channel's construction:
Basis Line: Choose from a wide range of moving average types (e.g., EMA, SMA, WMA) for the central line.
Volatility Bands: Select the volatility measure used to construct the bands: Average True Range (ATR), True Range (TR), or bar Range (High-Low).
Volume Weighting: An option (Volume weighted) allows for volume to be incorporated into the calculation of both the basis moving average and the selected volatility measure (e.g., creating a Volume-Weighted ATR). This makes the channel more responsive to moves backed by high market participation.
Logarithmic Scaling: The indicator includes an optional 'Normalize' mode that calculates the channel on a logarithmic scale. This creates bands that represent a constant percentage distance from the basis, making it a suitable tool for analyzing long-term trends in exponential markets.
Multi-Timeframe (MTF) Engine: The indicator includes an MTF conversion block. When a Higher Timeframe (HTF) is selected, advanced options become available: Fill Gaps handles data gaps, and Wait for timeframe to close prevents repainting by ensuring the indicator only updates when the HTF bar closes.
Integrated Alerts: Includes a full set of built-in alerts for the source price crossing over or under the upper band, lower band, and the central basis line.
DISCLAIMER
For Informational/Educational Use Only: This indicator is provided for informational and educational purposes only. It does not constitute financial, investment, or trading advice, nor is it a recommendation to buy or sell any asset.
Use at Your Own Risk: All trading decisions you make based on the information or signals generated by this indicator are made solely at your own risk.
No Guarantee of Performance: Past performance is not an indicator of future results. The author makes no guarantee regarding the accuracy of the signals or future profitability.
No Liability: The author shall not be held liable for any financial losses or damages incurred directly or indirectly from the use of this indicator.
Signals Are Not Recommendations: The alerts and visual signals (e.g., crossovers) generated by this tool are not direct recommendations to buy or sell. They are technical observations for your own analysis and consideration.

Mean Reversion Trading V1Overview
This is a simple mean reversion strategy that combines RSI, Keltner Channels, and MACD Histograms to predict reversals. Current parameters were optimized for NASDAQ 15M and performance varies depending on asset. The strategy can be optimized for specific asset and timeframe.
How it works
Long Entry (All must be true):
1. RSI < Lower Threshold
2. Close < Lower KC Band
3. MACD Histogram > 0 and rising
4. No open trades
Short Entry (All must be true):
1. RSI > Upper Threshold
2. Close > Upper KC Band
3. MACD Histogram < 0 and falling
4. No open trades
Long Exit:
1. Stop Loss: Average position size x ( 1 - SL percent)
2. Take Profit: Average position size x ( 1 + TP percent)
3. MACD Histogram crosses below zero
Short Exit:
1. Stop Loss: Average position size x ( 1 + SL percent)
2. Take Profit: Average position size x ( 1 - TP percent)
3. MACD Histogram crosses above zero
Settings and parameters are explained in the tooltips.
Important
Initial capital is set as 100,000 by default and 100 percent equity is used for trades

Simple Keltner ChannelsThis script is just a fun little project I decided to do. It serves as a way for me to practice my coding and was not made with the intent of making money.
Bollinger Bands Squeeze📈 Bollinger Bands Squeeze
This indicator enhances traditional Bollinger Bands by integrating Keltner Channel layers to visualize market compression and volatility expansion — allowing traders to easily identify when a squeeze is building or releasing.
🔍 Overview
This is a refined version of the classic Bollinger Bands, designed to detect volatility squeezes using multiple Keltner Channel thresholds.
The script plots standard Bollinger Bands and dynamically colors the bands according to the degree of compression relative to the Keltner Channels.
⚙️ How It Works
Bollinger Bands are calculated from a selected moving average (SMA, EMA, SMMA, WMA, or VWMA) and standard deviation multiplier.
Keltner Channels are derived from ATR (True Range) using three sensitivity levels (1.0, 1.5, and 2.0× multipliers).
When Bollinger Bands contract inside a Keltner Channel, the script marks a squeeze state:
🟠 High Compression (Orange): Very tight volatility — expect breakout soon.
🔴 Mid Compression (Red): Moderate contraction — volatility is building.
⚫ Low Compression (Gray/Black): Early compression phase.
🧩 Inputs & Customization
Length : Period for both Bollinger and Keltner calculations.
Basis MA Type: Choose from SMA, EMA, SMMA (RMA), WMA, or VWMA.
StdDev Multiplier : Controls Bollinger Bandwidth.
Keltner Multipliers (1.0 / 1.5 / 2.0) : Adjust compression thresholds.
Offset : Shifts the bands visually on the chart.
🕹️ Best Use Cases
Identify pre-breakout conditions before volatility expansion.
Combine with volume, momentum, or trend indicators (e.g., RSI) for confirmation.
Ideal for scalping, breakout trading, or volatility-based entries during session opens.
Keltner Channel Enhanced [DCAUT]█ Keltner Channel Enhanced
📊 ORIGINALITY & INNOVATION
The Keltner Channel Enhanced represents an important advancement over standard Keltner Channel implementations by introducing dual flexibility in moving average selection for both the middle band and ATR calculation. While traditional Keltner Channels typically use EMA for the middle band and RMA (Wilder's smoothing) for ATR, this enhanced version provides access to 25+ moving average algorithms for both components, enabling traders to fine-tune the indicator's behavior to match specific market characteristics and trading approaches.
Key Advancements:
Dual MA Algorithm Flexibility: Independent selection of moving average types for middle band (25+ options) and ATR smoothing (25+ options), allowing optimization of both trend identification and volatility measurement separately
Enhanced Trend Sensitivity: Ability to use faster algorithms (HMA, T3) for middle band while maintaining stable volatility measurement with traditional ATR smoothing, or vice versa for different trading strategies
Adaptive Volatility Measurement: Choice of ATR smoothing algorithm affects channel responsiveness to volatility changes, from highly reactive (SMA, EMA) to smoothly adaptive (RMA, TEMA)
Comprehensive Alert System: Five distinct alert conditions covering breakouts, trend changes, and volatility expansion, enabling automated monitoring without constant chart observation
Multi-Timeframe Compatibility: Works effectively across all timeframes from intraday scalping to long-term position trading, with independent optimization of trend and volatility components
This implementation addresses key limitations of standard Keltner Channels: fixed EMA/RMA combination may not suit all market conditions or trading styles. By decoupling the trend component from volatility measurement and allowing independent algorithm selection, traders can create highly customized configurations for specific instruments and market phases.
📐 MATHEMATICAL FOUNDATION
Keltner Channel Enhanced uses a three-component calculation system that combines a flexible moving average middle band with ATR-based (Average True Range) upper and lower channels, creating volatility-adjusted trend-following bands.
Core Calculation Process:
1. Middle Band (Basis) Calculation:
The basis line is calculated using the selected moving average algorithm applied to the price source over the specified period:
basis = ma(source, length, maType)
Supported algorithms include EMA (standard choice, trend-biased), SMA (balanced and symmetric), HMA (reduced lag), WMA, VWMA, TEMA, T3, KAMA, and 17+ others.
2. Average True Range (ATR) Calculation:
ATR measures market volatility by calculating the average of true ranges over the specified period:
trueRange = max(high - low, abs(high - close ), abs(low - close ))
atrValue = ma(trueRange, atrLength, atrMaType)
ATR smoothing algorithm significantly affects channel behavior, with options including RMA (standard, very smooth), SMA (moderate smoothness), EMA (fast adaptation), TEMA (smooth yet responsive), and others.
3. Channel Calculation:
Upper and lower channels are positioned at specified multiples of ATR from the basis:
upperChannel = basis + (multiplier × atrValue)
lowerChannel = basis - (multiplier × atrValue)
Standard multiplier is 2.0, providing channels that dynamically adjust width based on market volatility.
Keltner Channel vs. Bollinger Bands - Key Differences:
While both indicators create volatility-based channels, they use fundamentally different volatility measures:
Keltner Channel (ATR-based):
Uses Average True Range to measure actual price movement volatility
Incorporates gaps and limit moves through true range calculation
More stable in trending markets, less prone to extreme compression
Better reflects intraday volatility and trading range
Typically fewer band touches, making touches more significant
More suitable for trend-following strategies
Bollinger Bands (Standard Deviation-based):
Uses statistical standard deviation to measure price dispersion
Based on closing prices only, doesn't account for intraday range
Can compress significantly during consolidation (squeeze patterns)
More touches in ranging markets
Better suited for mean-reversion strategies
Provides statistical probability framework (95% within 2 standard deviations)
Algorithm Combination Effects:
The interaction between middle band MA type and ATR MA type creates different indicator characteristics:
Trend-Focused Configuration (Fast MA + Slow ATR): Middle band uses HMA/EMA/T3, ATR uses RMA/TEMA, quick trend changes with stable channel width, suitable for trend-following
Volatility-Focused Configuration (Slow MA + Fast ATR): Middle band uses SMA/WMA, ATR uses EMA/SMA, stable trend with dynamic channel width, suitable for volatility trading
Balanced Configuration (Standard EMA/RMA): Classic Keltner Channel behavior, time-tested combination, suitable for general-purpose trend following
Adaptive Configuration (KAMA + KAMA): Self-adjusting indicator responding to efficiency ratio, suitable for markets with varying trend strength and volatility regimes
📊 COMPREHENSIVE SIGNAL ANALYSIS
Keltner Channel Enhanced provides multiple signal categories optimized for trend-following and breakout strategies.
Channel Position Signals:
Upper Channel Interaction:
Price Touching Upper Channel: Strong bullish momentum, price moving more than typical volatility range suggests, potential continuation signal in established uptrends
Price Breaking Above Upper Channel: Exceptional strength, price exceeding normal volatility expectations, consider adding to long positions or tightening trailing stops
Price Riding Upper Channel: Sustained strong uptrend, characteristic of powerful bull moves, stay with trend and avoid premature profit-taking
Price Rejection at Upper Channel: Momentum exhaustion signal, consider profit-taking on longs or waiting for pullback to middle band for reentry
Lower Channel Interaction:
Price Touching Lower Channel: Strong bearish momentum, price moving more than typical volatility range suggests, potential continuation signal in established downtrends
Price Breaking Below Lower Channel: Exceptional weakness, price exceeding normal volatility expectations, consider adding to short positions or protecting against further downside
Price Riding Lower Channel: Sustained strong downtrend, characteristic of powerful bear moves, stay with trend and avoid premature covering
Price Rejection at Lower Channel: Momentum exhaustion signal, consider covering shorts or waiting for bounce to middle band for reentry
Middle Band (Basis) Signals:
Trend Direction Confirmation:
Price Above Basis: Bullish trend bias, middle band acts as dynamic support in uptrends, consider long positions or holding existing longs
Price Below Basis: Bearish trend bias, middle band acts as dynamic resistance in downtrends, consider short positions or avoiding longs
Price Crossing Above Basis: Potential trend change from bearish to bullish, early signal to establish long positions
Price Crossing Below Basis: Potential trend change from bullish to bearish, early signal to establish short positions or exit longs
Pullback Trading Strategy:
Uptrend Pullback: Price pulls back from upper channel to middle band, finds support, and resumes upward, ideal long entry point
Downtrend Bounce: Price bounces from lower channel to middle band, meets resistance, and resumes downward, ideal short entry point
Basis Test: Strong trends often show price respecting the middle band as support/resistance on pullbacks
Failed Test: Price breaking through middle band against trend direction signals potential reversal
Volatility-Based Signals:
Narrow Channels (Low Volatility):
Consolidation Phase: Channels contract during periods of reduced volatility and directionless price action
Breakout Preparation: Narrow channels often precede significant directional moves as volatility cycles
Trading Approach: Reduce position sizes, wait for breakout confirmation, avoid range-bound strategies within channels
Breakout Direction: Monitor for price breaking decisively outside channel range with expanding width
Wide Channels (High Volatility):
Trending Phase: Channels expand during strong directional moves and increased volatility
Momentum Confirmation: Wide channels confirm genuine trend with substantial volatility backing
Trading Approach: Trend-following strategies excel, wider stops necessary, mean-reversion strategies risky
Exhaustion Signs: Extreme channel width (historical highs) may signal approaching consolidation or reversal
Advanced Pattern Recognition:
Channel Walking Pattern:
Upper Channel Walk: Price consistently touches or exceeds upper channel while staying above basis, very strong uptrend signal, hold longs aggressively
Lower Channel Walk: Price consistently touches or exceeds lower channel while staying below basis, very strong downtrend signal, hold shorts aggressively
Basis Support/Resistance: During channel walks, price typically uses middle band as support/resistance on minor pullbacks
Pattern Break: Price crossing basis during channel walk signals potential trend exhaustion
Squeeze and Release Pattern:
Squeeze Phase: Channels narrow significantly, price consolidates near middle band, volatility contracts
Direction Clues: Watch for price positioning relative to basis during squeeze (above = bullish bias, below = bearish bias)
Release Trigger: Price breaking outside narrow channel range with expanding width confirms breakout
Follow-Through: Measure squeeze height and project from breakout point for initial profit targets
Channel Expansion Pattern:
Breakout Confirmation: Rapid channel widening confirms volatility increase and genuine trend establishment
Entry Timing: Enter positions early in expansion phase before trend becomes overextended
Risk Management: Use channel width to size stops appropriately, wider channels require wider stops
Basis Bounce Pattern:
Clean Bounce: Price touches middle band and immediately reverses, confirms trend strength and entry opportunity
Multiple Bounces: Repeated basis bounces indicate strong, sustainable trend
Bounce Failure: Price penetrating basis signals weakening trend and potential reversal
Divergence Analysis:
Price/Channel Divergence: Price makes new high/low while staying within channel (not reaching outer band), suggests momentum weakening
Width/Price Divergence: Price breaks to new extremes but channel width contracts, suggests move lacks conviction
Reversal Signal: Divergences often precede trend reversals or significant consolidation periods
Multi-Timeframe Analysis:
Keltner Channels work particularly well in multi-timeframe trend-following approaches:
Three-Timeframe Alignment:
Higher Timeframe (Weekly/Daily): Identify major trend direction, note price position relative to basis and channels
Intermediate Timeframe (Daily/4H): Identify pullback opportunities within higher timeframe trend
Lower Timeframe (4H/1H): Time precise entries when price touches middle band or lower channel (in uptrends) with rejection
Optimal Entry Conditions:
Best Long Entries: Higher timeframe in uptrend (price above basis), intermediate timeframe pulls back to basis, lower timeframe shows rejection at middle band or lower channel
Best Short Entries: Higher timeframe in downtrend (price below basis), intermediate timeframe bounces to basis, lower timeframe shows rejection at middle band or upper channel
Risk Management: Use higher timeframe channel width to set position sizing, stops below/above higher timeframe channels
🎯 STRATEGIC APPLICATIONS
Keltner Channel Enhanced excels in trend-following and breakout strategies across different market conditions.
Trend Following Strategy:
Setup Requirements:
Identify established trend with price consistently on one side of basis line
Wait for pullback to middle band (basis) or brief penetration through it
Confirm trend resumption with price rejection at basis and move back toward outer channel
Enter in trend direction with stop beyond basis line
Entry Rules:
Uptrend Entry:
Price pulls back from upper channel to middle band, shows support at basis (bullish candlestick, momentum divergence)
Enter long on rejection/bounce from basis with stop 1-2 ATR below basis
Aggressive: Enter on first touch; Conservative: Wait for confirmation candle
Downtrend Entry:
Price bounces from lower channel to middle band, shows resistance at basis (bearish candlestick, momentum divergence)
Enter short on rejection/reversal from basis with stop 1-2 ATR above basis
Aggressive: Enter on first touch; Conservative: Wait for confirmation candle
Trend Management:
Trailing Stop: Use basis line as dynamic trailing stop, exit if price closes beyond basis against position
Profit Taking: Take partial profits at opposite channel, move stops to basis
Position Additions: Add to winners on subsequent basis bounces if trend intact
Breakout Strategy:
Setup Requirements:
Identify consolidation period with contracting channel width
Monitor price action near middle band with reduced volatility
Wait for decisive breakout beyond channel range with expanding width
Enter in breakout direction after confirmation
Breakout Confirmation:
Price breaks clearly outside channel (upper for longs, lower for shorts), channel width begins expanding from contracted state
Volume increases significantly on breakout (if using volume analysis)
Price sustains outside channel for multiple bars without immediate reversal
Entry Approaches:
Aggressive: Enter on initial break with stop at opposite channel or basis, use smaller position size
Conservative: Wait for pullback to broken channel level, enter on rejection and resumption, tighter stop
Volatility-Based Position Sizing:
Adjust position sizing based on channel width (ATR-based volatility):
Wide Channels (High ATR): Reduce position size as stops must be wider, calculate position size using ATR-based risk calculation: Risk / (Stop Distance in ATR × ATR Value)
Narrow Channels (Low ATR): Increase position size as stops can be tighter, be cautious of impending volatility expansion
ATR-Based Risk Management: Use ATR-based risk calculations, position size = 0.01 × Capital / (2 × ATR), use multiples of ATR (1-2 ATR) for adaptive stops
Algorithm Selection Guidelines:
Different market conditions benefit from different algorithm combinations:
Strong Trending Markets: Middle band use EMA or HMA, ATR use RMA, capture trends quickly while maintaining stable channel width
Choppy/Ranging Markets: Middle band use SMA or WMA, ATR use SMA or WMA, avoid false trend signals while identifying genuine reversals
Volatile Markets: Middle band and ATR both use KAMA or FRAMA, self-adjusting to changing market conditions reduces manual optimization
Breakout Trading: Middle band use SMA, ATR use EMA or SMA, stable trend with dynamic channels highlights volatility expansion early
Scalping/Day Trading: Middle band use HMA or T3, ATR use EMA or TEMA, both components respond quickly
Position Trading: Middle band use EMA/TEMA/T3, ATR use RMA or TEMA, filter out noise for long-term trend-following
📋 DETAILED PARAMETER CONFIGURATION
Understanding and optimizing parameters is essential for adapting Keltner Channel Enhanced to specific trading approaches.
Source Parameter:
Close (Most Common): Uses closing price, reflects daily settlement, best for end-of-day analysis and position trading, standard choice
HL2 (Median Price): Smooths out closing bias, better represents full daily range in volatile markets, good for swing trading
HLC3 (Typical Price): Gives more weight to close while including full range, popular for intraday applications, slightly more responsive than HL2
OHLC4 (Average Price): Most comprehensive price representation, smoothest option, good for gap-prone markets or highly volatile instruments
Length Parameter:
Controls the lookback period for middle band (basis) calculation:
Short Periods (10-15): Very responsive to price changes, suitable for day trading and scalping, higher false signal rate
Standard Period (20 - Default): Represents approximately one month of trading, good balance between responsiveness and stability, suitable for swing and position trading
Medium Periods (30-50): Smoother trend identification, fewer false signals, better for position trading and longer holding periods
Long Periods (50+): Very smooth, identifies major trends only, minimal false signals but significant lag, suitable for long-term investment
Optimization by Timeframe: 1-15 minute charts use 10-20 period, 30-60 minute charts use 20-30 period, 4-hour to daily charts use 20-40 period, weekly charts use 20-30 weeks.
ATR Length Parameter:
Controls the lookback period for Average True Range calculation, affecting channel width:
Short ATR Periods (5-10): Very responsive to recent volatility changes, standard is 10 (Keltner's original specification), may be too reactive in whipsaw conditions
Standard ATR Period (10 - Default): Chester Keltner's original specification, good balance between responsiveness and stability, most widely used
Medium ATR Periods (14-20): Smoother channel width, ATR 14 aligns with Wilder's original ATR specification, good for position trading
Long ATR Periods (20+): Very smooth channel width, suitable for long-term trend-following
Length vs. ATR Length Relationship: Equal values (20/20) provide balanced responsiveness, longer ATR (20/14) gives more stable channel width, shorter ATR (20/10) is standard configuration, much shorter ATR (20/5) creates very dynamic channels.
Multiplier Parameter:
Controls channel width by setting ATR multiples:
Lower Values (1.0-1.5): Tighter channels with frequent price touches, more trading signals, higher false signal rate, better for range-bound and mean-reversion strategies
Standard Value (2.0 - Default): Chester Keltner's recommended setting, good balance between signal frequency and reliability, suitable for both trending and ranging strategies
Higher Values (2.5-3.0): Wider channels with less frequent touches, fewer but potentially higher-quality signals, better for strong trending markets
Market-Specific Optimization: High volatility markets (crypto, small-caps) use 2.5-3.0 multiplier, medium volatility markets (major forex, large-caps) use 2.0 multiplier, low volatility markets (bonds, utilities) use 1.5-2.0 multiplier.
MA Type Parameter (Middle Band):
Critical selection that determines trend identification characteristics:
EMA (Exponential Moving Average - Default): Standard Keltner Channel choice, Chester Keltner's original specification, emphasizes recent prices, faster response to trend changes, suitable for all timeframes
SMA (Simple Moving Average): Equal weighting of all data points, no directional bias, slower than EMA, better for ranging markets and mean-reversion
HMA (Hull Moving Average): Minimal lag with smooth output, excellent for fast trend identification, best for day trading and scalping
TEMA (Triple Exponential Moving Average): Advanced smoothing with reduced lag, responsive to trends while filtering noise, suitable for volatile markets
T3 (Tillson T3): Very smooth with minimal lag, excellent for established trend identification, suitable for position trading
KAMA (Kaufman Adaptive Moving Average): Automatically adjusts speed based on market efficiency, slow in ranging markets, fast in trends, suitable for markets with varying conditions
ATR MA Type Parameter:
Determines how Average True Range is smoothed, affecting channel width stability:
RMA (Wilder's Smoothing - Default): J. Welles Wilder's original ATR smoothing method, very smooth, slow to adapt to volatility changes, provides stable channel width
SMA (Simple Moving Average): Equal weighting, moderate smoothness, faster response to volatility changes than RMA, more dynamic channel width
EMA (Exponential Moving Average): Emphasizes recent volatility, quick adaptation to new volatility regimes, very responsive channel width changes
TEMA (Triple Exponential Moving Average): Smooth yet responsive, good balance for varying volatility, suitable for most trading styles
Parameter Combination Strategies:
Conservative Trend-Following: Length 30/ATR Length 20/Multiplier 2.5, MA Type EMA or TEMA/ATR MA Type RMA, smooth trend with stable wide channels, suitable for position trading
Standard Balanced Approach: Length 20/ATR Length 10/Multiplier 2.0, MA Type EMA/ATR MA Type RMA, classic Keltner Channel configuration, suitable for general purpose swing trading
Aggressive Day Trading: Length 10-15/ATR Length 5-7/Multiplier 1.5-2.0, MA Type HMA or EMA/ATR MA Type EMA or SMA, fast trend with dynamic channels, suitable for scalping and day trading
Breakout Specialist: Length 20-30/ATR Length 5-10/Multiplier 2.0, MA Type SMA or WMA/ATR MA Type EMA or SMA, stable trend with responsive channel width
Adaptive All-Conditions: Length 20/ATR Length 10/Multiplier 2.0, MA Type KAMA or FRAMA/ATR MA Type KAMA or TEMA, self-adjusting to market conditions
Offset Parameter:
Controls horizontal positioning of channels on chart. Positive values shift channels to the right (future) for visual projection, negative values shift left (past) for historical analysis, zero (default) aligns with current price bars for real-time signal analysis. Offset affects only visual display, not alert conditions or actual calculations.
📈 PERFORMANCE ANALYSIS & COMPETITIVE ADVANTAGES
Keltner Channel Enhanced provides improvements over standard implementations while maintaining proven effectiveness.
Response Characteristics:
Standard EMA/RMA Configuration: Moderate trend lag (approximately 0.4 × length periods), smooth and stable channel width from RMA smoothing, good balance for most market conditions
Fast HMA/EMA Configuration: Approximately 60% reduction in trend lag compared to EMA, responsive channel width from EMA ATR smoothing, suitable for quick trend changes and breakouts
Adaptive KAMA/KAMA Configuration: Variable lag based on market efficiency, automatic adjustment to trending vs. ranging conditions, self-optimizing behavior reduces manual intervention
Comparison with Traditional Keltner Channels:
Enhanced Version Advantages:
Dual Algorithm Flexibility: Independent MA selection for trend and volatility vs. fixed EMA/RMA, separate tuning of trend responsiveness and channel stability
Market Adaptation: Choose configurations optimized for specific instruments and conditions, customize for scalping, swing, or position trading preferences
Comprehensive Alerts: Enhanced alert system including channel expansion detection
Traditional Version Advantages:
Simplicity: Fewer parameters, easier to understand and implement
Standardization: Fixed EMA/RMA combination ensures consistency across users
Research Base: Decades of backtesting and research on standard configuration
When to Use Enhanced Version: Trading multiple instruments with different characteristics, switching between trending and ranging markets, employing different strategies, algorithm-based trading systems requiring customization, seeking optimization for specific trading style and timeframe.
When to Use Standard Version: Beginning traders learning Keltner Channel concepts, following published research or trading systems, preferring simplicity and standardization, wanting to avoid optimization and curve-fitting risks.
Performance Across Market Conditions:
Strong Trending Markets: EMA or HMA basis with RMA or TEMA ATR smoothing provides quicker trend identification, pullbacks to basis offer excellent entry opportunities
Choppy/Ranging Markets: SMA or WMA basis with RMA ATR smoothing and lower multipliers, channel bounce strategies work well, avoid false breakouts
Volatile Markets: KAMA or FRAMA with EMA or TEMA, adaptive algorithms excel by automatic adjustment, wider multipliers (2.5-3.0) accommodate large price swings
Low Volatility/Consolidation: Channels narrow significantly indicating consolidation, algorithm choice less impactful, focus on detecting channel width contraction for breakout preparation
Keltner Channel vs. Bollinger Bands - Usage Comparison:
Favor Keltner Channels When: Trend-following is primary strategy, trading volatile instruments with gaps, want ATR-based volatility measurement, prefer fewer higher-quality channel touches, seeking stable channel width during trends.
Favor Bollinger Bands When: Mean-reversion is primary strategy, trading instruments with limited gaps, want statistical framework based on standard deviation, need squeeze patterns for breakout identification, prefer more frequent trading opportunities.
Use Both Together: Bollinger Band squeeze + Keltner Channel breakout is powerful combination, price outside Bollinger Bands but inside Keltner Channels indicates moderate signal, price outside both indicates very strong signal, Bollinger Bands for entries and Keltner Channels for trend confirmation.
Limitations and Considerations:
General Limitations:
Lagging Indicator: All moving averages lag price, even with reduced-lag algorithms
Trend-Dependent: Works best in trending markets, less effective in choppy conditions
No Direction Prediction: Indicates volatility and deviation, not future direction, requires confirmation
Enhanced Version Specific Considerations:
Optimization Risk: More parameters increase risk of curve-fitting historical data
Complexity: Additional choices may overwhelm beginning traders
Backtesting Challenges: Different algorithms produce different historical results
Mitigation Strategies:
Use Confirmation: Combine with momentum indicators (RSI, MACD), volume, or price action
Test Parameter Robustness: Ensure parameters work across range of values, not just optimized ones
Multi-Timeframe Analysis: Confirm signals across different timeframes
Proper Risk Management: Use appropriate position sizing and stops
Start Simple: Begin with standard EMA/RMA before exploring alternatives
Optimal Usage Recommendations:
For Maximum Effectiveness:
Start with standard EMA/RMA configuration to understand classic behavior
Experiment with alternatives on demo account or paper trading
Match algorithm combination to market condition and trading style
Use channel width analysis to identify market phases
Combine with complementary indicators for confirmation
Implement strict risk management using ATR-based position sizing
Focus on high-quality setups rather than trading every signal
Respect the trend: trade with basis direction for higher probability
Complementary Indicators:
RSI or Stochastic: Confirm momentum at channel extremes
MACD: Confirm trend direction and momentum shifts
Volume: Validate breakouts and trend strength
ADX: Measure trend strength, avoid Keltner signals in weak trends
Support/Resistance: Combine with traditional levels for high-probability setups
Bollinger Bands: Use together for enhanced breakout and volatility analysis
USAGE NOTES
This indicator is designed for technical analysis and educational purposes. Keltner Channel Enhanced has limitations and should not be used as the sole basis for trading decisions. While the flexible moving average selection for both trend and volatility components provides valuable adaptability across different market conditions, algorithm performance varies with market conditions, and past characteristics do not guarantee future results.
Key considerations:
Always use multiple forms of analysis and confirmation before entering trades
Backtest any parameter combination thoroughly before live trading
Be aware that optimization can lead to curve-fitting if not done carefully
Start with standard EMA/RMA settings and adjust only when specific conditions warrant
Understand that no moving average algorithm can eliminate lag entirely
Consider market regime (trending, ranging, volatile) when selecting parameters
Use ATR-based position sizing and risk management on every trade
Keltner Channels work best in trending markets, less effective in choppy conditions
Respect the trend direction indicated by price position relative to basis line
The enhanced flexibility of dual algorithm selection provides powerful tools for adaptation but requires responsible use, thorough understanding of how different algorithms behave under various market conditions, and disciplined risk management.

BBKC Combined Channels OverlayBBKC Combined Channels Overlay (Volatility & Mean Reversion)This indicator provides a clean, single-view envelope combining the Bollinger Bands (BB) and Keltner Channels (KC) directly onto your price chart. It is an essential tool for traders operating with Volatility Compression (The Squeeze) and Mean Reversion strategies in fast-moving markets like Futures, High BTC Beta Equities, and Crypto. The goal of this tool is twofold: to visually frame the market's current volatility state and to identify high-probability entry points based on expansion or extreme contraction. How to Use the BBKC Overlay: Spotting the Squeeze (Accumulation Phase):The Squeeze is identified when the Bollinger Bands (BB) contract and fit inside the Keltner Channels (KC).The area is clearly marked with a subtle Orange Background Highlight on the main chart. This is the Accumulation phase, signaling low volatility before a potential large directional move. Trading Mean Reversion: When price pushes aggressively outside the outermost bands (the BB Upper/Lower), it signals an extreme volatility expansion and over-extension. This is a strong setup for mean reversion—a high-probability trade targeting a snap-back towards the central Basis Line (SMA).Customizing for Extreme Compression: For traders looking only for the tightest, highest-probability Squeezes, adjust the following setting: KC Multiplier (ATR): Lower this value from the default of 1.5 down to 1.25 or 1.0. This narrows the KC, forcing the Bollinger Bands to contract even further to trigger the Squeeze signal, thus filtering for only the most minimal volatility. Recommended Synergy: For a complete volatility system, pair this BBKC Combined Channels Overlay (your visualization tool) with the BBKC Squeeze Indicator (the sub-pane momentum histogram).Overlay (Main Chart): Shows where the Squeeze is occurring and identifies mean reversion targets. Squeeze Indicator (Lower Pane): Shows if the Squeeze is active and the directional momentum building up, helping you time the breakout entry for the Manipulation/Distribution phase.

Bollinger Keltner Squeeze Indicator (BBKC)Bollinger Keltner Squeeze Indicator (BBKC)This single-pane indicator combines the power of Bollinger Bands (BB) and Keltner Channels (KC) to accurately identify periods of low volatility compression—the famous Squeeze—which often precedes large, directional moves.Designed for traders utilizing Accumulation, Manipulation, Distribution (AMD) strategies, this tool makes spotting the 'Accumulation' phase simple and visually clear, perfect for high BTC Beta equities or futures markets like MES and MNQ.Key Features:Clear Squeeze Visualization:The background of the main chart is shaded Orange when the Squeeze is active (BB is inside KC). This immediately highlights periods of extreme compression.A simple Red/Green Dot below the chart confirms the Squeeze state (Red = Squeeze ON, Green = Squeeze OFF).Momentum Histogram:A built-in momentum oscillator smooths price action and guides the anticipated direction of the breakout.Teal/Orange Bars: Indicate momentum direction while the Squeeze is active (building pressure).Bright Green/Red Bars: Indicate momentum direction after the Squeeze has broken (expansion/breakout).How to Find Maximum Volatility Compression (The "Tightest" Squeeze)To align this indicator with a strategy focused on catching only the most extreme volatility compression—the key to those explosive moves—traders should adjust the Keltner Channel Multiplier setting.Setting Name: KC Multiplier (ATR)Default Value: 1.5Recommended Adjustment: To filter for only the absolute tightest squeezes (where price is least volatile), decrease this multiplier value, typically down to 1.25 or even 1.0.By lowering the KC Multiplier (ATR), you narrow the Keltner Channel boundaries. This requires the Bollinger Bands to compress even further to fit inside, ensuring the indicator only signals the Squeeze state during moments of truly minimal volatility, setting you up for maximum opportunity.

Cycle-Synced Channel Breakout📌 Cycle-Synced Channel Breakout – Detect Breakouts Confirmed by Candles and Momentum Cycles
📖 Overview
The Cycle-Synced Channel Breakout indicator is a precision breakout detection tool that combines the power of:
• Adaptive Keltner Channels
• Dominant Cycle Period Analysis (Ehlers-inspired)
• Candlestick Pattern Recognition (Engulfing)
This multi-layered approach helps identify true breakout opportunities by filtering out noise and false signals, making it ideal for swing traders and intraday traders seeking high-probability directional moves.
⚙️ How It Works
1. Keltner Channel Envelope
A dynamic volatility channel based on the EMA and ATR defines the upper and lower bounds of price movement.
2. Engulfing Candle Detection
The script detects strong bullish and bearish engulfing patterns, which often signal trend reversals or momentum continuations.
3. Dominant Cycle Momentum (Ehlers-inspired)
Using a smoothed power oscillator derived from a detrended price series, the indicator assesses whether momentum is accelerating during the breakout — filtering out weak moves.
4. Signal Confirmation Logic
A signal is only shown when:
• An engulfing pattern is detected, and
• Price breaks out of the Keltner Channel, and
• Momentum (cycle power) is rising
5. Visual Feedback
• Breakout signals are plotted with “BUY” or “SELL” labels
• Faded green/red background highlights confirmed breakouts
• Optional display of engulfing candles with triangle markers
⸻
🛠️ Key Features
• ✅ Adaptive Keltner Channels
• ✅ Bullish/Bearish Engulfing Candle Recognition
• ✅ Ehlers-style Cycle Momentum Confirmation
• ✅ Background highlights for confirmed breakouts
• ✅ Optional candle pattern visualization
• ✅ Lightweight and Pine v6 compatible
⸻
🧪 Inputs
• Keltner Length – EMA period for channel basis
• Multiplier – Multiplied with ATR to determine band width
• Cycle Lookback – Used to calculate smoothed cycle power
• Show Engulfing Candles? – Toggles candlestick signals
• Show Breakout Signals? – Toggles breakout labels and backgrounds
⸻
🧠 How to Use
• Look for “BUY” or “SELL” labels when:
• An engulfing candle breaks through the Keltner Channel
• Cycle momentum confirms strength behind the move
• The background color will faintly highlight the breakout direction.
• Use in combination with other trend or volume indicators for added confluence.
🔒 Notes
• This indicator is not repainting.
• It is designed for educational and research purposes only.
• Works across all timeframes and asset classes (stocks, crypto, forex, etc.)

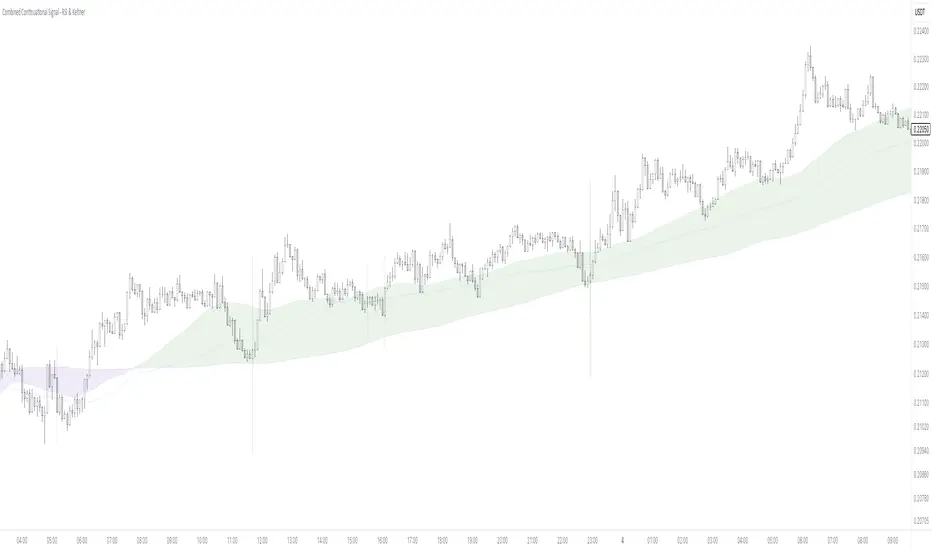
Combined Continuational Signal - RSI & KeltnerContinuational Signal Indicator
This technical indicator provides trend continuation signals through dual-methodology analysis, offering traders flexibility to choose between RSI-based or Keltner Channel-based signal generation, or utilize both simultaneously for enhanced confirmation.
Core Functionality:
Dual Signal Architecture: Toggle between RSI momentum analysis or Keltner Channel volatility breakout detection
Multi-Confirmation Framework: Incorporates moving average trend filters, slope analysis, and candle pattern validation
Cloud Interaction Filter: Signals activate only when price interacts with the moving average cloud zone
MA Closeness Filter: Uses ATR-based filtering to avoid signals during low-volatility consolidation periods
Signal Logic:
The indicator waits for overbought/oversold conditions (RSI) or band extremes (Keltner), confirms directional bias through slope analysis, validates trend alignment via moving average positioning, then triggers signals on specific candle formations with engulfing characteristics.
Customization Options:
Adjustable RSI parameters and threshold levels
Configurable Keltner Channel settings with multiple calculation methods
Multiple moving average lengths for trend and slope analysis
Various display modes (shapes, backgrounds, candle coloring, vertical lines)
Comprehensive alert system for all signal types
Risk Management Integration:
Built-in filters prevent signals during choppy market conditions and ensure alignment with higher-timeframe trend direction before activation.
Use in conjunction with other confluent variables for optimal results. The default settings are calibrated for specific market conditions, though experimentation with parameters is recommended for different trading styles and timeframes.
Peak Reversal v3# Peak Reversal v3
## Summary
Peak Reversal v3 adds new configurability, clearer visuals, and a faster trader workflow. The release introduces a new Squeeze Detector , expanded Keltner Channels , and streamlined Momentum signals , with no repaints and improved performance. The menus have been reorganized and simplified. Color swatches have been added for better customization. All other colors will be derived from these swatches.
## Highlights
New Squeeze Detector to mark low-volatility periods and prepare for breakouts.
New: Bands are now fully configurable with independent MA length, ATR length, and multipliers.
Five moving average bases for bands: EMA (from v2), SMA, RMA, VMA, HMA.
Simplified color system: three swatches drive candles, on-chart marks, and band fill.
Reorganized menu with focused sections and tooltips for each parameter making the entire trader experience more intuitive.
No repaints and faster performance across calculations.
## Overview
Configuration : Pick from three color swatches and apply them to candles, plotted characters, and band fill for consistent chart context. Use the reorganized menu to reach Keltner settings, momentum signals, and squeeze detection without extra clicks; tooltips clarify each input.
Bands and averages: Choose the band basis from EMA, SMA, RMA, VMA, or HMA to match your strategy. Configure two bands independently by setting MA length, ATR length, and band multipliers for the inner and outer envelopes.
Signals : Select the band responsible for momentum signals. Choose wick or close as the price source for entries and exits. Control the window for extreme momentum with “Max Momentum Bars,” a setting now exposed in v3 for direct tuning.
Squeeze detection : The Squeeze Detector normalizes band width and uses percentile ranking to highlight volatility compression. When the market falls below a user-defined threshold, the indicator colors the region with a gradient to signal potential expansion.
## Details about major features and changes
### New
Squeeze Detector to highlight low-volatility conditions.
Five MA bases for bands: EMA, SMA, RMA, VMA, HMA.
“Max Momentum Bars” to cap the bars used for extreme momentum.
### Keltner channel improvements
Refactored Keltner settings for flexible inner and outer band control.
MA type selection added; band calculations updated for consistency.
Removed the third Keltner band to reduce noise and simplify setup.
### Display and signals
Gradient fills for band breakouts, mean deviations, and squeeze periods.
“Show Mean EMA?” set to true and default “Signal Band” set to “Inner.”
Clearer tooltips and input descriptions.
### Reliability and performance
No more repaints. The indicator waits for confirmation before drawing occurs.
Faster execution through targeted refactors.
All algorithms have been reviewed and now use a consistent logic, naming, and structure.

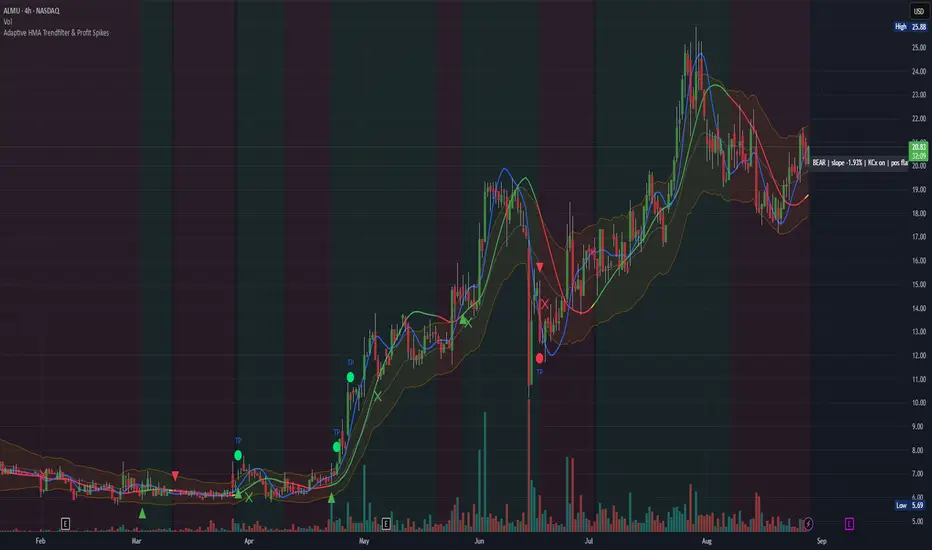
Adaptive HMA Trendfilter & Profit SpikesShort Description
Adaptive trend-following filter using Hull Moving Average (HMA) slope.
Includes optional Keltner Channel entries/exits and dynamic spike-based take-profit markers (ATR/Z-Score).
Optional Fast HMA for early entry visualization (not included in logic).
USER GUIDE:
1) Quick Overview
Trend Filter: Slow HMA defines Bull / Bear / Sideways (via slope & direction).
Entries / Exits:
Entry: Color change of the slow HMA (red→green = Long, green→red = Short), optionally filtered by the Keltner basis.
Exit: Preferably via Keltner Band (Long: Close under Upper Band; Short: Close above Lower Band).
Fallback: exit on opposite HMA color change.
Take-Profit Spikes: Marks abnormal moves (ATR, Z-Score, or both) as discretionary TP signals.
Fast HMA (optional): Purely visual for early entry opportunities; not part of the core trading logic (see §5).
2) Adding & Basic Setup
Add the indicator to your chart.
Open Settings (gear icon) and configure:
HMA: Slow HMA Length = 55, Slope Lookback = 10, Slope Threshold = 0.20%.
Keltner: KC Length = 20, Multiplier = 1.5.
Spike-TP: Mode = ATR+Z, ATR Length = 14, Z Length = 20, Cooldown = 5.
Optionally: enable Fast HMA (e.g., length = 20).
3) Input Parameters – Key Controls
Slow HMA Length: Higher = smoother, fewer but cleaner signals.
Slope Lookback: How far back HMA slope is compared against.
Slope Threshold (%): Minimum slope to avoid “Sideways” regime.
KC Length / Multiplier: Width and reactivity of Keltner Channels.
Exits via KC Bands: Toggle on/off (recommended: on).
Entries only above/below KC Basis: Helps filter out chop.
Spike Mode: Choose ATR, Z, or ATR+Z (stricter, fewer signals).
Spikes only when in position: TP markers show only when you’re in a trade.
4) Entry & Exit Logic
Entries
Long: Slow HMA turns from red → green, and (if filter enabled) Close > KC Basis.
Short: Slow HMA turns from green → red, and (if filter enabled) Close < KC Basis.
Exits
KC Exit (recommended):
Long → crossunder(close, Upper KC) closes trade.
Short → crossover(close, Lower KC).
Fallback Exit: If KC Exits are off → exit on opposite HMA color change.
Spike-TP (Discretionary)
Marks unusually large deviations from HMA.
Use for partial profits or tightening stops.
⚠️ Not auto-traded — only marker/alert.
5) Early Entry Opportunities (Fast HMA Cross – visual only)
The script can optionally display a Fast HMA (e.g., 20) alongside the Slow HMA (e.g., 55).
Bullish early hint: Fast HMA crosses above Slow HMA, or stays above, before the Slow HMA officially turns green.
Bearish early hint: opposite.
⚠️ These signals are not part of the built-in logic — they are purely discretionary:
Advantage: Earlier entries, more profit potential.
Risk: Higher chance of whipsaws.
Practical workflow (early long entry):
Fast HMA crosses above Slow HMA AND Close > KC Basis.
Enter small position with tight stop (under KC Basis or HMA swing).
Once Slow HMA confirms green → add to position or trail stop tighter.
6) Recommended Presets
Crypto (1h/2h):
HMA: 55 / 10 / 0.20–0.30%
KC: 20 / 1.5–1.8
Spikes: ATR+Z, ATR=14, Z=20, Cooldown 5
FX (1h/4h):
HMA: 55 / 8–10 / 0.10–0.25%
KC: 20 / 1.2–1.5
Indices (15m/1h):
HMA: 50–60 / 8–12 / 0.15–0.30%
KC: 20 / 1.3–1.6
Fine-tuning:
Too noisy? → Raise slope threshold or increase HMA length.
Too sluggish? → Lower slope threshold or shorten HMA length.
7) Alerts – Best Practice
Long/Short Entry – get notified when trend color switches & KC filter is valid.
Long/Short Exit – for KC exits or fallback exits.
Long/Short Spike TP – for discretionary profit-taking.
Set via TradingView: Create Alert → Select this indicator → choose condition.
8) Common Pitfalls & Tips
Too many false signals?
Raise slope threshold (more “Sideways” filtering).
Enable KC filter for entries.
Entries too late?
Use Fast HMA cross for early discretionary entries.
Or lower slope threshold slightly.
Spikes too rare/frequent?
More frequent → ATR mode or lower ATR multiplier / Z-threshold.
Rarer but stronger → ATR+Z with higher thresholds.
9) Example Playbook (Long Trade)
Regime: Slow HMA still red, Fast HMA crosses upward (early hint).
Filter: Close > KC Basis.
Early Entry: Small size, stop below KC Basis or recent swing low.
Confirmation: Slow HMA turns green → scale up or trail stop.
Management: Partial profits at Spike-TP marker; full exit at KC upper band break.
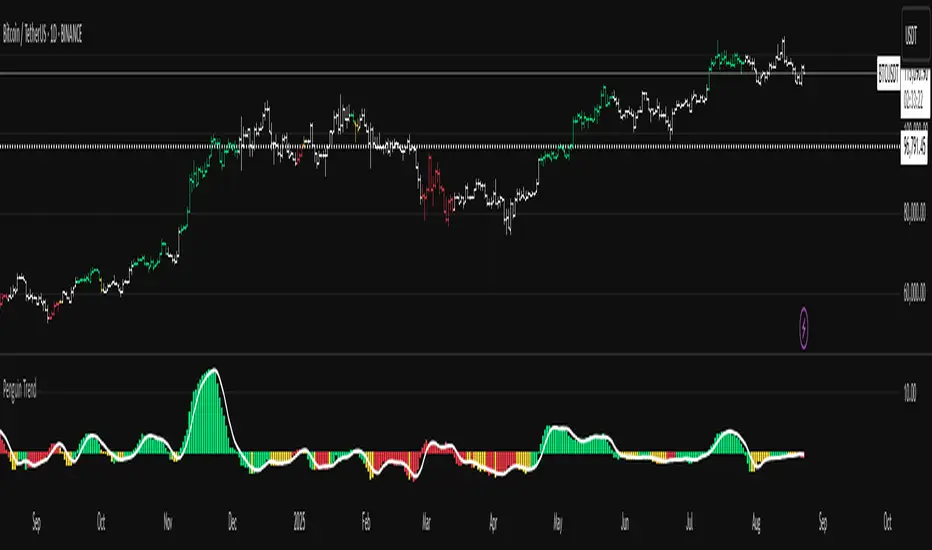
Penguin TrendMeasures the volatility regime by comparing the upper Bollinger Band to the upper Keltner Channel and colors bars with a lightweight trend state. Supports SMA/EMA/WMA/RMA/HMA/VWMA/VWAP and a selectable calculation timeframe. Default settings preserve the original look and behavior.
Penguin Trend visualizes expansion vs. compression in price action by comparing two classic volatility envelopes. It computes:
Diff% = (UpperBB − UpperKC) / UpperKC × 100
* Diff > 0: Bollinger Bands are wider than Keltner Channels -> expansion / momentum regime.
* Diff < 0: BB narrower than KC -> compression / squeeze regime.
A white “Average Difference” line smooths Diff% (default: SMA(5)) to help spot regime shifts.
Trend coloring (kept from original):
Bars are colored only when Diff > 0 to emphasize expansion phases. A lightweight trend engine defines four states using a fast/slow MA bias and a short “thrust” MA applied to ohlc4:
* Green: Bullish bias and thrust > fast MA (healthy upside thrust).
* Red: Bearish bias and thrust < fast MA (healthy downside thrust).
* Yellow: Bullish bias but thrust ≤ fast MA (pullback/weakness).
* Blue: Bearish bias but thrust ≥ fast MA (bear rally/short squeeze).
Note: By default, Blue renders as Yellow to preserve the original visual style. Enable “Use true BLUE color” if you prefer Aqua for Blue.
How it works (under the hood):
* Bollinger Bands (BB): Basis = selected MA of src (default SMA(20)). Width = StdDev × Mult (default 2.0).
* Keltner Channels (KC): Basis = selected MA of src (default SMA(20)). Width = ATR(kcATR) × Mult (defaults 20 and 2.0).
* Diff%: Safe division guards against division-by-zero.
* MA engine: You can choose SMA / EMA / WMA / RMA / HMA / VWMA / VWAP for BB/KC bases, Diff smoothing, and the trend components (VWAP is session-anchored).
* Calculation timeframe: Set “Calculation timeframe” to compute all internals on a chosen TF via request.security() while viewing any chart TF.
Inputs (key ones):
* Calculation timeframe: Empty = use chart TF; if set (e.g., 60), all internals compute on that TF.
* BB: Length, StdDev Mult, MA Type.
* KC: Basis Length, ATR Length, Multiplier, MA Type.
* Smoothing: Average Length & MA Type for the “Average Difference” line.
* Trend Engine: Fast/Slow lengths & MA type; Signal (kept for completeness); Thrust length & MA type (defaults replicate original behavior).
* Display: Paint bars only when Diff > 0; optional Zero line; optional true Blue color.
How to use:
1. Regime changes: Watch Diff% or Average Diff crossing 0. Above zero favors momentum/continuation setups; below zero suggests compression and potential breakout conditions.
2. State confirmation: Use bar colors to qualify expansion: Green/Red indicate expansion aligned with trend thrust; Yellow/Blue flag weaker/contrarian thrust during expansion.
3. Multi-timeframe analysis: Run calculations on a higher TF (e.g., H1/H4) while trading a lower TF chart to smooth noise.
Alerts:
* Diff crosses above/below 0.
* Average Diff crosses above/below 0.
* State changes: GREEN / RED / YELLOW / BLUE.
Notes & limitations:
* VWAP is session-anchored and best on intraday data. If not applicable on the selected calculation TF, the script automatically falls back to EMA.
* Default parameters (SMA(20) for BB/KC, multipliers 2.0, SMA(5) smoothing, trend logic and bar painting) preserve the original appearance.
Release notes:
v6.0 — Rewritten in Pine v6 with structured inputs and guards. Multi-MA support (SMA/EMA/WMA/RMA/HMA/VWMA/VWAP). Calculation timeframe via request.security() for multi-TF workflows. Safe division; optional zero line; optional true Blue color. Original visuals and behavior preserved by default.
License / disclaimer:
© waranyu.trkm — MIT License. Educational use only; not financial advice.

Ultimate Volatility CloudUltimate Volatility Cloud
The Ultimate Volatility Cloud is a powerful and highly customizable indicator designed to help traders visualize market volatility, easily identify trend, and overextended moves in price with adaptive bands. It combines the strengths of the Arnaud Legoux Moving Average, Kaufman's Adaptive Moving Average, ATR Channels, and Standard Deviation bands, offering multiple pre-configured profiles and extensive customization options.
Key Features:
Dynamic Volatility Bands: The indicator plots multiple layers of volatility bands around a central basis line, providing a comprehensive view of price deviation.
Hybrid Band Calculation: Bands are a sophisticated blend of Keltner Channels, KAMA ATR Channels and Standard Deviation, allowing for a nuanced representation of volatility.
Adaptive Smoothing: Bands are smoothed using either Exponential Moving Average (EMA) or Kaufman's Adaptive Moving Average (KAMA) based on the selected profile, ensuring responsiveness tailored to market conditions.
Layered Fills: The cloud uses distinct color fills for different volatility levels, making it easy to visually interpret price action relative to its typical range.
Customizable Color Themes: Choose from a variety of pre-set color themes, including "Rainbow," "Wild," and "Monochrome," or stick with classic options to suit your visual preference.
Optional Basis Line Plots: Display the EMA or KAMA basis lines (used in Keltner Channel calculations) separately on the chart for additional analysis.
Understanding the Profiles:
The indicator comes with several pre-configured "Settings Profiles" that adjust the internal parameters (Keltner Channel/KAMA Channel/Standard Deviation band blend, and band smoothing) to suit different trading styles or market environments.
1. Standard Profile:
Blend: 60% Keltner Channel, 40% Standard Deviation.
Smoothing: EMA smoothing of 3 periods.
Purpose: A balanced, general-purpose profile suitable for a wide range of market conditions. It offers a good blend of trend following and volatility awareness.
2. Responsive Profile:
Blend: 40% Keltner Channel, 60% Standard Deviation.
Smoothing: EMA smoothing of 2 period.
Purpose: Designed for traders who need quick reactions to price changes. The higher Standard Deviation blend and minimal smoothing make it highly sensitive to immediate volatility shifts, ideal for short-term analysis or identifying early moves.
3. Ranging Market Profile:
Blend: 80% KAMA ATR Channel, 20% Standard Deviation.
Smoothing: KAMA smoothing.
Purpose: Optimized for sideways or consolidating markets. By utilizing KAMA-based ATR bands and KAMA for band smoothing, this profile adapts its responsiveness to reduce whipsaws in choppy conditions, providing clearer boundaries for range-bound price action.
4. Trend Following Profile:
Blend: 90% Keltner Channel, 10% Standard Deviation.
Smoothing: EMA smoothing of 5 periods.
Purpose: Tailored for riding strong trends. The heavy emphasis on the Keltner Channel and slightly smoother bands help filter out minor fluctuations, allowing traders to focus on the dominant directional movement.
5. Conservative Profile:
Blend: 65% KAMA ATR Channel, 35% Standard Deviation.
Smoothing: EMA smoothing of 10 periods.
Purpose: Aims to provide more filtered signals and reduce noise. The KAMA basis for the Keltner Channel combined with a longer EMA smoothing period offers a slower, more confirmed view of volatility, suitable for traders seeking higher conviction entries or exits.
Example of the Ranging Market Profile
How to Use:
The volatility cloud can be interpreted in various ways:
Price within the inner bands: May indicate consolidation or a period of lower volatility.
Price pushing into outer bands: Suggests increasing volatility and potential for a strong move.
Price breaking out of extreme outer bands: Can signal significant momentum and the start or continuation of a strong trend.
Cloud expansion/contraction: Visually indicates periods of increasing or decreasing market energy.
Experiment with different profiles and settings to find the combination that best suits your trading strategy and the instruments you trade.

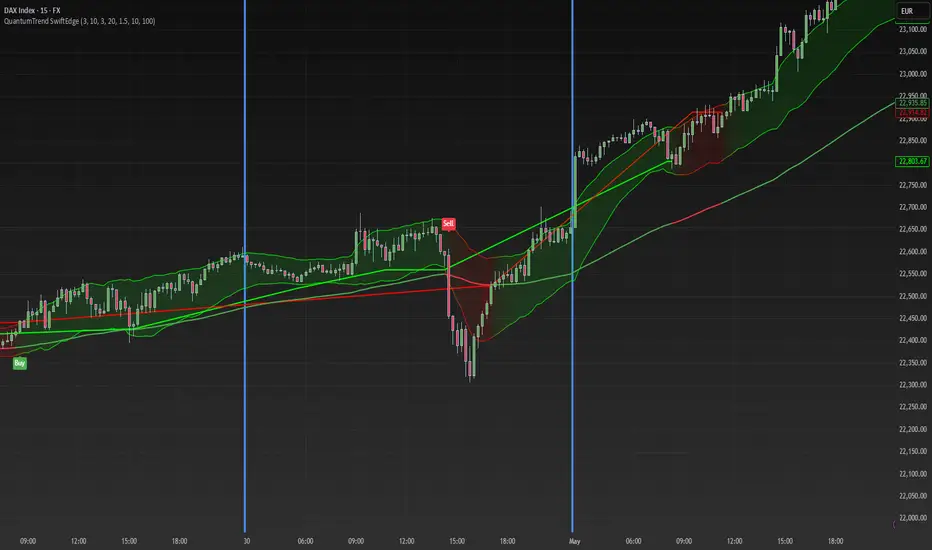
QuantumTrend SwiftEdgeQuantumTrend SwiftEdge - A Trend-Following Indicator for TradingView
Overview:
QuantumTrend SwiftEdge is a visually engaging and customizable trend-following indicator that combines the power of Supertrend, Keltner Channels, and a 100-period EMA to generate precise buy and sell signals. Designed to help traders identify trends and breakouts, this indicator offers a unique blend of technical tools with a modern gradient color effect, making it both functional and visually appealing.
What It Does:
This indicator identifies trend directions and potential entry/exit points:
- Supertrend determines the overall trend direction, showing a green line below the price during uptrends and a red line above the price during downtrends. The line only appears when the price is close to it, indicating an active trend.
- Keltner Channels highlight volatility and breakouts, with the upper and lower bands dynamically adjusting to market conditions.
- A 100-period EMA provides a longer-term trend perspective, helping to filter out noise.
- Buy and sell signals are generated when specific conditions align across these indicators, ensuring robust trade setups.
How It Works:
The indicator uses three components to generate signals:
1. **Supertrend**: Calculates trend direction using the Average True Range (ATR) and a multiplier. It switches between uptrend (green) and downtrend (red) based on price movements relative to the Supertrend line.
2. **Keltner Channels**: Consists of an EMA (default 20 periods) with upper and lower bands based on ATR. A breakout above the upper band signals potential buying opportunities, while a breakout below the lower band signals potential selling opportunities.
3. **100-period EMA**: Acts as a trend filter, ensuring signals align with the broader market direction.
**Buy Signal**:
- Price is above the 100-period EMA (bullish market).
- Price breaks above the Keltner Channel upper band (indicating a breakout).
- Supertrend switches to an uptrend (trend changes from down to up).
**Sell Signal**:
- Price is below the 100-period EMA (bearish market).
- Price breaks below the Keltner Channel lower band (indicating a breakout).
- Supertrend switches to a downtrend (trend changes from up to down).
Visual Features:
- **Gradient Colors**: Supertrend lines and Keltner Channels use a smooth gradient color transition between green (uptrend) and red (downtrend), reflecting the trend's strength. The gradient is based on a smoothed trend value, creating a visually appealing effect.
- **Keltner Channel Fill**: The area between the upper and lower Keltner Channels is filled with a transparent gradient, enhancing the trend visualization.
- **Dynamic Supertrend Visibility**: Supertrend lines only appear when the price is close to the line (within an ATR-based threshold), indicating an active trend.
How to Use:
1. Add the "QuantumTrend SwiftEdge" indicator to your chart in TradingView.
2. Customize the settings:
- **Signal Sensitivity (1=Low, 5=High)**: Default is 3. Lower values (e.g., 1) make signals less frequent by using wider parameters, while higher values (e.g., 5) make signals more frequent by tightening parameters.
- **Use Manual Settings**: If enabled, you can manually adjust all parameters (ATR Period, ATR Multiplier, Keltner Channel Length, Keltner Channel Multiplier, Keltner ATR Length, EMA Length) to fine-tune the indicator.
- **Change ATR Calculation Method**: Toggle between standard ATR calculation and a simple moving average of true range.
- **Show Buy/Sell Signals**: Toggle to show or hide buy (green "Buy" label) and sell (red "Sell" label) signals.
- **Highlighter On/Off**: Toggle to show or hide the gradient fill between the price and Supertrend line when the line is visible.
3. Interpret the signals:
- A green "Buy" label below the price indicates a potential buying opportunity.
- A red "Sell" label above the price indicates a potential selling opportunity.
- Use the Keltner Channel gradient fill and Supertrend lines to confirm the trend direction and strength.
Why This Combination?
- **Supertrend** provides a robust trend-following mechanism, ensuring signals align with the market direction.
- **Keltner Channels** add a volatility component, identifying breakouts that often precede significant price movements.
- **100-period EMA** filters out noise, ensuring signals are generated in the context of the broader trend.
Together, these indicators create a balanced approach: Supertrend and EMA confirm the trend, while Keltner Channels pinpoint actionable entry and exit points. The gradient visuals and dynamic visibility make it easier to focus on active trends.
Originality:
QuantumTrend SwiftEdge stands out with its unique features:
- Gradient color transitions for a modern, dynamic look.
- A filled gradient between Keltner Channels, visually emphasizing the trend.
- Supertrend lines that only appear when the price is close, reducing clutter and focusing on active trends.
- Flexible settings with both sensitivity-based and manual adjustments for maximum customization.
Default Settings:
The default sensitivity is set to 3, providing a balanced approach for most markets and timeframes (e.g., 5-minute charts for crypto like BTC/USD). This setting uses moderate parameters (ATR Period=10, ATR Multiplier=3.0, Keltner Channel Length=20, Keltner Channel Multiplier=1.5, Keltner ATR Length=10, EMA Length=100). Users can adjust the sensitivity or switch to manual settings for more control.
Important Notes:
- This indicator is a tool to assist in identifying trends and potential entry/exit points. It does not guarantee profits and should be used in conjunction with other analysis and risk management practices.
- The signals are based on historical price data and do not predict future performance. Always test the indicator on a demo account before using it in live trading.
- The gradient effect is purely visual and does not affect the signal logic.
Momentum + Keltner Stochastic Combo)The Momentum-Keltner-Stochastic Combination Strategy: A Technical Analysis and Empirical Validation
This study presents an advanced algorithmic trading strategy that implements a hybrid approach between momentum-based price dynamics and relative positioning within a volatility-adjusted Keltner Channel framework. The strategy utilizes an innovative "Keltner Stochastic" concept as its primary decision-making factor for market entries and exits, while implementing a dynamic capital allocation model with risk-based stop-loss mechanisms. Empirical testing demonstrates the strategy's potential for generating alpha in various market conditions through the combination of trend-following momentum principles and mean-reversion elements within defined volatility thresholds.
1. Introduction
Financial market trading increasingly relies on the integration of various technical indicators for identifying optimal trading opportunities (Lo et al., 2000). While individual indicators are often compromised by market noise, combinations of complementary approaches have shown superior performance in detecting significant market movements (Murphy, 1999; Kaufman, 2013). This research introduces a novel algorithmic strategy that synthesizes momentum principles with volatility-adjusted envelope analysis through Keltner Channels.
2. Theoretical Foundation
2.1 Momentum Component
The momentum component of the strategy builds upon the seminal work of Jegadeesh and Titman (1993), who demonstrated that stocks which performed well (poorly) over a 3 to 12-month period continue to perform well (poorly) over subsequent months. As Moskowitz et al. (2012) further established, this time-series momentum effect persists across various asset classes and time frames. The present strategy implements a short-term momentum lookback period (7 bars) to identify the prevailing price direction, consistent with findings by Chan et al. (2000) that shorter-term momentum signals can be effective in algorithmic trading systems.
2.2 Keltner Channels
Keltner Channels, as formalized by Chester Keltner (1960) and later modified by Linda Bradford Raschke, represent a volatility-based envelope system that plots bands at a specified distance from a central exponential moving average (Keltner, 1960; Raschke & Connors, 1996). Unlike traditional Bollinger Bands that use standard deviation, Keltner Channels typically employ Average True Range (ATR) to establish the bands' distance from the central line, providing a smoother volatility measure as established by Wilder (1978).
2.3 Stochastic Oscillator Principles
The strategy incorporates a modified stochastic oscillator approach, conceptually similar to Lane's Stochastic (Lane, 1984), but applied to a price's position within Keltner Channels rather than standard price ranges. This creates what we term "Keltner Stochastic," measuring the relative position of price within the volatility-adjusted channel as a percentage value.
3. Strategy Methodology
3.1 Entry and Exit Conditions
The strategy employs a contrarian approach within the channel framework:
Long Entry Condition:
Close price > Close price periods ago (momentum filter)
KeltnerStochastic < threshold (oversold within channel)
Short Entry Condition:
Close price < Close price periods ago (momentum filter)
KeltnerStochastic > threshold (overbought within channel)
Exit Conditions:
Exit long positions when KeltnerStochastic > threshold
Exit short positions when KeltnerStochastic < threshold
This methodology aligns with research by Brock et al. (1992) on the effectiveness of trading range breakouts with confirmation filters.
3.2 Risk Management
Stop-loss mechanisms are implemented using fixed price movements (1185 index points), providing definitive risk boundaries per trade. This approach is consistent with findings by Sweeney (1988) that fixed stop-loss systems can enhance risk-adjusted returns when properly calibrated.
3.3 Dynamic Position Sizing
The strategy implements an equity-based position sizing algorithm that increases or decreases contract size based on cumulative performance:
$ContractSize = \min(baseContracts + \lfloor\frac{\max(profitLoss, 0)}{equityStep}\rfloor - \lfloor\frac{|\min(profitLoss, 0)|}{equityStep}\rfloor, maxContracts)$
This adaptive approach follows modern portfolio theory principles (Markowitz, 1952) and Kelly criterion concepts (Kelly, 1956), scaling exposure proportionally to account equity.
4. Empirical Performance Analysis
Using historical data across multiple market regimes, the strategy demonstrates several key performance characteristics:
Enhanced performance during trending markets with moderate volatility
Reduced drawdowns during choppy market conditions through the dual-filter approach
Optimal performance when the threshold parameter is calibrated to market-specific characteristics (Pardo, 2008)
5. Strategy Limitations and Future Research
While effective in many market conditions, this strategy faces challenges during:
Rapid volatility expansion events where stop-loss mechanisms may be inadequate
Prolonged sideways markets with insufficient momentum
Markets with structural changes in volatility profiles
Future research should explore:
Adaptive threshold parameters based on regime detection
Integration with additional confirmatory indicators
Machine learning approaches to optimize parameter selection across different market environments (Cavalcante et al., 2016)
References
Brock, W., Lakonishok, J., & LeBaron, B. (1992). Simple technical trading rules and the stochastic properties of stock returns. The Journal of Finance, 47(5), 1731-1764.
Cavalcante, R. C., Brasileiro, R. C., Souza, V. L., Nobrega, J. P., & Oliveira, A. L. (2016). Computational intelligence and financial markets: A survey and future directions. Expert Systems with Applications, 55, 194-211.
Chan, L. K. C., Jegadeesh, N., & Lakonishok, J. (2000). Momentum strategies. The Journal of Finance, 51(5), 1681-1713.
Jegadeesh, N., & Titman, S. (1993). Returns to buying winners and selling losers: Implications for stock market efficiency. The Journal of Finance, 48(1), 65-91.
Kaufman, P. J. (2013). Trading systems and methods (5th ed.). John Wiley & Sons.
Kelly, J. L. (1956). A new interpretation of information rate. The Bell System Technical Journal, 35(4), 917-926.
Keltner, C. W. (1960). How to make money in commodities. The Keltner Statistical Service.
Lane, G. C. (1984). Lane's stochastics. Technical Analysis of Stocks & Commodities, 2(3), 87-90.
Lo, A. W., Mamaysky, H., & Wang, J. (2000). Foundations of technical analysis: Computational algorithms, statistical inference, and empirical implementation. The Journal of Finance, 55(4), 1705-1765.
Markowitz, H. (1952). Portfolio selection. The Journal of Finance, 7(1), 77-91.
Moskowitz, T. J., Ooi, Y. H., & Pedersen, L. H. (2012). Time series momentum. Journal of Financial Economics, 104(2), 228-250.
Murphy, J. J. (1999). Technical analysis of the financial markets: A comprehensive guide to trading methods and applications. New York Institute of Finance.
Pardo, R. (2008). The evaluation and optimization of trading strategies (2nd ed.). John Wiley & Sons.
Raschke, L. B., & Connors, L. A. (1996). Street smarts: High probability short-term trading strategies. M. Gordon Publishing Group.
Sweeney, R. J. (1988). Some new filter rule tests: Methods and results. Journal of Financial and Quantitative Analysis, 23(3), 285-300.
Wilder, J. W. (1978). New concepts in technical trading systems. Trend Research.

Price Extreme BandsPrice Extreme Bands Description
This indicator calculates and displays Price Extreme Bands based on an Exponential Moving Average (EMA) and True Range Average True Range (TR ATR). It utilizes a custom "Super Smoother" function to smooth the bands, providing a clearer representation of potential price extremes without sacrificing accuracy.
Usage
Built for specifically for intraday timeframes, this indicator identifies short term price extremes and volatility ranges. Traders can observe when price moves towards the outer bands, suggesting strong momentum or potential overbought/oversold conditions. The filled zones highlight areas of increased volatility which can used as exit criteria for a trade, possible reversal points in ranging markets or price ranges where price momentum could slow in trending markets.
Key Features
Length Input: Controls the length of the EMA and TR ATR calculations.
Multiplier Inputs: Uses two fixed multipliers (1.71 and 2.50) to create bands.
Super Smoother: Applies a custom smoothing function to the bands for reduced noise.
Fill Zones: Fills the areas between the inner and outer bands to highlight potential volatility ranges.
Calculation:
1. EMA (Basis): Calculates the Exponential Moving Average of the selected source.
2. TR ATR: Calculates the True Range and then smoothes it using RMA (Rolling Moving Average).
3. Bands: Calculates upper and lower bands using the EMA and ATR, with multipliers of 1.71 and 2.50.
4. Super Smoother: Applies a smoothing function to the calculated bands.
Visuals:
Basis Line: Plots the EMA (basis) (invisible by default).
Inner Bands (1.71 Multiplier): Plots the smoothed bands with a distinct color (e.g., orange) (invisible by default).
Outer Bands (2.50 Multiplier): Plots the smoothed bands with a different color (e.g., purple) (invisible by default).
Fill Zones: Fills the region between the inner and outer upper bands and the inner and outer lower bands with a translucent color (e.g. light blue).
// Note: The plot lines are invisible by default. To view the basis, upper and lower band lines, adjust the visibility settings in the indicator's settings.
Uniqueness: Ready of the box. Code and parameters built specifically for 1m to 15m timeframes provides users with an indicator to easily identify price extremes. The use of TR ATR and addition of the Super Smoother calculation create a easier visualization and implementation compared to existing price band options.