Multiband - Market TimerThis strategy is made for market timing in the bull markets. Hence, more ideal to use it with index ETFs or high conviction large caps.
This makes use of different custom indicators:
Multi Band Channel - Overbought/Oversold Oscillator
VixFix Linear regression
Regular Linear Regression.
Multi Band Oscillator is used for identifying overbought/oversold state of the instrument. This is used in conjunction with VIXFix Linear Regression to to find market bottoms for entry conditions.
Few parameters are explained below:
CheckBandDistance - If checked checks for narrow bands and ignore signals when crossover happens in narrow bands.
ConsiderOversoldDaysCounter/ConsiderOverboughtDaysCounter - If checked, considers oversold and overbought crossovers only if instrument stays in oversold/overbought state for that many bars.
UseLinearRegressionToOpen/UseLinearRegressionToClose - If checked, combines linear regression along with overbought/oversold condition for entry and exits.
UseVixFixToOpen - Uses VixFixLinear regression to identify market bottom and this condition will be combined with oversold/overbought state. When using VixFixLinearRegression signal, we can allow generating entry signals during non crossover bars. Vix Fix Entry Range sets the max bar for multi band state to be for generating signal. For example, if Vix Fix Entry Range is set to oversold, signal is generated based on VixFix if price is below oversold.
ExitStrategy - This can be trailing/reversal or combined. If set to reversal, exit will happen on state moving out of oversold region. If set to Trailing, stop will be based on trailing stops. Indicator shows what is the present stop value. If set to combined, exit will happen on stages. 30% of the remaining position gets closed upon reversals. State may go into oversold and return back many times before having full exit. If this happens, each time, 30% of the position will be closed. Full position closure happens on hitting training stop.
Candles are colored based on linear regression.
Green -> positive and moving up
Lime -> Positive moving down
Orange -> Negative moving up
Red -> Negative moving down
Purple -> Possible VixFix peak - aka Market bottom
Another snapshot of the script along with Linear regression and VIXFix-LinReg indicators:
Related scripts are found here:
I have not put additional indicators to identify trend. But, can be combined with higher timeframe trend filters to generate better signals. Making this as invite only script as I find it very lucrative to time index ETFs. Please PM me if you want to try this script.
Kênh giá Keltner (KC)

[CADCHF] DinhChienFX's Predict signaltrend: crossing 2 times upper 2/lower 2 - stop/profit: 1/1 - Entry: Upper/lower 1, Entry 2: 0.66 (66%)
HH-HL/LL-LH: 15:15; ADX: 38, smooth: 9, DI: 9.
Order 1: 92 trades - 65.22% - R/R: 1/1
Order 2: 64 trades - 54.02% - R/R - 1/1.94 (fibonacci 66%)
Total 2 order: 156 trades - 59.62% - Net Profit: 201.46% - Max drawdown: 9.02%.
Commission: 4usd/trade
slippage: 2
1. Identify the trend
* On the chart:
a. Part of Dow theory: multi-trades active at the impulse waves.
Uptrend trend:
- HH / Higher High: The following peak is higher than the previous one .
- HL / Higher Low: The back bottom is higher than the previous one .
Downtrend:
- LL / Lower Low: The back bottom is lower than the previous one .
- LH / Lower High: The posterior peak is lower than the previous one
Pivot left: 15
Pivot right: 15
b. Keltner price channel:
- Uptrend: Go above Upper 2 two times
- Downtrend: Down to Lower 2 two times
* Under Chart:
ADX indicator: Used to identify a strong trend
- ADX smooth: 9
- DI: 9
- ADX = 38
2. Entry point:
- Buy: Buy limit at the Upper Keltner channel.
- Sell: Sell limit at the Lower Keltner channel.
3. Take profit, stoploss
ATR indicator (20) ( Average true range ) * 2

Predict DinhChienFX's1. Identify the trend
* On the chart:
a. Part of Dow theory: multi-trades active at the impulse waves.
Uptrend trend:
- HH / Higher High: The following peak is higher than the previous one.
- HL / Higher Low: The back bottom is higher than the previous one.
Downtrend:
- LL / Lower Low: The back bottom is lower than the previous one.
- LH / Lower High: The posterior peak is lower than the previous one
b. Keltner price channel:
Uptrend: Go above Upper 2
Bearish trend: Down to Lower 2
* Under Chart:
Stochastic indicator: 21 past candles
- Uptrend: Index K and D surpass 80
- Buy zone: Index D is large 80.
----------------------------
- Downward trend: K and D indexes go down to 20.
- Sell zone: Index D is less than 20.
RSI indicator: 21 past candles
- Uptrend: value exceeds 80.
- Downward trend: value exceeds 20.
ADX indicator: Used to identify a strong trend
- ADX smooth: 9
- DI: 9
2. Entry point:
- Buy: wait to buy on the Upper Keltner channel.
- Sell (sell): wait for sell at the Lower Keltner channel.
3. Take profit, stoploss
ATR indicator (20) (Average true range) * 2

Inverse BandsThis was the result of quite some time spent examining how much information could be gleamed by studying the interactions between Keltner Channels, STARC Bands and Bollinger Bands. I was surprised by the results.
First of all, there are four fills that are black. Set the transparency of those to 0 and you'll see this indicator the way that it's meant to be seen. Those fills belong to unused sections of the Bollinger Bands.
There are two clouds which represent STARC Bands and the Keltner Channel. There is some delay when they flip from bullish (green) to bearish (red), but they are indicative of the trend. The space between them is black and the narrower that space is, the greater volatility is. Because of this, we don't need the exterior Bollinger Bands.
The Bollinger Bands remain visible as the yellow interior clouds on the top cloud and the blue interior clouds on the bottom cloud. Often, the thicker the yellow or blue cloud is, the less severe a throwback from a given trend reversal will be. Often the thinner that yellow or blue cloud is, the more severe the trend reversal will be. If price is rising into a thin interior yellow cloud, the following dip will be substantial. If price action dips towards a thicker interior blue cloud, often the pump following that dump will be less enthusiastic.
We preserve the Keltner Channel and STARC bands as our cloud because the way that they interact with the three basis lines yields a lot of information.
The yellow Bollinger basis line tells us about trend strength. The closer the BB basis line is to the top of the top cloud or the bottom of the bottom cloud, the stronger the trend is. When it enters the cloud very close to the bottom of the bottom cloud, you know you're looking at a strong pump, and vice versa when it's close to the top of the top cloud.
The purple Keltner Channel basis line and orange STARC Band basis line can forecast short term trend changes one candlestick in advance by contacting any line in either cloud. The moment either basis line touches or crosses any boundary of the clouds, you know that the next candle will change directions. In an uptrend, a touch or cross means the next candle will have a lower high point. In a downtrend, a cross or touch means the next candle will have a higher high point. This is most useful in scalping.
It'd be pretty easy to slap some crossover alerts on to this and useful considering that they come a candle in advance. Feel free to further explore and develop this.

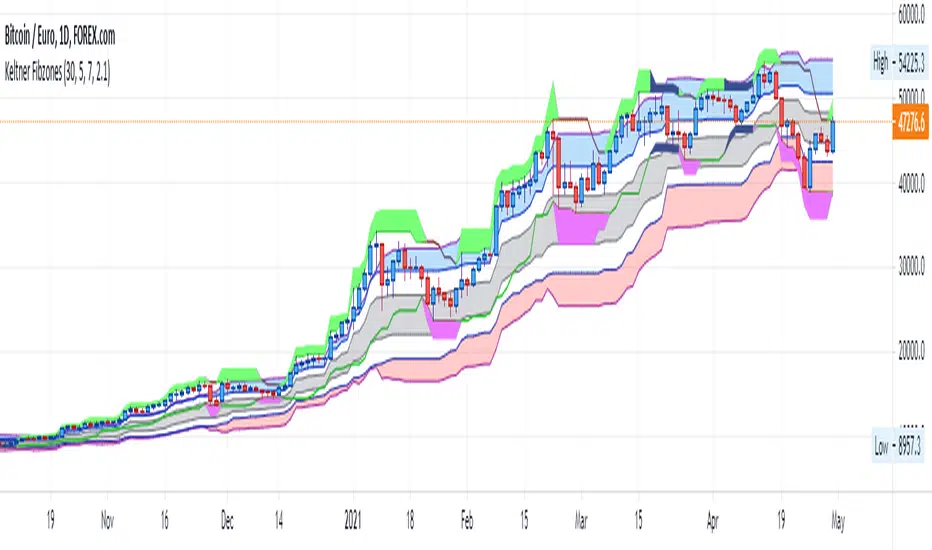
Keltner FibzonesKeltner Channel with Fibonacci Zones which uses properties of a Donchian Channel.
This script is a variation of the Fibonacci Zone script and the Donchian Fibonacci Trading Tool which I published earlier. A Keltner Channel gives more useful information to the trader than a Donchian Channel, because it provides a depiction of “normal range” and shows “outside normalcy” situations. Fibonacci lines provide a way to see if the market is trending up or down, while moving inside the channel, because in cases where the Fibonacci lines function as resistance, the trend is down, whereas when these turn out to be supports the trend is up.
Example of use:
If after a rally up - in which candles moves outside the channel - these return into the channel, this means a “new normal”. If the fibs turn out to give support, one may assume that this is a temporary sideways movement in which a flag is formed, after which following rally up may happen. With rally down the opposite is true. Top and bottom situations show a change in the way the market uses the fiblines.
The middle line of the Donchian Channel is used as the middle line of the Keltner channel, in stead of the sma in the classic channel. Default for calculation is 2 x Average True Range above and below this line. Default for the periods of the channel is 20 periods, because this allows the candles to go outside the channel. If you shorten this, all happens inside the channel.
Squeeze Momentum Indicator v4_pine [By Lazy Bear]This is the famous Squeeze Momentum Indicator made by @LazyBear in v4 version if someone wants to test some strategies, as the original code was in v2 version the code converter couldn't convert to v4.

Multi Band Channel - Oversold/Overbought OscillatorIf your trading strategy is to sell the RIPs and buy the DIPs, this is an indicator for you.
This is based on the multi band indicator present here:
Code is simplified to generate as many bands as possible and hence divide price into as many states as possible based on these bands. Moving Average Type defines what moving average to be considered for Bollinger Band/Keltner Channel. This is based on
Once we derive price state based on multi bollinger band/keltner channel levels, we then look for highest and lowest levels in LoopbackPeriod .
Overbought level = Highest Level - Offset
Oversold level = Lowest Level + Offset
Blue line indicates current state.

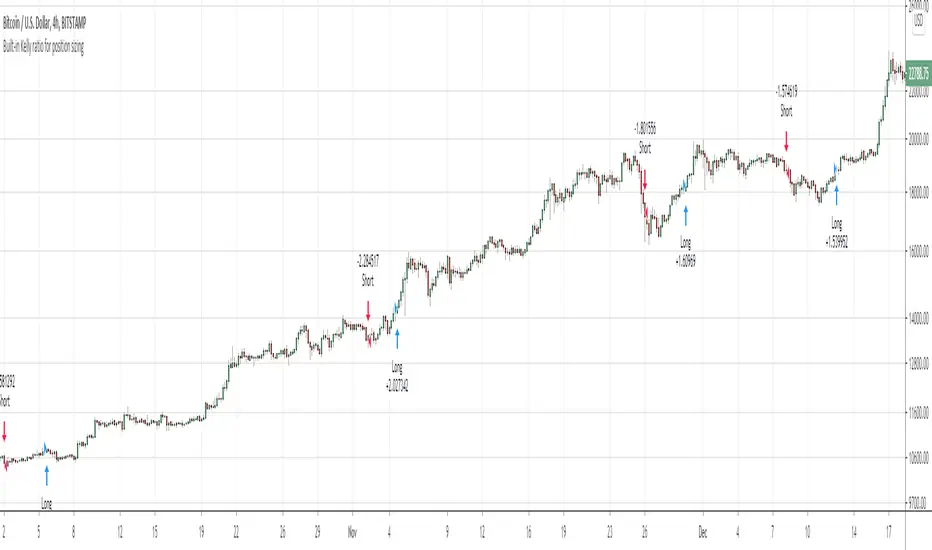
Built-in Kelly ratio for dynamic position sizingThis is the defaut keltners channel strategy with a few additions.
The main purpose is to show how we include the Kelly ratio into our scripts for dynamic position sizing based on the performance of the strategy on a per trade basis.
We've also included the usual take-profit and stop-loss parameters in the event you want to play a little :)
We hope this helps you advance your personal system.
Happy Trading!
MA Streak Change ChannelChange Channel is like KC unless it uses percentage changes in price to set channel distance. Midline is zero-lag smoothed ROC with dynamic period based on MA Streak indicator, if MA Streak shows an ongoing trend, midline going strong and break out the channel.
Consider using ▲ green areas as a signal to buy and ▼ red areas as a sell signal. It works best in a flat market. Use in combination with other indicators.

Squeeze Momentum Signal Overlay [GN]Companion script for Squeeze Momentum Indicator that plots the signal on chart.
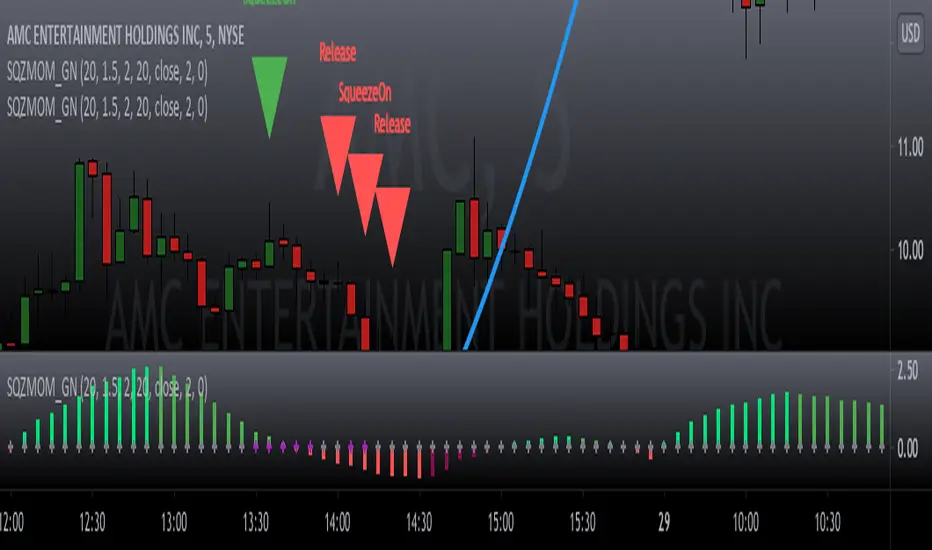

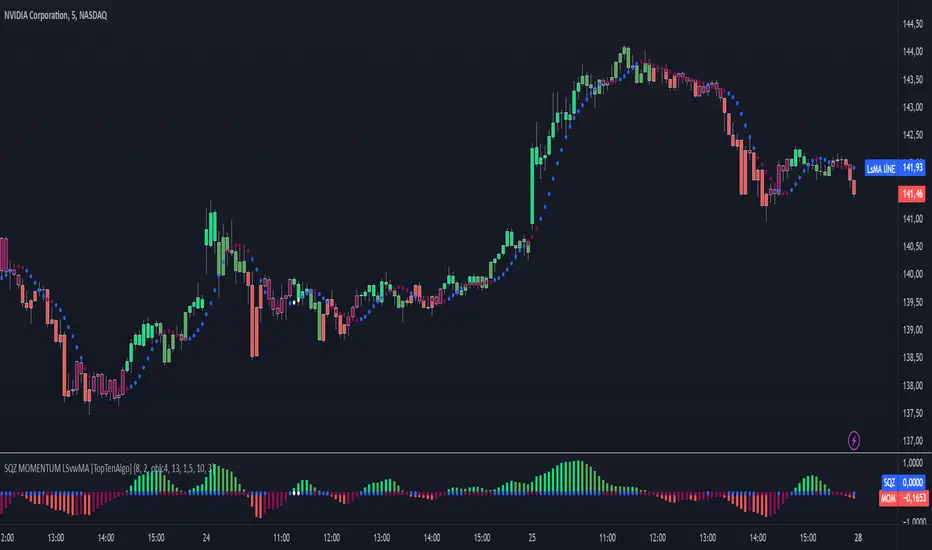
TopTenAlgo 10. SQZMOM_LSvwMA with Bar ColorEN: This Algorithm is a derivative of John Carter's "TTM Squeeze" volatility indicator. Many strategists have taken the indicator on Tradingview with simple moving averages and have looked at the biggest mistake only by dealing with squeeze and exit processes to squeeze. But I used the algorithm to determine where the markets would actually explode. For example, instead of using SMAs , I tested them on the Linear Regression Curve using Volume Weighted Moving Averages and Hull MAs. This gave me the opportunity to develop a more responsive algorithm and identify where the actual explosion would occur. The Gray Circles in the midline show that the market is entering a new jam (in the Bollinger Bands and Keltner Channel). This means low volatility , the market prepares itself for an explosive move (up or down). White Circles mean that it is about to get out of the jam. The Blue Circles, which no one can calculate, now inform that the exit is no longer jammed and that the explosion has taken place.
Mr. Carter recommends that you wait until the first gray after a gray cross and take a position in the momentum direction (for example, if the momentum value is above zero, relax). Exit position when the momentum changes (increase or decrease, this is indicated by a color change). In this algorithm, I tried to achieve good entry points using an additional indicator such as ADX and WaveTrend. To draw the histogram, I used a different method based on Linear Regression . Mr.Carter uses a simple momentum indicator .
In summary, this algorithm is a strict algorithm in which additional 4-5 indicators are blended. Conveniences for Everyone ...
This algorithm is prepared with @Top10Algo ...
TR: Bu Algoritma John Carter'ın "TTM Squeeze" volatilite göstergesinin bir türevidir. Bir çok stratejist Tradingview' de gösterge' yi basit hareketli ortalamalarla ele almış ve en büyük hatayı sadece sıkışma ve sıkışmadan çıkış süreçlerini ele alarak bakmışlardır. Fakat ben algoritmayı piyasaların asıl patlama yapacağı yeri tespit etmek için kullandım. Örneğin SMA' ları kullanmak yerine Hacim Ağırlıklı Hareketli Ortalamaları ve Hull MA' ları kullanarak onları Linerar Regresyon Eğrisinde stress testine tabi tuttum. Buda bana daha duyarlı bir algoritma geliştirmem ve asıl patlamanın olacağı yerleri tespit etmem için fırsat verdi. Orta hattaki Gri Daireler, piyasanın yeni bir sıkışmaya girdiğini gösteriyor ( Bollinger Bantları ve Keltner Kanalı'nda). Bu, düşük volatilite anlamına gelir, piyasa kendisini patlayıcı bir harekete hazırlar (yukarı veya aşağı). Beyaz Daireler ise sıkışmadan çıkmak üzere olduğu anlamına gelir. Hiç kimsenin hesap edemediği Mavi Daireler ise artık sıkışmadan çıkıldığını ve patlamanın gerçekleştiğini haber verir.
Mr.Carter, gri bir çarpı işaretinden sonra ilk griye kadar beklemenizi ve momentum yönünde bir pozisyon almanızı önerir (örneğin, momentum değeri sıfırın üstünde ise, rahat olun). Momentum değiştiğinde pozisyondan çıkın (artırma veya azaltma, bunu o bir renk değişikliği ile belirtilir). Bu algoritmada ben, ADX ve WaveTrend gibi ek bir gösterge kullanarak iyi giriş noktalarıelde etmeye çalıştım. Histogramı çizmek için ise Linear Regresyon tabanlı farklı bir yöntem kullandım. Mr.Carter basit bir momentum göstergesi kullanır.
Özetle bu algoritma ek 4-5 göstergenin harmanlandığı sıkı bir algoritmadır. Herkese Kolaylıklar dilerim...
Bu algoritma @Top10Algo ile beraber hazırlanmıştır... Kodlamadaki katkılarından ve yol göstericiliğinden dolayı teşekkürü bir borç bilirim.
TopTenAlgo 10. SQZMOM_LSvwMA with Bar Color (Not Based Volume)EN: This Algorithm is a derivative of John Carter's "TTM Squeeze" volatility indicator. Many strategists have taken the indicator on Tradingview with simple moving averages and have looked at the biggest mistake only by dealing with squeeze and exit processes to squeeze. But I used the algorithm to determine where the markets would actually explode. For example, instead of using SMAs , I tested them on the Linear Regression Curve using Volume Weighted Moving Averages and Hull MAs. This gave me the opportunity to develop a more responsive algorithm and identify where the actual explosion would occur. The Gray Circles in the midline show that the market is entering a new jam (in the Bollinger Bands and Keltner Channel). This means low volatility , the market prepares itself for an explosive move (up or down). White Circles mean that it is about to get out of the jam. The Blue Circles, which no one can calculate, now inform that the exit is no longer jammed and that the explosion has taken place.
Mr. Carter recommends that you wait until the first gray after a gray cross and take a position in the momentum direction (for example, if the momentum value is above zero, relax). Exit position when the momentum changes (increase or decrease, this is indicated by a color change). In this algorithm, I tried to achieve good entry points using an additional indicator such as ADX and WaveTrend. To draw the histogram, I used a different method based on Linear Regression . Mr.Carter uses a simple momentum indicator .
In summary, this algorithm is a strict algorithm in which additional 4-5 indicators are blended. Conveniences for Everyone ... (For Symbols that cannot be read on the Volume Indicator)
This algorithm is prepared with @Top10Algo ...
TR: Bu Algoritma John Carter'ın "TTM Squeeze" volatilite göstergesinin bir türevidir. Bir çok stratejist Tradingview' de gösterge' yi basit hareketli ortalamalarla ele almış ve en büyük hatayı sadece sıkışma ve sıkışmadan çıkış süreçlerini ele alarak bakmışlardır. Fakat ben algoritmayı piyasaların asıl patlama yapacağı yeri tespit etmek için kullandım. Örneğin SMA' ları kullanmak yerine Hacim Ağırlıklı Hareketli Ortalamaları ve Hull MA' ları kullanarak onları Linerar Regresyon Eğrisinde stress testine tabi tuttum. Buda bana daha duyarlı bir algoritma geliştirmem ve asıl patlamanın olacağı yerleri tespit etmem için fırsat verdi. Orta hattaki Gri Daireler, piyasanın yeni bir sıkışmaya girdiğini gösteriyor ( Bollinger Bantları ve Keltner Kanalı'nda). Bu, düşük volatilite anlamına gelir, piyasa kendisini patlayıcı bir harekete hazırlar (yukarı veya aşağı). Beyaz Daireler ise sıkışmadan çıkmak üzere olduğu anlamına gelir. Hiç kimsenin hesap edemediği Mavi Daireler ise artık sıkışmadan çıkıldığını ve patlamanın gerçekleştiğini haber verir.
Mr.Carter, gri bir çarpı işaretinden sonra ilk griye kadar beklemenizi ve momentum yönünde bir pozisyon almanızı önerir (örneğin, momentum değeri sıfırın üstünde ise, rahat olun). Momentum değiştiğinde pozisyondan çıkın (artırma veya azaltma, bunu o bir renk değişikliği ile belirtilir). Bu algoritmada ben, ADX ve WaveTrend gibi ek bir gösterge kullanarak iyi giriş noktalarıelde etmeye çalıştım. Histogramı çizmek için ise Linear Regresyon tabanlı farklı bir yöntem kullandım. Mr.Carter basit bir momentum göstergesi kullanır.
Özetle bu algoritma ek 4-5 göstergenin harmanlandığı sıkı bir algoritmadır. Herkese Kolaylıklar dilerim... (Hacim Göstergesi okunamayan Semboller için)
Bu algoritma @Top10Algo ile beraber hazırlanmıştır...

Relative Channel BandwidthThis indicator uses different volatility channels - Bollinger Band, Donchian Channel and Keltner Channel width to measure volatility.
Indicator plots channel bandwidth percentage with respect to close price.
This is not same as Bollinger Percent B - which is measure of where price is with respect to band. Instead this indicator is similar to ATR Percent indicator published here:
Plotting is color coded to indicate volatility zone:
Red : Extreme volatility
Orange : High volatility
Lime : Low volatility
Green : Extreme low volatility
These levels are again derived by long period bollinger bands

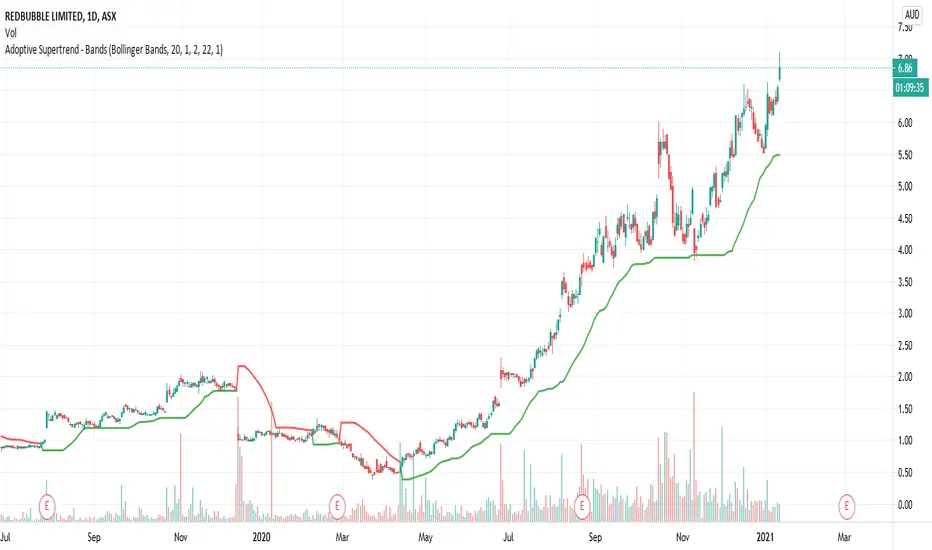
Adoptive Supertrend - BandsAnother adoption of supertrend. This time based on different channels - Bollinger Band, Keltner Channel, Donchian Channel and Pivot point based Donchian channel.
When price hits top of bands, it is considered as start or continuation of uptrend. When price hits bottom of the band it is considered as start or continuation of downtrend. Hence, supertrend is drawn based on these calculations. Use ATR Periods and ATR Multiplier to create stops certain ATR away from band's top and bottom.
Other supertrend adoptions published are here:
Pivot point based donchian channel is published here:
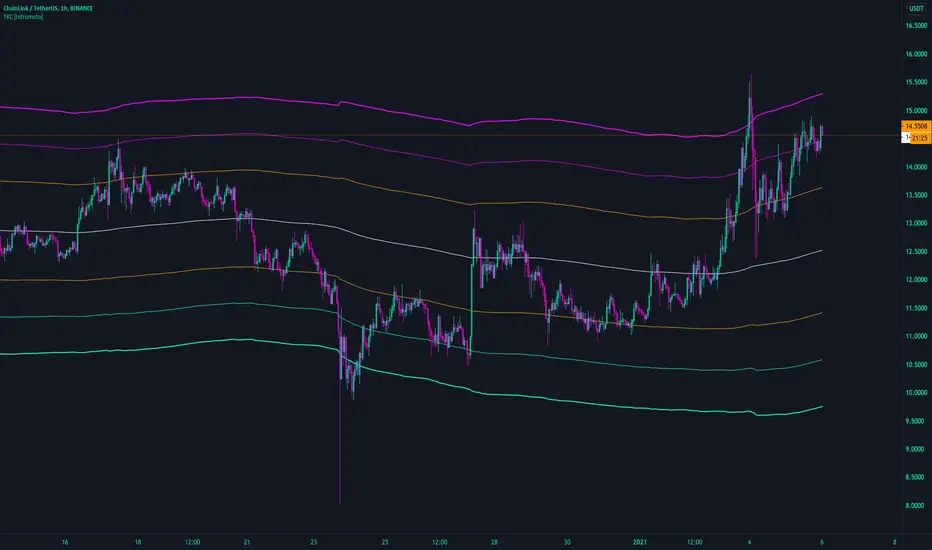
TKC [Intromoto]This is a series of three Keltner channels, which are essentially sets of EMAs with a multiplier to spread them for dynamic support and resistance structures.
Keltner can be used similarly to Bollinger Bands, but price can remain outside of the EMA range for extended periods of time.
Users can change the collective resolution, individual length, individual multiplier, and calculation style of each of the sets.
By default, the Keltner channels all have length of 500 and multipliers of 4, 7, and 10. Fills are available between each upper and lower EMA of the channel.
I use this for trend analysis and when price is prone to reversals.
DM for access.
Thanks
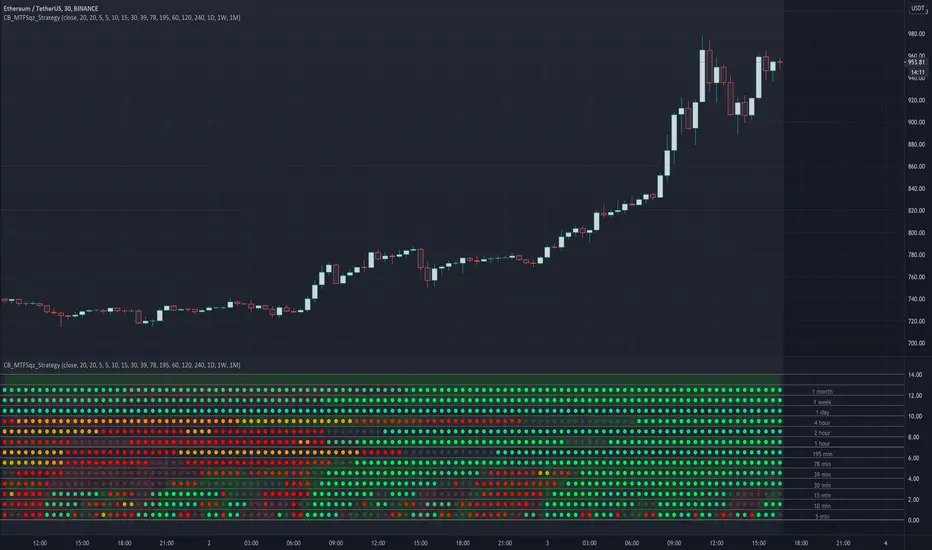
CryptoBreakers MTF Sqz StrategyThis is a Multi Time Frame squeeze strategy that has been consistently catching large BTC and ETH moves.
It's building up on the basic squeeze play of both the upper and lower Bollinger Bands going inside the Keltner Channel
and in one indicator quickly seeing when both Bollinger Bands start to come out of the Keltner channel and positioning us
for the large move that is about to take place.
Before I explain the rules for the winning strategy, let's cover the basics on the indicator.
1. When both the upper and lower Bollinger Bands go inside the Keltner Channel, a compression is in place, and the squeeze is on. This is reflected on the indicator as colored dots.
2. The indicator covers 5min, 10min, 15min, 30min, 39min, 78min, 195min, 1hr, 2hr, 4hr, 1 day, 1 week, and 1 month timeframes for squeezes.
Your chart needs to be set to the lowest time frame resolution of 5min in order for the indicator to show squeezes in all higher timeframe resolutions.
So whatever your chart resolution is, the indicator will show the squeezes in that timeframe and above correctly.
3. ORANGE dots indicate high level of compression. RED dots indicate medium level of compression. BLACK dots indicate low level of compression and the GREEN dots indicate no compression.
4. Generally, higher the level of compression and the longer duration of the squeeze, the more explosive the move expected. With this one indicator I was able to consistently catch 500 plus
point moves in BTC and 30-50 point moves in ETH.
Let's review the rules of the strategy:
1. For the ideal set up, we look for two lower timeframe resolutions (preferably 30 and 39 minutes OR 39 minutes and 78 minutes) to be in squeeze for at least 6 dots and at the sametime we
need to see one or two higher timeframe resolutions in squeeze (195 minutes and 1 day OR 1 day and 1 week resolutions)
2. Determine the direction of the trend in the higher time frames (bullish and bearish). We look for stacked up or down EMAs of 8, 21, 34, 55 and 84 on a daily and/or weekly chart.
3. For entry, wait for the lower timeframe squeeze to fire meaning look for the first green dot after the black, red, or orange dots (minimum six in total).
For example the 30 min row shows the first green dot after the sequence of squeeze dots and the direction of the price movement (up or down) at that green dot bar aligns with the direction of the price movement in the higher timeframe chart.
4. Once the lower timeframe squeezes fire, we follow the move to continuation of the firing of the higher timeframe squeezes.
5. Our exit will be at the price point of 6-9 green dots after the higher timeframe squeeze fired in the same direction as the lower timeframe.
I created this to make it easier to see the set up on any stock and crypto chart. It has been working consistently on BTC and ETH price action. I have not seen anything on TV that cover multi time frame squeeze play in a very simple and clean way.
This makes it very easy to see the set up with one indicator. I'm using this with my trading group.
If you would like to get access, please feel free to DM me at @CryptoBreakers
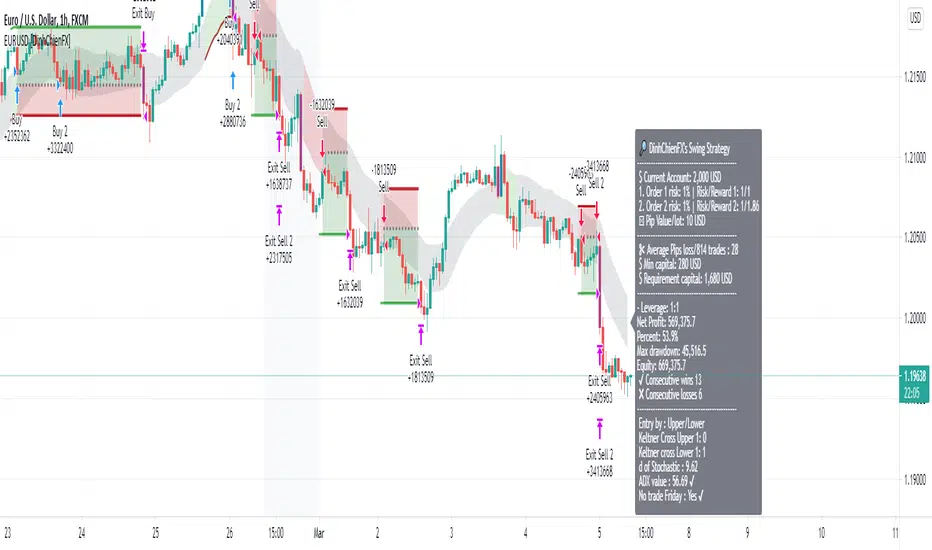
EURUSD DinhChienFX's signal V4.0Risk/reward: 1/1.3 | Entry by: Upper/Lower | Keltner crossing: 2 | Candle not entry: 80% | Stochastic: 70/15 | Adx: 31/9/9 | Notrade friday
Max risk: 3% - Risk / reward: 1 / 1.3.
1. Trend identification:
... Keltner: Price Through Upper / Lower 1 gives 1 point. 2 points are eligible for entry.
... Stochastic:
...... k> 70: Uptrend. k <15: Down trend.
... ADX: 31 provides strong trend following signal.
2. Entry point:
... Price corrects to Upper / Lower when 3 conditions Keltner , Stochastic & ADX indicator meet.
3. Not trade friday.
-------------
"Use the link below to obtain access to this indicator" or "PM us to obtain access"
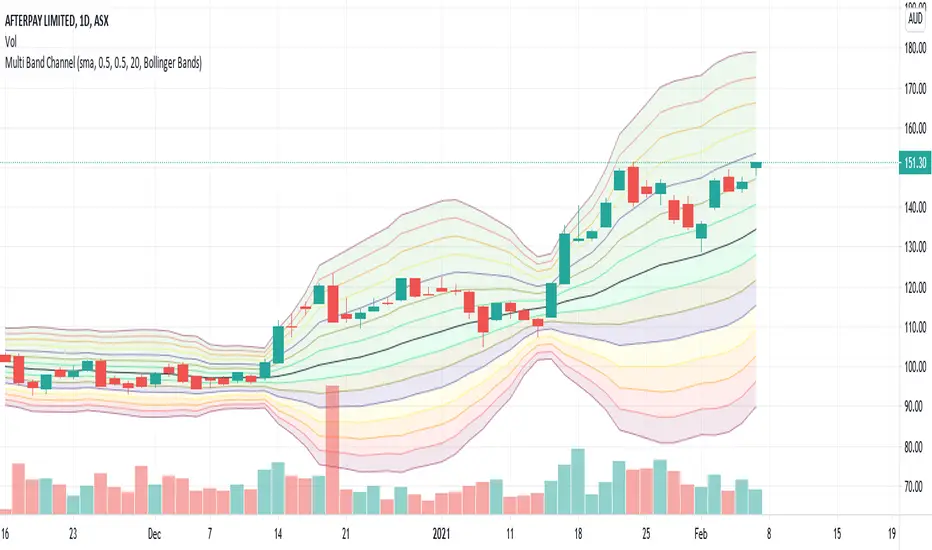
Multi Band ChannelPutting multiple bollinger bands/keltener channels together helps visualize the relative price movement. I have also used this in my BuyTheDip V2 strategy to measure dip and bounce back. 7 Standard deviation is used here. These are calculated based on the input fields StdDevStart and StdDevStep .
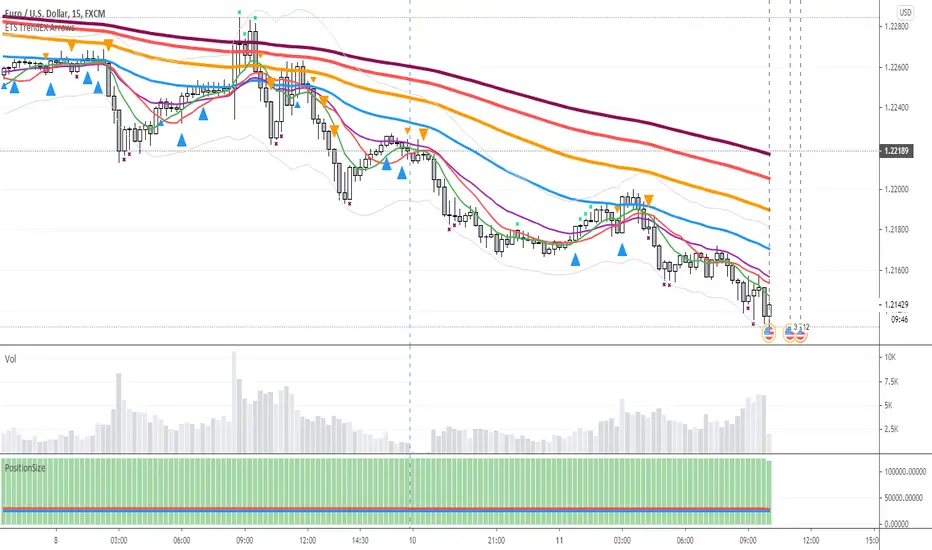
ETS Trend Early Cross ArrowsThis indicator is an updated version and alternative to the ETS Trending Arrows indicator that contains the results of years of trial and error to create an indicator aiming to mimic market entry points that a professional trader would take.
It has arrows to clearly show potential market entry points, and suggested stop-loss levels. This particular updated version of the Trending Arrows indicator responds faster to market direction changes, even before the main trend starts to change.
To use this indicator in the best way, with the best entry point, wait for the market to return close to, or touch, one of the moving averages. The larger the moving average, the better, and then enter in the direction indicated by the arrow. The arrow will not repaint once the bar closes, so use the initial arrow's appearance to prepare yourself to enter a trade, and then wait for your perfect entry that is close to a moving average or support/resistance level.
What Makes It So Powerful?
- Give you a signal as early as possible and does not "repaint" once the bar completes
- Reacts to fast market direction changes like a master trader
- Is super easy to understand and implement in your trading
- Can be used for Forex, Stocks and Crypto
- Works on all timeframes
How To Use The ETS Trend Early Cross Arrows (ETS TrendEX Arrows) Indicator
1. Add the indicator to any chart you wish to trade, Crypto, Forex or Stocks and set it to the timeframe you prefer. For instance, I use it on 1 minute and 5 minute charts for daytrading Stocks. For Forex I generally use a 15 minute chart, and longer timeframes for Crypto.
2. Open the Settings. Generally you should not need to change anything:
2.1. "Show 20, 50, 200 Moving Averages" - This is just a convenience, and is provided to help you identify where the market is trading in relation to the trend.
2.2. "Show Small Expo Moving Average" - Also provided for convenience, and goes with "SMAX" - Simple Moving Average - and the "EMAX" - Exponential Moving Average settings
2.3. "Show Potential Reversal Points" - You will notice small X indicators that appear when it's detected that the market might soon be reversing or at least halting and going sideways. A small red X at the bottom of a candle indicates that the market might not be moving further down much, warning you against taking a short position. While a small green X above a candle indicates that the market may be exhausted and soon reverse or at least stall. When the market eventually goes past the highs and lows indicated by these levels, the market often continues on its previous trend.
2.4. "Delength" - The length setting for the DeMarker indicator that's used internally.
2.5. "KC Length" - the Keltner Channel length setting.
2.6. "KC Multiplier" - the Keltner Channel multiplier setting.
2.7. "KC Source" - the Keltner Channel source setting.
2.8. "KC Exponential" - the Keltner Channel exponential or simple setting.
3. Now that you've set things up, all you need to do is to wait for a signal. Pay attention to where the market currently is in relation to the closest moving average, like the 10 SMA or 12 EMA . Keep in mind that price will often signal a new move, but then first move back to the average, before continuing in the new direction identified by the trading arrow.
4. Larger arrows are signals that go with the shorter term trend, and smaller arrows indicate a potential change in the market direction that is not yet in line with the shorter term trend. Typically it should be best to enter using the larger arrows, and be cautious, or exit a trade, that is counter to the smaller arrows.
5. These signals are intended to identify new trending moves, and for that reason, if the market moves against the signal, you should not hold on to your position hoping that it will turn in your favor.
6. When the market is moving in your favor, resist the urge to exit quickly, and use the smaller moving averages or support/resistance levels to exit your trades.
This is an "invite only" script, which means that you will need to let me know that you're interested in it before you can get access to it. This is a paid script, please follow the link in my profile to get the details or ask me directly. It may take up to 48 hours for me to respond, but I do my best to respond as quickly as possible. You will get 7 days to test it for yourself on all your charts with no restrictions.
Screener - Mean Reversion Channel█ OVERVIEW
This is Screener script for Mean Reversion Channel Indicator
█ Description & How To Use
The screener works by scanning through up to 40 symbols and list down symbols that are currently within Overbought/Oversold Zone as defined by Mean Reversion Channel indicator.
The Overbought/Oversold Zone are further categorized and sorted by:
Strong : Indicated by "(Strong)" next to the symbol name
Normal : Indicated by the absence of "(Strong)" or "(Weak)" next to the symbol name
Weak : Indicated by "(Weak)" next to the symbol name
Notes: Refer to chart above to see how the Zone are categorized.
Notes: If the screener displays "Nothing Interesting". It simply means none of the screened assets are within the Overbought/Oversold Zone.
█ Features
- Scan up to 40 symbols at a time (By default, no asset is define. Once configured all the symbols you required, remember to save as default to save you from pain of configuring it again in the future)
- Options to scan by zones
- Custom Timeframe
█ Limitation
Due to multiple use of security() function required to call other symbols, expect the screener to be slow at certain times
█ Disclaimer
Past performance is not an indicator of future results.
My opinions and research are my own and do not constitute financial advice in any way whatsoever.
Nothing published by me constitutes an investment recommendation, nor should any data or Content published by me be relied upon for any investment/trading activities.
I strongly recommends that you perform your own independent research and/or speak with a qualified investment professional before making any financial decisions.
Any ideas to further improve this indicator are welcome :)
Credit: QuantNomad for his script idea on custom screener

Keltner Channel [LINKUSDT] 1HThis is a long-only strategy tested on LINK/USDT, 1 hour bar, from Feb 2019. The entry is determined by the breakout of upper Keltnel Channel and when the +DI is higher than 32. Instead of a fixed stop-loss from the original script , I change the exit to the middle band of the Keltnel Channel. 1st profit target will close 20% of the position. 2nd profit target will close 30% of the position. While the remaining 50% position will be closed when the price closes below the middle band of the Keltnel Channel, to take advantage of big trend. All parameters are adjustable. I added another option to enable or disable the ribbon trend filter.
My thoughts: For the same period, LINK appreciated 3000%. So I guess most in and out strategies couldn’t beat a buy and hold strategy during this period. But this doesn’t mean that this strategy is not feasible as each strategy is designed to only take advantage of a certain pattern or behavior of the market. Also, short term strategies allow you to use leverage and hence enable you to use you capital efficiently. Commission is set to 0.1%, taking account of the slippage.
Suggestion: Please perform walk forward analysis before you use real money for trading. Parameters need to be adjusted from time to time depends on your analysis. Can try using ATR for profit targets as over a longer term, the volatility might drop hence a high fixed % profit targets might not be realistic.
Any suggestions are welcome!

Mean Reversion Channel - (fareid's MRI Variant)Description :
Mean Reversion Channel objective, based on Mean Reversion theory ( everything has a tendency to revert back to its mean), is to help visualizing:
Inner Channel -> Dynamic Support and Resistance
Outer Channel -> Overbought/Oversold Zone which may signal consolidation phase or potential reversal due to unsustainable move
Details on some of the filtering type used for mean calculation can be read in Ehlers Technical Papers: "Swiss Army Knife Indicator" and/or his book "Cybernetics Analysis for Stock and Futures"
Disclaimer:
These study scripts was built only to test/visualize an idea to see its viability and if it can be used to optimize existing strategy.
Any ideas to further improve this indicator are welcome :)
