Clean Market Structure & Trend Confirmation ( Updated ) CLEAN MARKET STRUCTURE & TREND CONFIRMATION — 24H CONTINUATION EDITION
This indicator is designed to help traders identify clear market direction, confirm trend strength, and manage trades with structured take-profit and stop levels. It works by aligning trend, momentum, and structure before showing any BUY or SELL signal. Signals are selective by design to reduce noise and false entries.
This version includes an optional continuation mode, allowing additional high-quality signals when trends persist, while still maintaining discipline and structure.
HOW TO LOAD AND USE (IMPORTANT)
Add the indicator to your chart.
Recommended symbols: SPY, QQQ, ES1!, NQ1! (works on stocks and futures).
Recommended timeframes:
• 5-minute (default and most balanced)
• 1-minute (faster, more active, optional)
No refresh is required each day. The script resets automatically.
RECOMMENDED DEFAULT SETTINGS
• 9:25 Bias Filter: ON
• Continuation Signals: ON
• TP Ladder: ON
• Keep Only Most Recent TP Ladder: ON
• Execute on Candle Close: optional (ON = safer, OFF = faster)
These defaults provide the best balance between discipline and opportunity.
HOW THE RIBBON WORKS (CORE TREND FILTER)
The ribbon is the foundation of the system.
• Teal ribbon = bullish trend
• Red ribbon = bearish trend
• Gray ribbon = no-trade zone
The system avoids signals in gray conditions to reduce chop. Only trade in the direction of the ribbon.
BULL AND BEAR DOTS
Bull and Bear dots mark confirmed trend flips.
• Bull dot = trend has flipped bullish
• Bear dot = trend has flipped bearish
These are not trades by themselves. They are early awareness signals that help you prepare for potential entries.
BUY AND SELL ARROWS (TRADE SIGNALS)
BUY and SELL arrows appear only when:
• Ribbon direction is aligned
• Trend structure confirms
• Momentum and volume agree
• Market conditions are favorable
These arrows represent high-probability trade opportunities, not constant signals.
TAKE PROFIT & STOP LEVELS
When a BUY or SELL arrow prints:
• TP1, TP2, TP3 levels appear automatically
• A STOP level is plotted automatically
• Levels are based on volatility and adjust to market conditions
Only the most recent trade plan is shown to keep the chart clean.
CONTINUATION MODE (WHAT’S DIFFERENT)
Compared to the original version:
• This version can take more than one trade per day
• It allows new trades when trends reset and realign
• It does NOT chase every candle
• It still requires full confirmation before each signal
Think of this as adaptive trend participation, not aggressive scalping.
1-MINUTE VS 5-MINUTE USE
• 5-minute: fewer signals, higher confidence, best for most users
• 1-minute: earlier entries, more activity, requires discipline
You do NOT need to switch back and forth constantly. Pick one timeframe and stay consistent.
IMPORTANT NOTES FOR NEW USERS
• Fewer signals is a feature, not a flaw
• Missing a move is better than forcing a bad trade
• Always manage risk and position size
• This indicator assists decision-making — it does not predict the future
DISCLAIMER
This indicator is for educational purposes only. It is not financial advice. Trading involves risk, and you are responsible for all trading decisions. Use proper risk management and only trade with capital you can afford to lose.
Level

SnR Key Level Detector by RWBTradeLabSnR Key Level Detector by RWBTradeLab
A clean, non-repainting key level detector built for price action traders who want clear, fixed Support/Resistance reference levels with breakout upgrades and alerts.
What this indicator does
This script automatically detects and draws 6 types of SnR key levels using CLOSED candles only (no running-candle logic):
1. Base Key Levels (from 2-candle sequences)
* A Level: Green → Red (Level = 1st Green candle Close)
* V Level: Red → Green (Level = 1st Red candle Close)
* Bullish Gap Level: Green → Green (Level = 1st Green candle Close)
* Bearish Gap Level: Red → Red (Level = 1st Red candle Close)
2. Breakout Upgrade Levels
* RBS (Resistance → Support): When a Green candle CLOSE breaks above an A Level or Bearish Gap Level
* SBR (Support → Resistance): When a Red candle CLOSE breaks below a V Level or Bullish Gap Level
Visuals on chart
* Each detected level is drawn as a horizontal Ray extended to the right.
* Optional text labels are placed above/below the level based on the level type.
* Adjustable “Label Offset (ticks)” to keep labels cleaner on the chart.
Alerts (bar-close only)
Built-in alerts trigger only when a candle is CONFIRMED:
* A Level
* V Level
* Bullish Gap
* Bearish Gap
* SBR
* RBS
Each alert includes price and time in the message.
Key settings
* Candle Length (closed candles): Scans last N closed candles (running candle excluded).
* On/Off toggles: Enable/disable each level type and text labels individually.
* Label Offset (ticks): Controls the label distance from the level line.
Non-repainting confirmation
All levels and alerts are calculated on confirmed bars only.
No repainting, no running-bar signals.
Best use
Works on any market and timeframe. For higher reliability, combine with:
* Higher timeframe structure
* Supply & Demand zones
* Trend context and liquidity sweeps
Disclaimer:
This indicator is a level-detection tool, not financial advice. Trading involves risk; always use proper risk management and confirm levels with your own analysis.
Creator: RWBTradeLab
If you find this useful, please leave a like ⭐ and share your feedback.

Levels[cz]Description
Levels is a proportional price grid indicator that draws adaptive horizontal levels based on higher timeframe (HTF) closes.
Instead of relying on swing highs/lows or pivots, it builds structured support and resistance zones using fixed percentage increments from a Daily, Weekly, or Monthly reference close.
This creates a consistent geometric framework that helps traders visualize price zones where reactions or consolidations often occur.
How It Works
The script retrieves the last HTF close (Daily/Weekly/Monthly).
It then calculates percentage-based increments (e.g., 0.5%, 1%, 2%, 4%) above and below that reference.
Each percentage forms a distinct “level group,” creating layered grids of potential reaction zones.
Levels are automatically filtered to avoid overlap between different groups, keeping the chart clean.
Visibility is dynamically controlled by timeframe:
Level 1 → up to 15m
Level 2 → up to 1h
Level 3 → up to 4h
Level 4 → up to 1D
This ensures the right amount of structural detail at every zoom level.
How to Use
Identify confluence zones where multiple levels cluster — often areas of strong liquidity or reversals.
Use the grid as a support/resistance map for entries, targets, and stop placement.
Combine with trend or momentum indicators to validate reactions at key price bands.
Adjust the percentage increments and reference timeframe to match the volatility of your instrument (e.g., smaller steps for crypto, larger for indices).
Concept
The indicator is based on the idea that markets move in proportional price steps, not random fluctuations.
By anchoring levels to a higher-timeframe close and expanding outward geometrically, Levels highlights recurring equilibrium and expansion zones — areas where traders can anticipate probable turning points or consolidations.
Features
4 customizable percentage-based level sets
Dynamic visibility by timeframe
Non-overlapping level hierarchy
Lightweight on performance
Fully customizable colors, styles, and widths

Price Level Highlighter [ldlwtrades]This indicator is a minimalist and highly effective tool designed for traders who incorporate institutional concepts into their analysis. It automates the identification of key psychological price levels and adds a unique, dynamic layer of information to help you focus on the most relevant area of the market. Inspired by core principles of market structure and liquidity, it serves as a powerful visual guide for anticipating potential support and resistance.
The core idea is simple: specific price points, particularly those ending in round numbers or common increments, often act as magnets or barriers for price. While many indicators simply plot static lines, this tool goes further by intelligently highlighting the single most significant level in real-time. This dynamic feature allows you to quickly pinpoint where the market is currently engaged, offering a clear reference point for your trading decisions. It reduces chart clutter and enhances your focus on the immediate price action.
Features
Customizable Price Range: Easily define a specific Start Price and End Price to focus the indicator on the most relevant area of your chart, preventing unnecessary clutter.
Adjustable Increment: Change the interval of the lines to suit your trading style, from high-frequency increments (e.g., 10 points) for scalping to wider intervals (e.g., 50 or 100 points) for swing trading.
Intelligent Highlighting: A key feature that automatically identifies and highlights the single horizontal line closest to the current market price with a distinct color and thickness. This gives you an immediate visual cue for the most relevant price level.
Highly Customizabile: Adjust the line color, style, and width for both the main lines and the highlighted line to fit your personal chart aesthetic.
Usage
Apply the indicator to your chart.
In the settings, input your desired price range (Start Price and End Price) to match the market you are trading.
Set the Price Increment to your preferred density.
Monitor the chart for the highlighted line. This is your active price level and a key area of interest.
Combine this tool with other confirmation signals (e.g., order blocks, fair value gaps, liquidity pools) to build higher-probability trade setups.
Best Practices
Pairing: This tool is effective across all markets, including stocks, forex, indices, and crypto. It is particularly useful for volatile markets where price moves rapidly between psychological levels.
Mindful Analysis: Use the highlighted level as a reference point for your analysis, not as a standalone signal. A break above or below this level can signify a shift in market control.
Backtesting: Always backtest the indicator on your preferred market and timeframe to understand how it performs under different conditions.

Price Level HighlighterThis indicator is a minimalist and highly effective tool designed for traders who incorporate institutional concepts into their analysis. It automates the identification of key psychological price levels and adds a unique, dynamic layer of information to help you focus on the most relevant area of the market. Inspired by core principles of market structure and liquidity, it serves as a powerful visual guide for anticipating potential support and resistance.
The core idea is simple: specific price points, particularly those ending in round numbers or common increments, often act as magnets or barriers for price. While many indicators simply plot static lines, this tool goes further by intelligently highlighting the single most significant level in real-time. This dynamic feature allows you to quickly pinpoint where the market is currently engaged, offering a clear reference point for your trading decisions. It reduces chart clutter and enhances your focus on the immediate price action.
Features
Customizable Price Range: Easily define a specific Start Price and End Price to focus the indicator on the most relevant area of your chart, preventing unnecessary clutter.
Adjustable Increment: Change the interval of the lines to suit your trading style, from high-frequency increments (e.g., 10 points) for scalping to wider intervals (e.g., 50 or 100 points) for swing trading.
Intelligent Highlighting: A key feature that automatically identifies and highlights the single horizontal line closest to the current market price with a distinct color and thickness. This gives you an immediate visual cue for the most relevant price level.
Highly Customizabile: Adjust the line color, style, and width for both the main lines and the highlighted line to fit your personal chart aesthetic.
Usage
Apply the indicator to your chart.
In the settings, input your desired price range (Start Price and End Price) to match the market you are trading.
Set the Price Increment to your preferred density.
Monitor the chart for the highlighted line. This is your active price level and a key area of interest.
Combine this tool with other confirmation signals (e.g., order blocks, fair value gaps, liquidity pools) to build higher-probability trade setups.
Best Practices
Pairing: This tool is effective across all markets, including stocks, forex, indices, and crypto. It is particularly useful for volatile markets where price moves rapidly between psychological levels.
Mindful Analysis: Use the highlighted level as a reference point for your analysis, not as a standalone signal. A break above or below this level can signify a shift in market control.
Backtesting: Always backtest the indicator on your preferred market and timeframe to understand how it performs under different conditions.
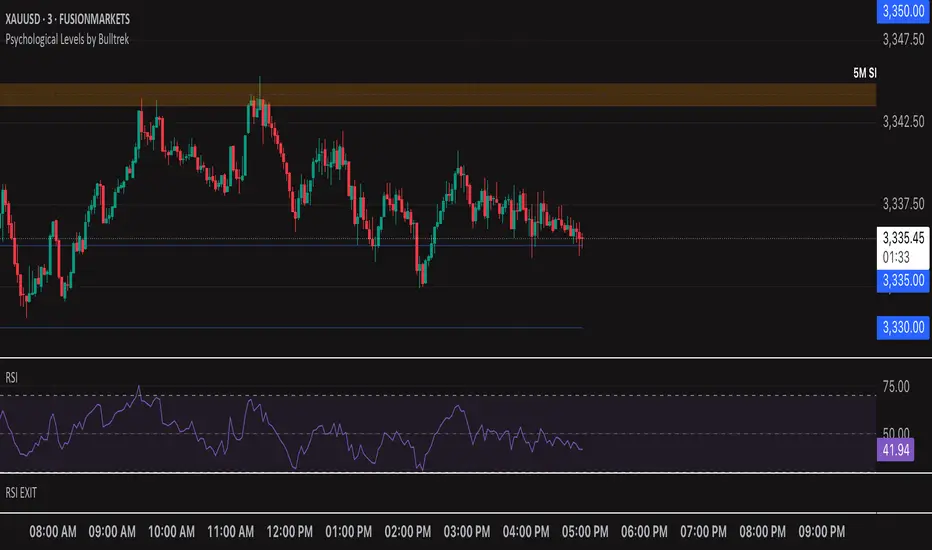
Psychological Levels by BulltrekHello Traders !
This Indicator specifically designed to mark Major price points in terms of Psychological or blind levels for XAU Pairs
You can edit the price points as per your desire and can also use it on other pairs too.
Psychological levels are very crucial price points while trading where major reversals or entry points can be observed.
This Indicator once activated displays a line on the Psychological levels , in case of reset chart settings , you can also customise the chart size in the settings on the indicator.
This Indicator is developed by Rahul Jain - Founder of Bulltrek Technology
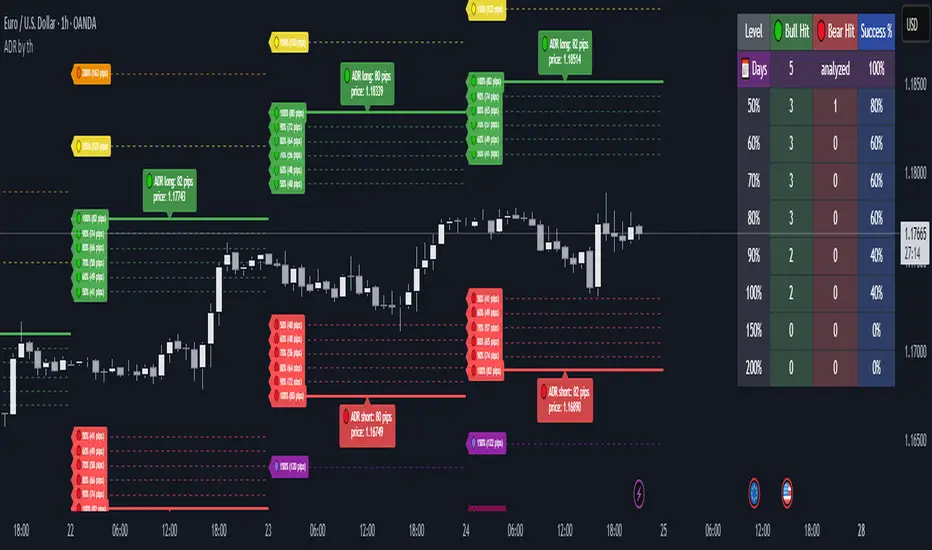
Average Daily Range ADR by thSpecial for Amer and ATR testing and some text for description which I will add a little bit later because beatiful tv can't pass my indicator to be published
Candle Pattern Signals - Global Lowest/HighestForex Indicator – Precision Tool for Smarter Trading
Unlock the full potential of your trading strategy with this powerful Forex indicator. Designed to identify high-probability trade setups, it combines real-time price action analysis with advanced technical algorithms. Whether you're a scalper, swing trader, or trend follower, this tool provides clear entry and exit signals to boost your performance. Compatible with all major currency pairs and optimized for MetaTrader 4/5. Take your trading to the next level – trade smarter, not harder.
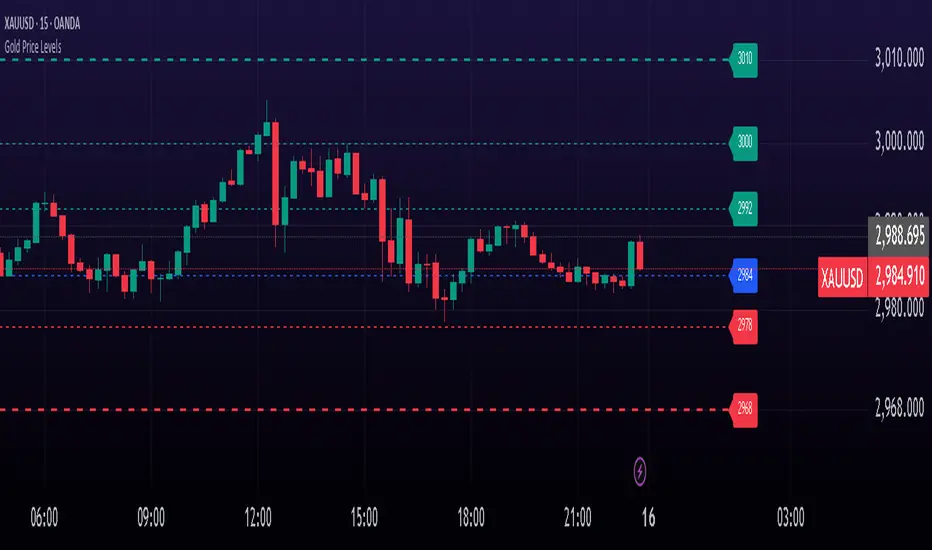
Gold Price LevelsThis indicator identifies and displays key price levels for gold trading. It highlights important psychological and technical price points that often act as support and resistance levels.
Features
Automatically identifies and displays key price levels ending in 92, 84, 78, 55, 42, 27, and 00
Special emphasis on critical levels ending in 68, 32, and 10 with increased line width
Color-coded visualization: green for levels above current price, red for levels below
Customizable line style, width, and label visibility
Automatically adjusts to different price ranges (works with any gold price)
How to Use
This indicator helps gold traders identify potential support and resistance zones. Watch for price reactions at these levels for potential trade entries, exits, or stop placement. The thicker lines (68, 32, 10) often represent more significant price levels where stronger reactions may occur.
Perfect for both day traders and swing traders looking to optimize their gold trading strategy with key price levels.
Trademania - PVSRA IndicatorTrademania - PVSRA Indicator
The Trademania - PVSRA Indicator is based on a proven MT4 indicator suite that has been in use since 2013. Over time, it has been expanded with additional features and tools. Originally developed for the Forex market, it also works well for cryptocurrencies, stocks, and other assets. The goal of this indicator is to combine classic chart analysis with PVSRA analysis, allowing for a clean mixed chart analysis. Traders gain access to a wide range of important information and can use it to form their trading assumptions. The indicator is designed to make it as simple as possible: identifying price levels at the breakout of key support/resistance, for confirmations above/below an imbalance, or recognizing and validating standard structures.
Important: This indicator is designed to be used across all timeframes. It works equally well for scalping on lower timeframes and for larger timeframes, such as spot trading on the 4H or daily chart.
The following core features are available:
- PVSRA Candles
- Dynamic Zones for PVSRA Candles (Imbalance)
- Market sessions with high/low points
- Integrated EMAs (daily, weekly, higher time frames)
- Fully customizable EMAs
- Pivot points with mid/50% level
- Price ranges from yesterday and last week
- Average daily range (also available for weekly and monthly)
- Psychological levels (for Forex)
- Daily open
- High/Low Point of Control (POC) indicators for wicks and candle bodies
- WIL (Weekly Interest Level) - High/Low of the Asian session
- On-chart labels for nearly all elements
Key Features:
- PVSRA, integrated POC levels, and WIL levels distinguish this indicator.
- Integrated EMAs and the daily, weekly, high time frame EMAs can be supplemented or replaced by custom EMAs for maximum flexibility.
Special Feature:
- Lite Mode for better visibility and simplified chart analysis.
Instructions and Notes
PVSRA Candles
Display volume or tick volume on the chart.
- Candles with more than 200% average volume of the last 10 candles, where the product of candle spread and volume is greater than the last 10 candles/timeframes, are shown in green (bullish) and red (bearish).
- Blue and purple candles show the same with 150% average volume of the last 10 candles.
**Note:** To obtain valid information, the trading volume should be as large as possible. If you're viewing the chart of an exchange with low trading volume, you can use the PVSRA override to display the volume from another exchange. For example, you can view the Phemex chart but display the tick/volume of the Binance chart as PVSRA/Vector candles.
Dynamic Zones for PVSRA Candles (Imbalance)
Zones that match the color of the respective vector candle display imbalance on the chart.
- In PVSRA analysis, it is assumed that such imbalances will be revisited and corrected. It can be customized whether this should happen with candle wicks or just the candle bodies.
Market Sessions with High/Low Points (DST)
Relevant market sessions: Sydney/NZX, Tokyo, Hong Kong, EU, New York, as well as the Brinks sessions pre EU/NY, are marked with high/low points and labeled on the chart.
- In PVSRA/Mixed analysis, these represent important liquidity zones of the individual trading sessions, often serving as key support/resistance levels.
WIL (Weekly Interest Level) - High/Low of the Asian Session
The new WIL levels represent the market open/Asian session of the new trading week: Sydney open to Hong Kong close.
- This forms an important price range for the trading week and is always a key breakout zone or rejection area in mixed analysis. Additional liquidity is needed to break through these levels.
- Higher effort against the start of the week – an imbalance (above/below).
High/Low Point of Control (POC) Indicators for Wicks and Candle Bodies
Additionally, the indicator includes pivot-based POC markers at key highs/lows on the chart.
- A POC is generated from the candle footprint (1000 resolution) and displayed on the chart.
- **Note:** If the POC is in a wick, it is shown as a line; if the POC is only in the candle body, it is displayed in small text.
- In mixed analysis, POCs in volume-heavy wicks are always a key indication of price levels that will be revisited and a potential enhancer for a wick-fill upwards or downwards.
EMA/Pivot Points/Psychological Levels Classic/Average Ranges:
Daily/ADR - Weekly/AWR / High/Low values for day/week, as well as the daily open of the current trading day, form the foundation of the indicator.
- Base structures that account for imbalance must break certain price levels to confirm or invalidate a previous movement (bullish or bearish).
- 13/50/200/800 EMA retrace: Breaking these in either direction without addressing an imbalance on the opposite side requires confirmation after the break.
- Pivot-level trading operates on the same principle.
- **Note:** Pivot levels in this indicator have additional M-levels, which represent 50% markers to provide better insights into potential retraces or upward moves.
- For example: Breaking M1, retracing, and confirming at M1 with a target at M2.
To recognize a standard 3-level rise or retrace scenario in mixed analysis, as well as a potential extended chart progression, these levels are essential.
**Note:** Average ranges such as High/Low ADR are particularly important levels where interruptions are expected. Profit-taking, long/short, is common at these points, independent of standard structures. This also applies to the high/low levels of the last trading day and the weekly versions of these levels.
The daily open helps identify possible SPOT/Futures gaps (depending on the asset, such as a missing futures market over the weekend: NAS/DAX).
Important:
The Lite Mode is designed to help traders reduce the chart to essential core functions (PVSRA/EMA/WIL/Psy/Daily Open/Hi-Lo) to apply classic TA effectively and strengthen a mixed analysis or challenge certain assumptions regarding confirmation and imbalance.
**Note:** It is recommended to additionally use a MACD indicator to identify potential trends and momentum.
- For example, a positive MACD trend supporting a 50 EMA breakout with a target of the 200 EMA under positive imbalance (standard mixed pattern).
To cater to personal preferences or trading strategies, it is possible to add custom EMA values to the indicator without the need for a second or third separate indicator.
All functions are fully customizable within the indicator settings.

Support Resistance DynamicsThe Support Resistance Dynamics indicator is an advanced technical analysis tool designed to identify and visualize key support and resistance levels in real-time. This innovative indicator stands out from traditional support and resistance tools by employing a dynamic approach that adapts to market conditions.
Key Features:
Dynamic Level Calculation: Unlike static support and resistance indicators, this tool continuously updates levels based on recent price action, providing traders with the most relevant and up-to-date information.
Logarithmic Scale Option: The indicator offers a unique logarithmic scale feature, essential for analyzing long-term trends or assets with significant price changes. This allows for more accurate level plotting across various timeframes and price ranges.
Customizable Display: Users can adjust the number of support and resistance lines displayed, allowing for a clean and uncluttered chart view while focusing on the most significant levels.
Adaptive Slope Calculation: The indicator uses an innovative approach to calculate the slope of support and resistance lines, offering options from dynamic adaptation to fixed long-term periods. This ensures the lines remain relevant in both trending and ranging markets.
Enhanced Visualization: With customizable line colors, styles, and transparency, traders can easily distinguish between support and resistance levels, improving chart readability and analysis.
Flexible Period Settings: From dynamic calculations based on recent pivots to fixed long-term periods, the indicator adapts to various trading styles and timeframes.
The Support Resistance Dynamics indicator is particularly useful for:
Identifying potential reversal points in trends
Setting more accurate entry and exit points for trades
Placing stop-loss orders with greater precision
Recognizing breakout levels for potential new trends
By combining dynamic calculation methods with customizable visual elements, this indicator provides traders with a powerful tool for market analysis. Whether you're a day trader looking for short-term opportunities or a long-term investor analyzing macro trends, the Support Resistance Dynamics indicator offers valuable insights to enhance your trading strategy.
This indicator is provided for informational and educational purposes only. It should not be considered as financial advice or a recommendation to buy or sell any financial instrument. Past performance is not indicative of future results. Trading involves significant risk of loss. Users should conduct their own research and due diligence before making any investment decisions. The creator of this indicator is not responsible for any losses incurred from its use. Always test thoroughly on demo accounts before applying to live trading.

[DarkTrader] Pivot Point HeatmapThe indicator calculates pivot points using price data from different timeframes such as 12M, 1M, 1W, 3D, and 1D. For each timeframe, it retrieves the high, low, open, and close prices of the previous bar. The pivot point is calculated as the average of the high, low, and close prices, which provides a central level where market sentiment may shift. This calculation is repeated for each timeframe, ensuring a multi-dimensional view of potential interest zones.
Importance of Pivot Points :
Pivot points are essential tools in technical analysis, providing traders with levels that act as potential support and resistance zones. These zones help identify price levels where reversals or breakouts are more likely to occur.
Visual Representation :
The core feature of this indicator is its ability to visualize pivot points as a heatmap on the chart. Instead of showing just the latest pivot points, it tracks the historical pivot swipe, providing a dynamic view of how price interacts with these key levels. Each pivot point is represented by a line, color-coded based on its position relative to other points, creating a gradient effect that highlights the most critical price areas.
Customization Options :
Traders can customize various aspects of the heatmap to suit their preferences. The indicator offers options to toggle pivot swipe history, enabling traders to either focus on the most recent price interactions or consider how price has behaved over time. The background color and pivot line colors are fully customizable, making it easy to match the heatmap with your chart's theme or emphasize certain price levels.
Detecting Sweeps and Price Interaction :
Another important feature is the detection of price interactions with pivot levels. If the current bar's high and low cross a pivot point, it signals that the pivot level has been "swept" by price action, potentially indicating a change in market sentiment. The indicator either extends the line if the pivot point remains relevant or deletes it if price has broken through. This dynamic adjustment helps traders stay updated on which pivot levels are still valid.

Forex lot size calculation🔶What it is ?
Forex lot size calculation is an indicator to help traders to manage trading account better and avoid emotion when you're changing account from small to bigger capital.
This indicator calculates lot size to entry by calculation risk in percent that you're planing for a position and your account balance also.
Our purpose is, keep your mind always "Empty" during trading even you're managing 100k$, 200k$ and more, espeically when you're changing from small account to bigger account.
The diffirence here is only Lot size you will input, we don't need to focus on how many money in dollors will we lost after a position. Each position, that's 1%, 2% balance , just like that. From that point, we can control emotion better and trade more effectively.
🔶 Who can use it ?
1. All traders who are using NCI, ICT , MACD system and other systems...
2. All traders who are trading on any timeframe
3. All traders who are trading on Forex market
4. All traders who are new or experienced traders
5. All traders who are swing or scalping traders
🔶 The purpose of indicator
1. Calculate lot size for all forex pairs exactly to trade on other platform like MT4/5, Ctrader and even Tradingview.
2. Exchange from risk by percent of account to lot size
3. Helping you to manage trading accounts easier
4. Always "Empty your mind" during Trading
🔶 How will indicator appear on chart
After you added it on chart, indicator will appear as table at your bottom right of chart. You can change it to Top-center as above chart by setting that I will guide you right on below.
In general, you can see three data :
1. Acc size $: That's your account balance you already input
2. %Risk : Here is risk by percent that you're planing to trade
3. LOT SIZE : Here is value after calcuation to help you can know how many lot size to entry.
Indicator will show you as three colors also :
GREEN : You're taking risk at a safe level that's less than 1%your account. You normally can trade better and manage trade easier with risk like that.
WHITE : You're taking risk at a normal level that's from 1 - 2% your account. You should becareful during taking this risk because it is only for experience traders.
RED : You're taking risk at a dangerous level that's greater than 2% your account.
This type of risk is only for top trader who can earn profit from mange consistency for a long time. Plus, with this type of risk, you will be rejected by prop firm companies easier because of gambling rules.
🔶 INPUT value
There're 2 groups for trader to input and use this indicator :
1. Trading input :
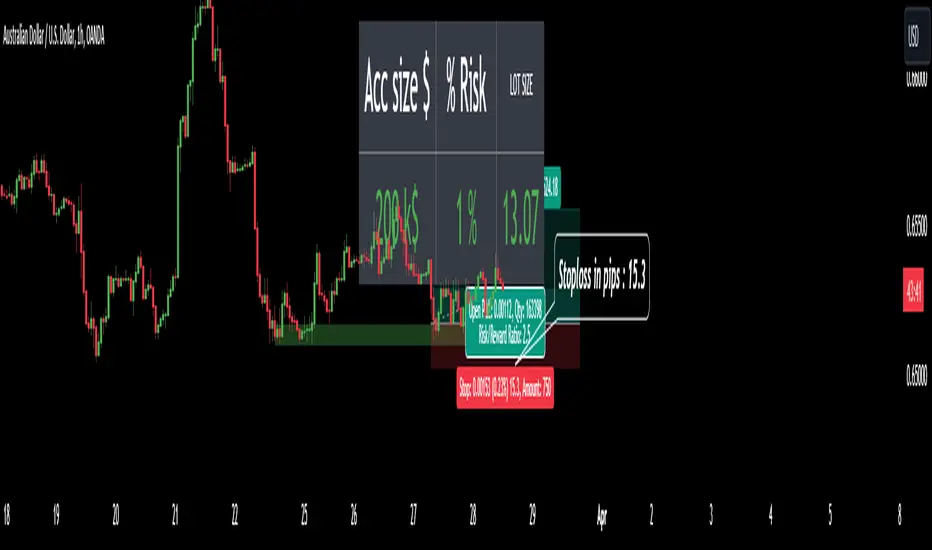
You need to input data to calcuate lot size here
- Your account balance : here is your initial account balance that you deposit
- Acc risk % : Here is risk by percent you're planing for each position.
- Stop loss by pips : Here is stop loss by pips for your position.
Explanation about stoploss by pips in Forex
Please help to refer to my chart above, that's a buying position in Tradingview. Tradingview measured all needed data in pips for you.
For example : My buying position on have chart having stop loss value is 15.3 pips.
I just need to input stoploss here as 15.3.
2. Display setting
Here is the place we will set the text size and location of table.
- Font size : The size of texts in this indicator. You can choose from tiny to Huge size
- Location : The position of indicator on chart. You can put it from bottom to top and left to right as your favorite
🔶 How to use indicator
After setting indicator, you need to input all data to Trading input group :
1. Your account balance
2. Acc risk %
3. Stop loss by pips
And then click to OK.
Indicator will calculate and give out LOT SIZE for you to entry.
It will remember your account balance and risk %, so you just need to input stop loss for your diffirence trades.
As chart above, I input my initial account as 200k$ and I normally take 1% risk for each position.
I want to buy at green box on chart above with SL is around 15.3 pips on AUDUSD.
Indicator helped to calculate lot size as 13.07 lot to trade.
I hope this indicator help you to trade and manage account better.
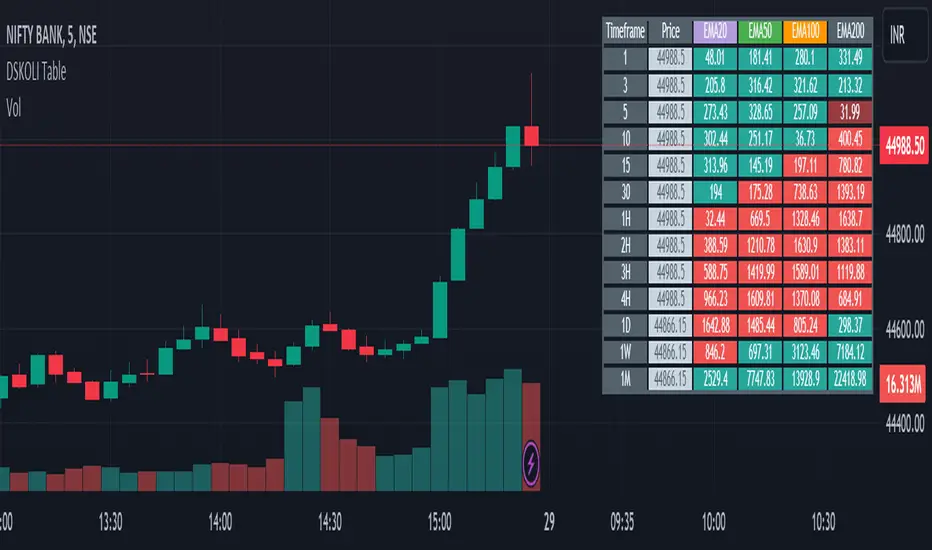
DSKOLI TableThis helps to determine bullish or bearish trend of any chart on any generally available time-frame and good to have for Intraday watch.
Details -
a. Points shown in table shows the difference of last shown price from specified EMAs, this helps to know the price movement of candles are above or below the EMA and its coloured with red and green which even further helps to determine its existing trend.
Note or Disclaimer:
1. This may be considered only for Watching as Learning and informational purpose.
2. Take advice from financial advisor before entering, holding, converting or exiting from any order or trade.
3. Always keep your acceptable stop-loss in all your transactions while trading or investing.
DSKOLI or TradingView reserves all right and don't hold any responsibilities for any loss/losses as well as accuracy of levels or price movement.
Histogram-based price zonesThis indicator provides a new approach to creating price zones that can be used as support and resistance. The approach does not use pivot points or Fibonacci levels. Instead, it uses the frequency of occurence of local maxima and minima to determine zones of interest where price often changed direction.
The algorithm is as follows:
- Gather price data from the last Lookback trading periods
- Calculate rolling minima and rolling maxima along the price points with window size Window size
- Build a histogram from the rolling extrema which are binned into different zones. The number of bins and therefore the width of a zone can be adjusted with the parameter Zone width factor
- Select only the top fullest bins. The number of bins selected for plotting can be controlled with Zone multiplier
The result are a number of boxes that appear on the chart which mark levels of interest to watch for. You can combine multiple instances of this indicator on different settings to find zones that are very relevant.
Shown as an example is the Nasdaq 100 futures ( NQ1! ) on the D timeframe with levels built from the last 100 periods with default settings. The boxes are the only output of the indicator, no signals are created.

Psychological levels (Bank levels) PsychoLevels v3 - TartigradiaPsychological levels (Bank levels) plots the closest "round" price levels above and below current price, based on neuroscience research of how humans intuitively calculate in logarithms.
Psychological levels, also called bank levels, are "round" price numbers, by truncating after the nth leftmost digits, around which price often experience resistance or support, because traders and investors tend to set orders around these round numbers.
The calculation done here is fully automatic and dynamic, contrary to other similar scripts, this one uses a mathematical calculation that extracts the 1, 2 or 3 leftmost digits and calculate the previous and next level by incrementing/decrementing these digits. This means it works for any symbol under any price range.
This approach is based on neuroscience research, which found that human brains intuitively approximate numbers on a logarithmic scale, adults and children alike, and similarly to macaques, for more info see Numerical Cognition , Weber-Fechner Law , Zipf law .
For example, if price is at 0.0421, the next major price level is 0.05 and medium one is 0.043. For another asset currently priced at 19354, the next and previous major price levels are 20000 and 10000 respectively, and the next/previous medium levels are 20000 and 19000, and the next/previous weak levels are 19400 and 19300.
IMPORTANT: Please enable "Scale price chart only" in the chart's scale's options, as otherwise major levels may make the chart's scale very small and hard to read.
How it works
At any time, there are 3 levels of strength (1 leftmost digit, 2 leftmost digits, 3 leftmost digits) represented by different sizes, and 3 directional levels for each of these strengths (level above, level below, and half-level) represented by different colors and positions, around current price.
Indeed, contrary to other similar price levels scripts, we do not plot ALL price levels at all times, because otherwise the chart becomes wayyy too cluttered, and also it's highly processing intensive to plot so many lines. So we here use a dynamical approach: we plot only the relevant levels, the closest ones according to current price.
Hence, when a level disappears, it does not mean that it does not exist anymore, but simply that we are not drawing it right now because it is not pertinent for the current price movement (ie, too far away).
Breakouts can be detected in two different ways depending on if SMA is set to a value higher than 1 or not: if SMA == 1, then there is no smoothing, so the levels adapt instantaneously to the current price, so to detect breakout, you should refer to the levels at the previous tick and whether they were broken by current tick's price; if SMA > 1, then there is some smoothing, and so the levels will stay in-place even if there is a breakout, so it's easier to spot breakouts without having to look at the previous ticks, but on the other hand you won't see the new levels for the new price range until after a few more ticks for the smoothing window to adapt. Hence, by default, smoothing is disabled, so that you can see the currently pertinent levels at all time, even right after or during a breakout.
By default, the strong above level is in green, strong below level is in red, medium above level is in blue, medium below level is in yellow, and weak levels aren't displayed but can be. Half levels are also displayed, in a darker color. Strong levels are increments of the first leftmost digit (eg, 10000 to 20000), medium levels are increments of the second leftmost digit (eg, 19000 to 20000), and weak levels of the third leftmost digit (eg, 19100 to 19200). Instead of plotting all the psychological levels all at once as a grid, which makes the chart unintelligible, here the levels adapt dynamically around the current price, so that they show the above/below/half levels relatively to the current price.
Indeed, "half-levels" are also displayed (eg, medium level can also display 19500 instead of only 19000 or 20000). This was made because otherwise the gap between two levels was too big, especially for the strongest levels (eg, there was no major level between 20000 and 30000, but with a half-step we also get a half-level at 25000, and empirically price tends to respect these half levels - I also tried quarter levels but empirically the results were not good). In addition to this hard-coded half-level, you can also create more subdivisions (eg, quarter levels) by setting the simple moving average to a value higher than 1.
The script can be made to run on the daily timeframe whatever the current chart's timeframe is, to reduce the variability in levels, to make it less noisy than intraday price movement. But by default, the chart resolution is used, because I empirically found that the levels found with this indicator work on all time resolutions quite well.
The step can be adjusted to increase the gap between levels, eg, if you want to display one every 2 levels then input step = 2 (eg, 22000, 24000, 26000, etc), or if you want to display quarter levels, input 0.25 (eg, 22000, 22250, 22500, etc). The default values should fit most use cases and cover most psychological levels.
How to read
Focust first on bigger dotted levels, they are stronger and more likely to cause a rebound or a major event or price to stay at this level.
Remember that it's not enough to just look at levels, the context is important, because levels have various effects depending on current price movement: if price is above a level, the level is a support on which price can rebound; if price is below a level, the level is a resistance on which price can rebound (or break); and finally sometimes price also stays hovering around a level for some time.
Levels closer to 9 are less weaker, and levels closer to 0 are stronger, according to Zipf law. This is now reflected since v3 in the transparency, levels that are closer to 9 will be more transparent.
The switch in color for the same level illustrates how a level switches from being a support to a resistance and inversely. Eg, if a major level turns from green to red, then it changed from being a resistance (above) to a support (below).
As is well known in trading, longer standing levels are stronger. This indicator provides a direct illustration: in practice, the number of consecutive dots on the same line influences the strength of the level: the longer the chain of dots, the more you can expect this price level to be significant. The length does not mean the level will necessarily hold, but that other traders are likely to monitor if it holds, and if not then price will break down. Hence, longer levels are good spots to place stop losses, or to enter trades depending on your strategy. In general, a single dot is not enough to consider a level significant, but 2 or more is a good enough level, and 10+ is a strong level. Intuitively, this makes sense, and is what pro traders do: the longer a level is tested, the stronger it is. This indicator can visually represent this intuition and allows to use it as a more systematic trading signal.
Motivation
I initially made the first version of the PsychoLevels indicator mainly to train with PineScript, but I found it surprisingly accurate to define levels that are respected by price movements. So I guess it can be useful for new traders and experienced traders alike, as it's easy to forget that psychological levels can often be as strong if not stronger than technical levels. It can also be used to quickly screen other minor assets for trading opportunities. For example, a hybrid strategy would be to manually define levels on BTCUSD but using this script to automatically define levels in crypto altcoins and quickly screen them for a trade opportunity that can be greater than with BTCUSD but with the same trend.
Personally, although initially I did not believe an automated tool would work well for this purpose, I could now empirically verify that it is quite reliable for the purpose of detecting levels, and so I use it all the time to find the levels automatically and help me monitor them like a hawk, so that I only have to draw uber major levels, the ones that last between cycles and that are hard to autodetect, but otherwise all daily/weekly levels are usually covered. However, trendlines must still be drawn manually or with another indicator (but note that up to now I have found none that worked well enough), as PsychoLevels only draws levels (ie, horizontal lines, not oblique ones!).
Differences with the previous version PsychoLevels v2
price levels now have a transparency according to their importance for the human brain: numbers closer to 9 are weaker, and numbers closer to 0 are stronger and represent a major psychological threshold (eg, that's why prices marked as $9.99 sell better than $10.00). This option can be disabled to get the exact same behavior as v2.
modularized and typed code
PsychoLevels v2 can be found here:

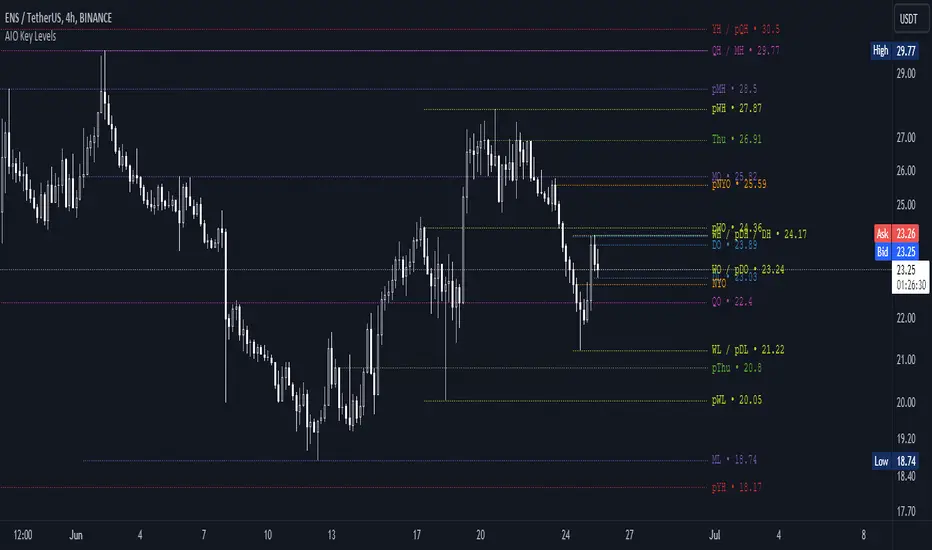
AIO Key LevelsAll In One Key Levels - Displays key levels for any type of chart.
Over 30 levels at your complete disposal.
Filled with a host of features that allow you to customise the appearance and display of the indicator to suit your individual trading style.
The result is a clear and concise indicator that helps traders easily identify key levels.
- The indicator is easy to use and does not need a detailed description.
- With customisable input parameters such as display style, line style, font style, offset, threshold and index.
- The colours for the key levels can also be customised.
- The script uses a 'switch' function and selected input parameters to set display, line and font styles.
- The key levels are constructed using the data received and the selected styles and colours.
- A unique cycle helps to improve the readability of the levels without "polluting" the graph with multiple labels
- In addition, I have left hints in the indicator to help you understand it better.
For Pine coders.
Why did I create it when there are many counterparts?
Simply because counterparts have very large and complex code and modest functionality and flex.
Here I have managed to fit it into 100 lines still readable.
You can learn how to call lots of lines and marks with just one function.
I also created a unique loop that connects labels if they are too close together for better visibility on a plot.
I have left detailed comments for each action.
I would be glad if someone could tell me how to make it more easier.
Prior day and pre-market high lowThis indicator displays the:
- Prior day high
- Prior day low
- Pre-market high
- Pre-market low
as a coloured line across the entire session for each individual session on an intraday chart.
For the extended session, this indicator marks the prior day and pre-market high low for each individual session starting at the pre-market and ending in the post-market, a feature not available on other indicators.
This indicator automatically marks out the levels for the prior day and pre-market high low for each individual session, allowing the user to observe how the price action behaves around the prior day and pre-market high low.
Note:
In this script, request.security() used with lookahead = barmerge.lookahead_on to fetch prices without offsetting the series by for the extended session does not access future data. This is because for extended session, request.security() sees the start of the session to be at the start of the regular session and ends at the end of the pre-market, when in reality the session starts at the start of the pre-market and ends at the end of the post-market.
Hence in each extended session when the line is first drawn in the pre-market, request.security() returns the value of the prior day high/low, and not future data.
Real Price Line + Dots (for Heikin Ashi)Real Price Line + Dots (for Heikin Ashi)
This indicator is designed for use on Heikin Ashi charts. Its purpose is to enable traders to benefit from price averaging and smoothing effects of Heikin Ashi candles whilst also enabling them to see the current real price line, and optionally, real price close dots on the Heikin Ashi candlesticks.
Features include:
- Optional real price line
- Optional real price close dots
- Customisable colours
- Customisable line style
- Customisable line width
What are Heikin Ashi candles?
Heikin Ashi means 'average bar' in Japanese, Heikin Ashi charts do not show real price as standard, due to the way the Open, High, Low and Close values are calculated using averages, This is done in order to create a smoother appearance and reduce the market 'noise'.
You can read more about Heikin Ashi candlesticks here.
NOTE:
- If real price dots appear behind the candles, you may need to select the triple dot menu on the indicator then select "Visual order" > "Bring to front" , so that the dots are shown above the candles.
- When using this indicator on a Heikin Ashi chart, the standard Tradingview price line will not show accurate real price. Therefore when using the price line in this indicator, the standard price line should be disabled within the Tradingview 'Chart settings' dialog > 'Symbol' tab > uncheck 'Last', under the 'Price line' section.

Trend line & pivot level
This script can plot pivot levels and trend lines that are haven't broke out.
In the setting, left and right means how to get the pivot. the pivot will be gotten based on the left candles and the right candles. boxes will be auto deleted after the box was broke.
Important: This is just a beta version, if you find some bug with using this script. Don't hesitate to contact me.
What the future version will have? Might be pattern scanner, multi trend line, levels in different time frame, break out alert, or better key level algorithm. Depends on when I have free time.

Candle Price FinderCandle Price Finder
A simple script that finds a candle (or candles) with user defined price levels. Search prices of a candle's high, low, open, close (or any element of the candle).
How To Use:
You can search prices with whole numbers and/or decimals. The search is tail end so if you are looking for a whole number that ends with 00 you type in 00 in search.
Indicator can be used to detect levels of interest, locked in range/points of consolidation. Originally coded to be used with anchored vwap.
Alerts included
In action:

Psychological levels (Bank levels) PsychoLevels v2 - TartigradiaPsychological levels (Bank levels) plots "round" price levels above and below current price, by truncating after the nth leftmost digits, based on neuroscience research of how humans intuitively calculate in logarithms.
Psychological levels, also called bank levels, are "round" price numbers around which price often experience resistance or support, because traders and investors tend to set orders around these round numbers.
Calculation here is fully automatic and dynamic, contrary to other similar scripts, this one uses a mathematical calculation that extracts the 1, 2 or 3 leftmost digits and calculate the previous and next level by incrementing/decrementing these digits. This means it works for any symbol under any price range.
This approach is based on neuroscience research, which found that human brains intuitively approximate numbers on a logarithmic scale, adults and children alike, and similarly to macaques, for more info see Numerical Cognition , Weber-Fechner Law , Zipf law.
For example, if price is at 0.0421, the next major price level is 0.05 and medium one is 0.043. For another asset currently priced at 19354, the next and previous major price levels are 20000 and 10000 respectively, and the next/previous medium levels are 20000 and 19000, and the next/previous weak levels are 19400 and 19300.
Usage:
* By default, strong upper level is in green, strong lower level is in red, medium upper level is in blue, medium lower level is in yellow, and weak levels aren't displayed but can be. Half levels are also displayed, in a darker color. Strong levels are increments of the first leftmost digit (eg, 10000 to 20000), medium levels are increments of the second leftmost digit (eg, 19000 to 20000), and weak levels of the third leftmost digit (eg, 19100 to 19200). Instead of plotting all the psychological levels all at once as a grid, which makes the chart unintelligible, here the levels adapt dynamically around the current price, so that they show the upper/lower levels relatively to the current price.
* A simple moving average is implemented, so that "half-levels" are also displayed when relevant (eg, medium level can also display 19500 instead of only 19000 or 20000). This can be disabled by setting smoothing to 1.
* By default, the script runs on the daily timeframe, whatever the current chart's timeframe is. This is to reduce the variability in levels, to make it less noisy than intraday price movement, but this can be changed in the settings.
* The step can be adjusted to increase the gap between levels, eg, if you want to display one every 2 levels then input step = 2 (eg, 22000, 24000, 26000, etc), or if you want to display quarter levels, input 0.25 (eg, 22000, 22250, 22500, etc). The default values should fit most use cases and cover most psychological levels.
I made this script mainly to train with PineScript, but I found it surprisingly accurate to define levels that are respected by price movements. So I guess it can be useful for new traders and experienced traders alike, as it's easy to forget that psychological levels can often be as strong if not stronger than technical levels. It can also be used to quickly screen other minor assets for trading opportunities. For example, a hybrid strategy would be to manually define levels on BTCUSD but using this script to automatically define levels in crypto altcoins and quickly screen them for a trade opportunity that can be greater than with BTCUSD but with the same trend.
Changes compared to v1:
* Deduplicated redundant calculations and hence faster script.
* Added half-step levels, which allows to more easily see breakouts (because the levels are still on-screen).
* All steps are now configuration on the GUI.
* Revamped color scheme.
* And major reasons to post as a separate v2 script rather than updating: because we can't update the original description nor screenshot. I have now read more about the House Rules and saw other scriptmakers, so I am trying to write better descriptions like wizards do, by explaining not only how the script works but what the underlying financial concept is to a neophyte audience.

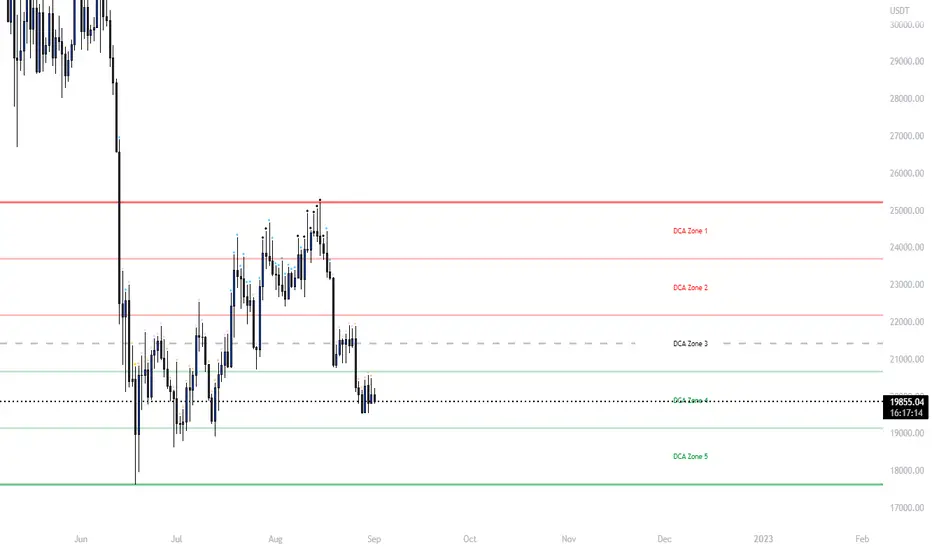
Ultimate Grid Tool + Alerts (DCA & Limit Orders) [enzedengineer]Overview
The "Ultimate Grid Tool + Alerts" script works much like a grid bot from automated trading services such as 3Commas making it a good free alternative with some extra utility.
How it works
The user is prompted to set up a grid by manually defining a lower and upper range and then by selecting how many grid segments they want (max 20). The script will automatically create equally spaced grids within this defined range. The script has built in alerts which are intended to be used in conjunction with a third-party application to execute buy and sell orders on an exchange.
The script has two alert functionalities to choose between:
Limit orders (like traditional grid bots) or;
DCA zones (time-based)
DCA zones:
This is the default selection. Each zone has its own alert condition which is triggered if the price closes within that zone. The frequency of the alert is determined by the user's chart resolution, therefore you can have the alert trigger every day, or 4 hours, or 30 minutes and so on. This allows for flexibility, for example, you could go from DCA'ing at $20 per day at higher prices to $100 per day as the price drops into the lower end of your grid range.
Limit orders:
This mode is selected by checking the "Limit Order" box. As mentioned earlier, this mode works like traditional grid bots with each grid line representing a limit order. The alert condition is met when ta.cross(close, gridline) = true.
Buy and Sell:
This mode is selected by checking the "Buy and Sell" box. This is a visual modification only which changes the colour of the grids to help plan the user's trading. Please note, there is no buying or selling logic within the script itself - this should be built into the alert message to be used with a third-party application for exchange order execution.
Use case: The author of this script has been using it with the default settings to DCA into Bitcoin in the current bear market. Using a chart resolution of 15 minutes the script purchases x-amount of Bitcoin every 15 minutes (Alertatron executes the exchange orders). This method provides a well blended average price and takes away the internal conundrum of "should I buy some today". No matter what, the bot will make a purchase within at least 15 minutes of the ultimate Bitcoin bottom and arguably this gives a psychological edge and reduces FOMO (fear of missing out).