Smart Money Range [ChartPrime]The Smart Money Range indicator is designed to provide traders with a holistic view of market structure, emphasizing potential key support and resistance levels within a predefined range. This indicator is not just a visually pleasing, but also a comprehensive guide to understanding the market’s dynamics at a given level.
Key Features:
Defined Range: The indicator demarcates a clear range, highlighting support and resistance levels within it. This aids in identifying potential areas of buying and selling pressure. These are derived from highly significant areas that have been touched many times before.
Touches Counter: Underneath the support and resistance lines, there are numerical values that show the number of times price has interacted with these levels. This can provide insights into the strength or weakness of a particular level.
Zig-Zag Projections: Within the range, there's a zig-zag pattern indicating possible future touches, helping traders anticipate future price movements.
Double-Sided Profile: To the right of the range, a dual-profile is showcased. One side of the profile displays the volume traded at specific price levels, giving insights into where significant buying or selling has occurred. On the other side, it reflects the number of touches at that given price level, reinforcing the importance of particular price points.
Customizability: Users have the option to adjust the period setting, allowing them to cater the indicator to their specific trading style and configuration. Additionally, with volume levels settings, traders can adjust the number of bins in the profile for a tailored view.
Levels

Liquidity Levels/Voids (VP) [LuxAlgo]The Liquidity Levels/Voids (VP) is a script designed to detect liquidity voids & levels by measuring traded volume at all price levels on the market between two swing points and highlighting the distribution of the liquidity voids & levels at specific price levels.
🔶 USAGE
Liquidity is a fundamental market force that shapes the trajectory of assets.
The creation of a liquidity level comes as a result of an initial imbalance of supply/demand, which forms what we know as a swing high or swing low. As more players take positions in the market, these are levels that market participants will use as a historical reference to place their stops. When the levels are then re-tested, a decision will be made. The binary outcome here can be a breakout of the level or a reversal back to the mean.
Liquidity voids are sudden price changes that occur in the market when the price jumps from one level to another with little trading activity (low volume), creating an imbalance in price. The price tends to fill or retest the liquidity voids area, and traders understand at which price level institutional players have been active.
Liquidity voids are a valuable concept in trading, as they provide insights about where many orders were injected, creating this inefficiency in the market. The price tends to restore the balance.
🔶 SETTINGS
The script takes into account user-defined parameters and detects the liquidity voids based on them, where detailed usage for each user-defined input parameter in indicator settings is provided with the related input's tooltip.
🔹 Liquidity Levels / Voids
Liquidity Levels/Voids: Color customization option for Unfilled Liquidity Levels/Voids.
Detection Length: Lookback period used for the calculation of Swing Levels.
Threshold %: Threshold used for the calculation of the Liquidity Levels & Voids.
Sensitivity: Adjusts the number of levels between two swing points, as a result, the height of a level is determined, and then based on the above-given threshold the level is checked if it matches the liquidity level/void conditions.
Filled Liquidity Levels/Voids: Toggles the visibility of the Filled Liquidity Levels/Voids and color customization option for Filled Liquidity Levels/Voids.
🔹 Other Features
Swing Highs/Lows: Toggles the visibility of the Swing Levels, where tooltips present statistical information, such as price, price change, and cumulative volume between the two swing levels detected based on the detection length specified above, Coloring options to customize swing low and swing high label colors, and Size option to adjust the size of the labels.
🔹 Display Options
Mode: Controls the lookback length of detection and visualization.
# Bars: Lookback length customization, in case Mode is set to Present.
🔶 RELATED SCRIPTS
Liquidity-Voids-FVG
Buyside-Sellside-Liquidity
Swing-Volume-Profiles

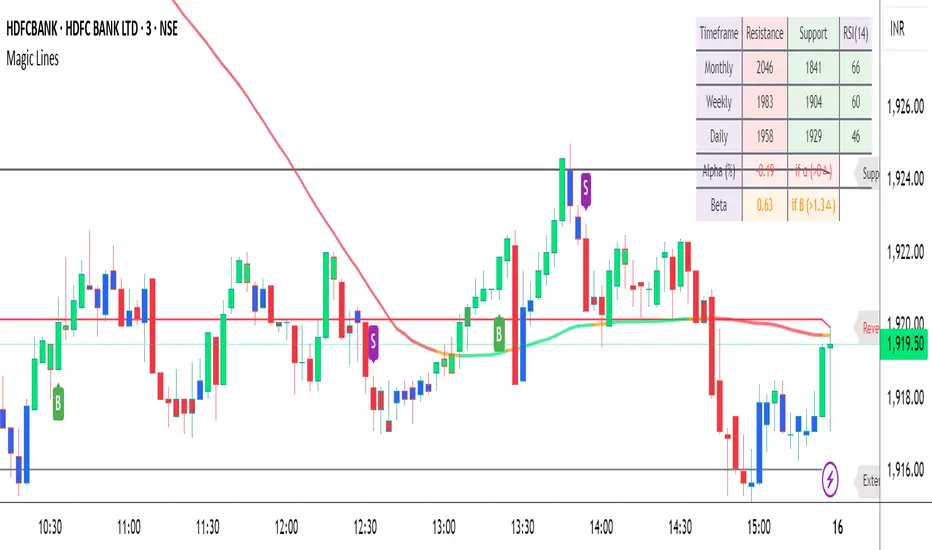
Magic LevelsPS MODS : This indicator calculate the levels based on IndiaVIX, volumes on FnO, cofficient and factor to reach on the level. Hope this can help you to understand the functionality of this Indicator
This indicator is used for draw levels or "Magic Levels/Lines" for Nifty, Bank Nifty and FnO futures, based on volatility (indiavix) calculations. This powerful tool is designed to provide insights into market volatility and assist traders and investors in making informed decisions in the Indian stock market.
As of now the indicator draws levels only on Bank Nifty and Nifty. Soon we'll publish the next update supporting all FnO Futures and stocks.
The India VIX, often referred to as the "Fear Index," is a popular measure of market volatility and investor sentiment. It quantifies the market's expectations of near-term volatility by calculating the implied volatility of NIFTY options. The VIX Levels Indicator utilizes these calculations to draw key levels on price charts, enhancing traders' understanding of potential market movements.
The indicator's main function is to identify critical support and resistance levels derived from IndiaVIX data. We considered to volatility of all the FnO instruments and calculated the mean value keeping the day into consideration while performing the calculations. These levels serve as significant reference points that can help traders gauge potential price reversals, breakouts, and trends. By integrating the Magic Levels Indicator into their analysis, traders can gain a comprehensive view of market dynamics and improve their timing for entering or exiting positions.
Traders can customize the VIX Levels Indicator to suit their preferences, adjusting parameters such as time period where the default is 1 day. This flexibility allows traders to adapt the indicator to different trading strategies and timeframes. Whether a trader focuses on intraday scalping or swing trading, the Magic Levels Indicator can be a valuable addition to their technical analysis toolkit.
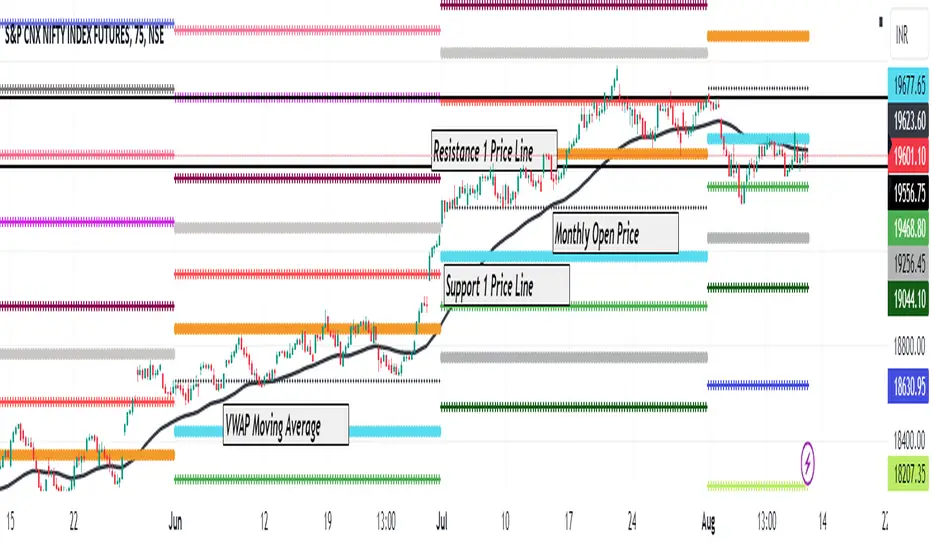
ODSR - Open Driven Support and Resistance LevelsODSR is a support and resistance levels generator indicator which uses Open of the Day, Week or Month (basis time frame selection by user) to calculate support and resistance levels and plot it on chart.
Background:
I have been using various indicators which could generate support and resistance levels using different data points available on chart. After analyzing multiple indicators I felt there is a need of an indicator which uses Open of the day, week or month as base data and then do further calculations and generate support and resistance levels.
Logic
This indicator takes open of day, week or month candle and then compare how far was the high and low from open. It then calculate the range and add it for analysis, it does same for all the candles declared in look back period of the indicator. Once it have all the data it calculates average difference of high and low from open price. It then compare how many times that average range has been exceeded by high or low made on specific day. If high or low has exceeded the average range it then calculate how by how many point new high or low has exceeded the average range. It then use that difference to predict next level of Support and Resistance. It then check if high or low has still exceeded the support or resistance range indicator predicted using points difference it found from when price exceeded initial average range. Indicator repeat the process till 7 levels of support and resistance has been generated by indicator.
Usage
As indicator use Open price data to generate support and resistance levels therefore once it has open price of the Day, Week or Month candle it will plot the levels on charts. Open price is plotted in thin black dot line, anything above it would be considered as resistance levels. Anything below dotted line would be considered as support levels. The far the level from open less possibility it will be tested by the price. Therefore if price breaks one level it may try to test next level or can return back to Open price as well.
Along with support and resistance indicator also calculate VWAP moving average which smoothen the normal VWAP line and allow use to identify long term trend on chart. Points table display the average difference between levels price has exceeded in past.
Please do share comments, feedback or questions if you have any. If you liked the indictor please do share it with others too.
Mancini LevelsAnother level parsing indicator.
Add your list of support and resistance levels as inputs in a comma-delimited list, including ranges e.g. -, with an optional (major) to signify a major level.
Format is <(major)>"," <(major)>,<...n> for both support and resistance, with optional "major" designation after each numeric level, comma-separated

Master Pattern [LuxAlgo]The Master Pattern indicator is derived from the framework proposed by Wyckoff and automatically displays major/minor patterns and their associated expansion lines on the chart.
Liquidity levels are also included and can be used as targets/stops. Note that the Liquidity levels are plotted retrospectively as they are based on pivots.
🔶 USAGE
The Master Pattern indicator detects contraction phases in the markets (characterized by a lower high and higher low). The resulting average from the latest swing high/low is used as expansion line. Price breaking the contraction range upwards highlights a bullish master pattern, while a break downward highlights a bearish master pattern.
During the expansion phase price can tend to be stationary around the expansion level. This phase is then often followed by the price significantly deviating from the expansion line, highlighting a markup phase.
Expansion lines can also be used as support/resistance levels.
🔹 Major/Minor Patterns
The script can classify patterns as major or minor patterns.
Major patterns occur when price breaks both the upper and lower extremity of a contraction range, with their contraction area highlighted with a border, while minor patterns have only a single extremity broken.
🔶 SETTINGS
Contraction Detection Lookback: Lookback used to detect the swing points used to detect the contraction range.
Liquidity Levels: Lookback for the swing points detection used as liquidity levels. Higher values return longer term liquidity levels.
Show Major Pattern: Display major patterns.
Show Minor Pattern: Display minor patterns.

Liquidation Ranges + Volume/OI Dots [Kioseff Trading]Hello!
Introducing a multi-faceted indicator "Liquidation Ranges + Volume Dots" - this indicator replicates the volume dot tools found on various charting platforms and populates a liquidation range on crypto assets!
Features
Volume/OI dots populated according to user settings
Size of volume/OI dots corresponds to degree of abnormality
Naked level volume dots
Fixed range capabilities for volume/OI dots
Visible time range capabilities for volume/OI dots
Lower timeframe data used to discover iceberg orders (estimated using 1-minute data)
S/R lines drawn at high volume/OI areas
Liquidation ranges for crypto assets (10x - 100x)
Liquidation ranges are calculated using a popular crypto exchange's method
# of violations of liquidation ranges are recorded and presented in table
Pertinent high volume/OI price areas are recorded and presented in table
Personalized coloring for volume/OI dots
Net shorts / net long for the price range recorded
Lines shows reflecting net short & net long increases/decreases
Configurable volume/OI heatmap (displayed between liquidation ranges)
And some more (:
Liquidation Range
The liquidation range component of the indicator uses a popular crypto exchange's calculation (for liquidation ranges) to populate the chart for where 10x - 100x leverage orders are stopped out.
The image above depicts features corresponding to net shorts and net longs.
The image above shows features corresponding to liquidation zones for the underlying coin.
The image above shows the option to display volume/oi delta at the time the corresponding grid was traded at.
The image above shows an instance of using the "fixed range" feature for the script.
*The average price of the range is calculated to project liquidation zones.
*Heatmap is calculated using OI (or volume) delta.
Huge thank you to Pine Wizard @DonovanWall for his range filter code!
Price ranges are automatically detected using his calculation (:
Volume / OI Dots
Similar to other charting platforms, the volume/OI dots component of the indicator distinguishes "abnormal" changes in volume/OI; the detected price area is subsequently identified on the chart.
The detection method uses percent rank and calculates on the last bar of the chart. The "agelessness" of detection is contingent on user settings.
The image above shows volume dots in action; the size of each volume dot corresponds to the amount of volume at the price area.
Smaller dots = lower volume
Larger dots = higher volume
The image above exemplifies the highest aggression setting for volume/OI dot detection.
The table oriented top-right shows the highest volume areas (discovered on the 1-minute chart) for the calculated period.
The open interest change and corresponding price level are also shown. Results are listed in descending order but can also be listed in order of occurrence (most relevant).
Additionally, you can use the visible time range feature to detect volume dots.
The feature shows and explains how the visible range feature works. You select how many levels you want to detect and the script will detect the selected number of levels.
For instance, if I select to show 20 levels, the script will find the 20 highest volume/OI change price areas and distinguish them.
The image above shows a narrower price range.
The image above shows the same price range; however, the script is detecting the highest OI change price areas instead of volume.
* You can also set a fixed range with this feature
* Naked levels can be used
Additionally, you can select for the script to show only the highest volume/ OI change price area for each bar. When active, the script will successively identify the highest volume / OI change price area for the most recent bars.
Naked Levels
The image above shows and explains how naked levels can be detected when using the script.
And that's pretty much it!
Of course, there're a few more features you can check out when you use the script that haven't been explained here (:
Thank you again to @DonovanWall
Thank you to @Trendoscope for his binary insertion sort library (:
Thank you to @PineCoders for their time library
Thank you for checking this out!

Cloud Levels [Import Price Levels]This script allows you to import TA and price levels from an external source. For example, you may do some TA on a different software but want to import it to TradingView. Or you may have a script or bot that calculates levels for you end-of-day. Or you may be part of a community that provides TA and levels. There are many different reasons why you may want to import levels from an external source.
All you need is a source for the data. The data format shouldn't really matter since it can usually be converted fairly easily to a custom format. Information about the necessary format can be found below.
The script currently supports:
Labelled lines with customs style and colors
Boxes / zones with custom fill color and borders
Fibonacci ratios
In the plans:
Channel support
Trend lines
The input format looks like this:
FIGURE 1 - Lines with labels
Columns: ,,,,;
Example: 1677724019999,3976.50,Label text,255/255/0/125,sol
FIGURE 2 - Boxes
Columns: ,,,,,,,;
Example: 1686715971428,4430.18,1686773561538,4409.52,68/98/194/15,1,1,153/204/255/204
FIGURE 3 - Fibonacci ratios
Columns: ,,,,,,,,
Example: 1656649151300,4588.75,1656649151300,3639,dot,1,3,0.236|0.382|0.5|0.618|0.706|0.786|0.886,170/200/255/76|170/200/255/76|170/200/255/76|0/255/0/76|255/153/0/76|255/153/0/76|255/153/0/76
*ratios and ratio colors are separated by '|'
*RGBA colors must look like this: 255/255/0/125, each value separated by '/'
*Line style s must be one of these values: dsh, sol or dot (dashed, solid or dotted)
Separate each item within the same figure with a semicolon (;), e.g for two labelled lines: 1677724019999,3976.50,Label text,255/255/0/125,sol;1677724019999,4026,Label text 2,255/255/0/125,sol
Only put a semicolon at the end if there is a new item after it.
Finally, put all figures together with '§' separator between each figure/category, in the correct order:
1 - Lines with labels
2 - Boxes
3 - Fibonacci ratios
The result looks like this for the examples above:
1677724019999,3976.50,Label text,255/255/0/125,sol§1686715971428,4430.18,1686773561538,4409.52,68/98/194/15,1,1,153/204/255/204§1656649151300,4588.75,1656649151300,3639,dot,1,3,0.236|0.382|0.5|0.618|0.706|0.786|0.886,170/200/255/76|170/200/255/76|170/200/255/76|0/255/0/76|255/153/0/76|255/153/0/76|255/153/0/76
An incorrect format will give you errors.
With basic programming skills you can create a simple tool to convert your data to this format, that's what I do. If needed, I may be able to provide a customized converting tool for this, PM if interested.

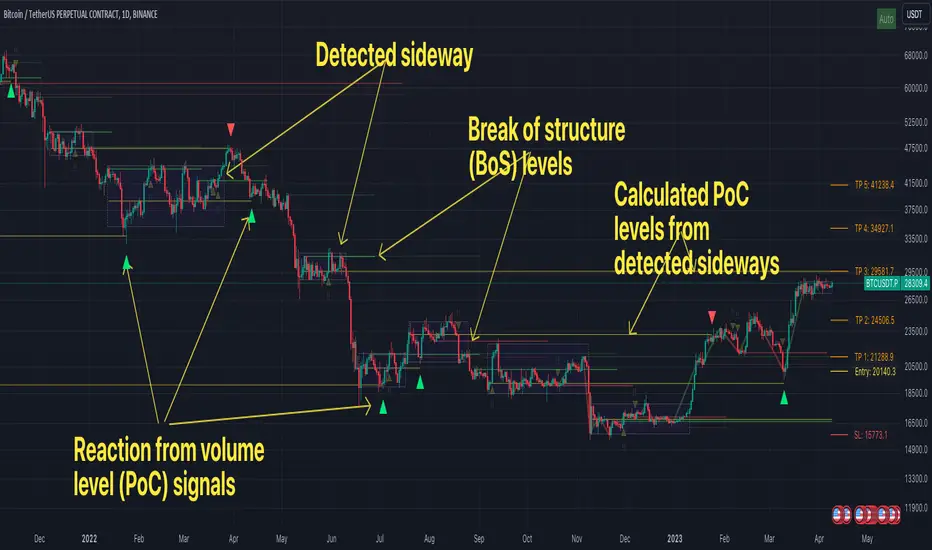
FFH Market structure v1The indicator determines the trend, its direction, confirmed trend, trend breakout levels (BoS), sideways ranges, volume profile point of control levels (vPoC) - all of this is conveniently displayed on the chart and helps complement your technical analysis.
The main idea of the script is to trade volume profile levels (vPoC) by identifying trends and sideways ranges. The script detect them and provides signals as soon as it detects a reaction from a volume level. You then complement these signals with your own technical analysis and make a decision to enter a trade. The script was developed solely to facilitate trading and address the issue of convenient visualization. Structure breakout levels are displayed as additional confirmations for making trading decisions. If we form a sideways range below/above such a trading level, it is a strong signal for me.
For sideways ranges, a volume level is calculated (vPoC), which also serves as input information for the signal engine. Signals are generated based on volume levels, with the calculation of stop loss (SL) and take profit (TP) levels. The SL is set at a certain percentage of the range boundaries or the previous high/low, as specified by a parameter. Targets are calculated intelligently based on trend reversal levels and volume levels.
The indicator parameters are individually tailored to each coin. The number of bars to determine the high/low is adjusted, as well as the allowable price deviation for defining the range boundaries on the first level. There are three modes for determining the sideways range, and data sources for highs/lows can be chosen (high/low/candle close, etc.). To make it more convenient for you to work with the indicator, there is an algorithm for automatic parameter adjustment built-in.
Currently script _only_ works for:
* BTC on 1-hour, 4-hour, and 1-day timeframes.
* ETC on 1-hour, 4-hour, and 1-day timeframes.
* Any altcoin on a 1-day timeframe.
The script will be beneficial to both novice traders, helping them understand market structure, sideways ranges, and identifying structure breakouts, as well as experienced traders, facilitating the process of plotting market structure elements on the chart and making trading decisions.
In any case, this script is not an investment idea.
All trading decisions you make based on the script are made independently and at your own risk.
Algo Targets [Premium]The Algo Targets indicator includes a suite of tools that attempt to identify market maker liquidity targets in advance.
These levels can be used by traders to determine:
1. future support/resistance
2. entries/exits
3. directional bias
4. potential reversal levels
5. pullback targets
The script uses a proprietary prediction model based on specific candle sequences, historical moves and volatility projections.
These tools have been live tested across a variety of instruments and timeframes, but should be backtested against your preferred ticker for best performance.
Primary Features:
1. Anchors
Anchors are derived from a simple, but powerful, three-candle breakout pattern. We have found that this pattern, when combined with the relative position to previous Anchor patterns on the chart, gives us clues to predicting future price structure.
Common use case: The simplest way to trade Anchors is to know that price *almost always* makes a return visit. This can be a useful tool for reversal traders. Additionally, Anchors often occur just before strong directional momentum. This can be useful for trend traders looking for entry signals.
Power User feature: Projected Ranges can be enabled in Settings. Each Anchor provides a Retracement leg (measured as the midpoint between the last two Anchors) and an Expansion leg (measured as twice the size of the Retracement leg, projected in the opposite direction). If Projected Ranges are enabled, the directional bias is also highlighted within the range, making it easy to spot at a glance.
Caveats: Expansion legs require patience and solid risk management. Additionally, the Expansion leg contains an additional Trigger level which price MUST cross before we consider the Expansion leg to be "in play" as a valid price target. This Trigger is marked on each Expansion legs as a dotted line.
Please note, Anchors require a 3 candle lookback before they are printed to the chart.
2. Target Zones
Target Zones are an advanced feature, and can be enabled in the Settings panel.
Each Target Zone consists of three levels:
Trigger — This the level closest to the current price. We expect it to act as a support/resistance level until price breaks through.
Target — This is the level farthest from the price. This is how far price is likely to move AFTER crossing the Trigger.
Midpoint — This is the level between the Trigger and Target. If price enters a Target Zone and wicks off of the Midpoint line, it’s usually a reversal signal. In this case we would cut our trade, consider the Target “filled” and potentially enter a reversal trade.
Common use case: When prices crosses a Trigger into a Target Zone, we consider that Target level to be “unlocked.” Our expectation is that price will gravitate toward the Target.
Power User feature: There are many strategies that a trader can build around Target Zones. One of our favorites is to use Targets strictly as reversal entries. On ranging days, price will often wick off of a Target level, before making a quick move in the opposite direction.
Caveats: After a Target is unlocked, it may be reached within the next few bars, or it may be saved by the market algorithms for later. Keep an eye on the Midpoint for potential reversals, and as always, proper risk management is key.
IMPORTANT: The presence of a Target Zone on the chart is neither bullish not bearish by itself. We consider the Target to be in play if, AND ONLY IF, price has crossed the Trigger level.
3. Pullback Levels
Pullback Levels are algorithmically detected return levels. They usually act as a strong draw on price, and often appear just before a pullback in price.
Common use case: The simplest way to use Pullbacks is to look for ones that have not been filled, either from a previous day or in after-hours/pre-market. We use them for confirmation bias along with Anchors and unlocked Targets.
Power User feature: For day trading, we set Alerts on our favorite tickers for any detected Pullbacks on the 5 min chart. This usually gives us plenty of time to review the chart for a possible day trade entry.
Settings:
All features are customizable, including color, line length and visibility. This lets you keep your chart as clean as you like, while only displaying additional data when it is needed.
Alerts:
Alerts can be set for all features, with the ability to set bearish and bullish alerts separately, depending on your trading preference. It is recommended to use "Once Per Bar Close" when you create an alert.

Simple Grid Lines VisualizerAbout Grid Bots
A grid bot is a type of trading bot or algorithm that is designed to automatically execute trades within a predefined price range or grid. It is commonly used in markets that exhibit ranging or sideways movement, where prices tend to fluctuate within a specific range without a clear trend.
The grid bot strategy involves placing a series of buy and sell orders at regular intervals within the predefined price range or grid. The bot essentially creates a grid of orders, hence the name. When the price reaches one of these levels, the bot will execute the corresponding trade. For example, if the price reaches a predefined lower level, the bot will buy, and if it reaches a predefined upper level, it will sell.
The purpose of the grid bot strategy is to take advantage of the price oscillations within the range. As the price moves up and down, the bot aims to generate profits by buying at the lower end of the range and selling at the higher end. By repeatedly buying and selling at these predetermined levels, the bot attempts to capture gains from the price fluctuations.
About this Script
Simple Grid Lines Visualizer is designed to assist traders in visualizing and implementing automated price grids on their charts. With just a few inputs, this script generates gridlines based on your specified top price, bottom price, and the number of grids or profit per grid.
How it Works:
Specify Top and Bottom Prices: Start by setting the top and bottom prices that define the range within which the gridlines will be generated. These prices can be based on support and resistance levels, historical data, or any other factors you consider relevant to your analysis.
Determine Grid Parameters: Choose either the number of grids or profit per grid, depending on your preference and trading strategy. If you select the number of grids, the script will evenly distribute the gridlines within the specified price range. Alternatively, if you opt for profit per grid, the script will calculate the price increment required to achieve your desired profit level per grid.
Note that when choosing Profit per Grid , an approximation usually is performed, as all grid lines must be evenly distributed. To achieve that, the script computes the grid distance using the mean price between top and bottom, then computes how many of those complete distances may enter the entire range, and lastly, creates a grid with evenly distributed distances as close as possible to the previously computed.
Customize Styling and Display: Adjust the line color, line style, transparency, and other visual aspects to ensure clear visibility on your charts.
Analyze and Trade: Once the gridlines are plotted on your chart, carefully observe how the market interacts with them. The gridlines can act as reference points for potential support and resistance levels, as well as simple buy/sell orders for a trading bot.
Try to find gridlines that intersect prices as frequently as possible from one to another.
A grid with too many lines will make lots of potential trades, but the amount traded will be minimal (as the total amount invested is divided over the number of grids).
A grid with too few lines will make lots of profits with each trade, but the trades will be less likely to occur (depending on the top/bottom distance).
This tool aims to help visually which grid parameters seem to optimize this problem.
Future versions may include automatic profit computation.

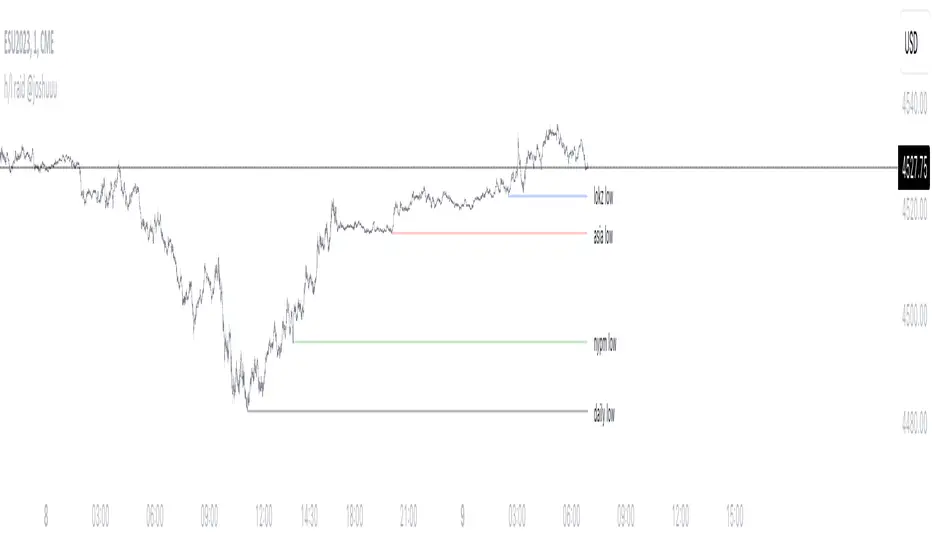
h/l raid @joshuuuThis indicator shows, when important liquidity pools have been taken out.
Which liquidity pools are important and how should I use them?
The day can be divided into different session. asia, london and new york session, those sessions can be narrowed down even further into killzones, taught by ict.
The times for those killzones are:
Asia - 2000-0000 ny time
London - 0200-0500 ny time
ny am - 0830-1100 ny time
nypm - 13.30-1600 ny time
Highs/Lows that have been created within those killzones (sessions with highest volume) should hold some liquidity.
That's why this indicator displays arrows with different colors to highlight once those highs/lows get taken out.
Additionally, the indicator also shows raids (liquidity grabs) of the previous daily, previous weekly and previous monthly high/low.
All colors are adaptable.
How do I use that indicator for my trading.
Once those important liquidity pools are taken out, we often see a reversal in the marketplace. One can wait for a raid and then watch for a potential market structure shift into the opposite direction to anticipate a reversal.
Note:
It is possible to create alerts for those kind of raids.
Examples:
ES:
Price takes out Asia High (red triangle) and London High (blue triangle). Price then forms a market structure shift (lower low after a series of higher lows) and creates a fair value gap while doing so.
That would be a valid setup. Again, all these are concepts by TheInnerCircleTrader.
EU:
On this EurUsd Chart, we can see, how the triangles (liquidity grabs) can be an early indication for potential reversals.
Asia high and london high has been taken out. market structure shift (light bulb) and then a fairvalue gap.
*ATR Levels*This script is an enhanced version of "Saty's ATR Levels". With the help of SimpleCryptoLife, he reimagined the script to include these differences:
-view the ATR levels easily with labels and know where the price action is in relation to a specific level
-the included "price follow line" extends across the screen and through the ATR levels label to allow you to easily identify which level you're in or about to enter either on an upswing or downswing
- a +/- 4 and 5 ATR level created that can be turned on for those crazy runners, occasionally a stock will run >5 ATR if you're lucky
Select levels are standard when firing up the indicator but you can click on the appropriate levels to suit your needs and save it from there.
There are several modes to choose from >> Day, Multiday, Swing, Position and Long-Term - Try them out and see what works best for your trading style. For instance:
-Day mode is great for, you guessed it, day trades whether long or shot and ideally paired with 1h or less timeframes
-Multiday is similar to Swing mode and is great for trades less than a week and generally paired with 30m to 1 day timeframe
-Swing mode is great for 1-3 week trades and can be used on higher timeframe such as 30m to 1 day
-Position & long term are of course for longer term trades and ideally paired with 4 hour to 1 month timeframes
ATR length of 14 is standard (look up "Wilder's 14")
Trend indicator based off of the 9-21-34 EMAs // - Range against ATR for each period // - Put and call trigger levels table was created by Saty, located in upper right
Generally, once a candle hits the 23.6% level, look to "go long" but be sure to wait for confluences that support your strategy. Maybe you can wait till the 38.2 level or even higher, dependent on your risk tolerance (stop loss recommended). A candle could come back and retest a certain level that you're eyeing and then continue upwards. As each level is hit, the greater the chance to hit 1 ATR (or higher!). You can start to scale out of a trade at any level but any of the main ATR levels like +1, +2 and so on would be ideal places to take some profit. Keep in mind that a stock can make a run in the pre-market and once the opening bell hits the stock might already be above the +1 ATR level or higher. Conversely the aforementioned is true for stocks to short. The -23.6% level would a "trigger" level but you can use -38.2 etc
Regarding the "use current close" check box: if you're in after or pre-market hours, the ATR levels will remain from the previous day so you'll want to check this box to see what the new levels will be for the current day. But you'll want to uncheck it and leave it unchecked throughout the trading day.
If you find this indicator invaluable and it helps you become a more consistent and profitable trader, feel free to give it a boost and leave a comment if you so desire. As always, trade at your own risk and never use more money than you afford to lose.

Fibonacci Levels on Any Indicator [By MUQWISHI]▋ INTRODUCTION :
A “Fibonacci Levels on Any Indicator” can be applied to any indicator to draw Fibonacci levels based on provided conditions of two price points to produce a sequence of horizontal line levels starting from 0% to 100% in addition to extension levels. The 0% level is measured as the start of retracement, while the 100% level is the beginning of the extension levels. This tool was developed to be easy to add to any indicator, and it could be valuable to some traders in terms of managing trades by setting targets and reducing risk in the trend direction.
_______________________
▋ USAGE:
➤ NEEDS TO IDENTIFY 4 ELEMENTS:
1. Starting Point. What’re the conditions / When will the drawing of the Fibonacci levels begin?
2. Ending Point. What’re the conditions / When will the drawing of the Fibonacci levels end?
3. High Point. What is the price for a 100% Fibonacci level (0% for the downside)?
4. Low Point. What is the price for a 0% Fibonacci level (100% for the downside)?
➤ STARTING & ENDING POINTS CONDITIONS:
Need to specify the condition when the drawing of Fibonacci levels starts and ends, and the indicator shows different prepared conditions.
New Phase: Import a value (plot) from an existing indicator, where its status changes from NaN to a real number.
Crosses Above/Below: Import a value(1) (plot) from an existing indicator, where it crosses above/below value(2).
Reversal Up/Down: Import a value(1) (plot) from an existing indicator, where it rises/decreases than the previous value(1).
First/Last Bar: Useful to draw stationary Fibonacci levels.
➤ UPPER & LOWER PIVOTS (0% & 100%):
Need to specify the two price points representing 0% & 100% Fibonacci levels to expose the sequence of Fibonacci lines.
Upper Pivot. By default, the ATR Upper Band. It’s possible to import a custom value from an existing indicator.
Lower Pivot. By default, the ATR Lower Band. It’s possible to import a custom value from an existing indicator.
➤ FIBONACCI STYLING OPTIONS:
Ability to customize line & label style, color, reverse, and hide/show levels.
_______________________
▋ IMPLEMENTATION:
Here are some examples of implementing the indicator.
Note: All presented examples below are for demonstration purposes, and they're not trading suggestions.
# Example 1: (Reversal Up/Down)
We want to implement Fibonacci levels on the Hull MA by mohamed982 . Our requirements are as follows:
Fibonacci levels start when the Hull MA reverses up.
Fibonacci levels end when the Hull MA reverses down.
Upper Pivot is the ATR Upper Band.
Lower Pivot is the ATR Lower Band.
After adding the required indicator (Hull MA), here’re the implementation and results
# Example 2: (Crosses Above/Below)
We want to implement Fibonacci Level on the Squeeze Momentum by LazyBear . Our requirements are as follows:
Fibonacci levels start when the Squeeze Momentum histogram crosses above 0.
Fibonacci levels end when the Squeeze Momentum histogram crosses below 0.
Upper Pivot is the Bollinger Upper Band.
Lower Pivot is the Bollinger Lower Band.
After adding the required indicators (Squeeze Momentum & Bollinger Band), here’re the implementation and results
# Example 3: (Crosses Above/Below)
We want to implement Fibonacci Level on the Crossing Moving Averages. Our requirements are as follows:
Fibonacci levels start when the 20-EMA crosses above 100-MA.
Fibonacci levels end when the 20-EMA crosses below 100-MA.
Upper Pivot is the ATR Upper Band.
Lower Pivot is the ATR Lower Band.
After adding the required indicators (20-EMA & 100-MA), here’re the implementation and results
# Example 4: (New Phase: When the previous value is NaN, and the current value is a real number.)
We want to implement Fibonacci Level on the Supertrend. Our requirements are as follows:
Fibonacci levels start when an up-Supertrend (green) line shows up.
Fibonacci levels end when a down-Supertrend (red) line shows up.
Upper Pivot is the down-Supertrend.
Lower Pivot is the up-Supertrend.
After adding the required indicator (Supertrend), here’re the implementation and results
# Example 5: (First/Last Bar)
We want to implement Fibonacci Level between two points, 330 & 300. Our requirements are as follows:
Fibonacci levels start at first bar on the chart.
Fibonacci levels end at last bar on the chart.
Upper Pivot is 330.
Lower Pivot is 300.
Here’re the implementation and results.
To customize the number of bars back (like 50 bars)
_______________________
▋ Final Comments:
The “Fibonacci Levels on Any Indicator” is made to apply on other indicators for planning Fibonacci Levels.
It can be implemented in different ways, along with presented examples.
This indicator does not work with plots that were developed by drawing classes.
Please let me know if you have any questions.
Thank you.

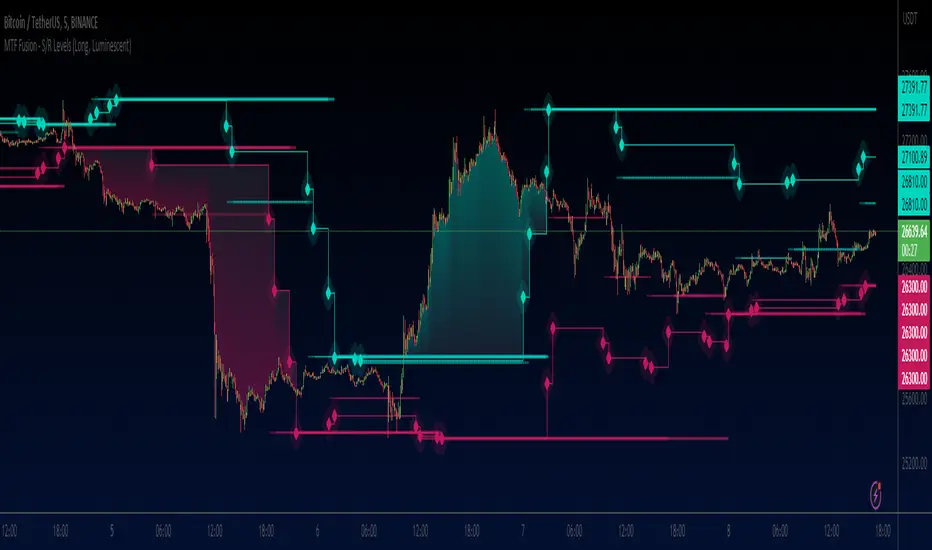
MTF Fusion - S/R Levels [TradingIndicators]MTF Fusion S/R Levels intelligently adapt to whatever timeframe you're trading - dynamically calculating pivot-based support and resistance levels combined from four appropriate higher timeframes to give you a much broader view of the market and an edge in your trading decisions. It is the second indicator in our MTF Fusion series, and leverages our MTF Fusion algorithm - only this time to visualize pivot-based S/R levels and zones.
These levels are not programmed to repaint - so you can use them in real-time just as they appeared historically.
What is MTF Fusion?
Multi-Timeframe (MTF) Fusion is the process of combining calculations from multiple timeframes higher than the chart's into one 'fused' value or indicator. It is based on the idea that integrating data from higher timeframes can help us to better identify short-term trading opportunities within the context of long-term market trends.
How does it work?
Let's use the context of this indicator, which calculates S/R Levels based on pivot points, as an example to explain how MTF Fusion works and how you can perform it yourself.
Step 1: Selecting Higher Timeframes
The first step is to determine the appropriate higher timeframes to use for the fusion calculation. These timeframes should typically be chosen based on their ability to provide meaningful price levels and action which actively affect the price action of the smaller timeframe you're focused on. For example, if you are trading the 5 minute chart, you might select the 15 minute, 30 minute, and hourly timeframe as the higher timeframes you want to fuse in order to give you a more holistic view of the trends and action affecting you on the 5 minute. In this indicator, four higher timeframes are automatically selected depending on the timeframe of the chart it is applied to.
Step 2: Gathering Data and Calculations
Once the higher timeframes are identified, the next step is to calculate the data from these higher timeframes that will be used to calculate your fused values. In this indicator, for example, the values of support and resistance levels are calculated by determining pivot points for all four higher timeframes.
Step 3: Fusing the Values From Higher Timeframes
The next step is to actually combine the values from these higher timeframes to obtain your 'fused' indicator values. The simplest approach to this is to simply average them. If you have calculated the value of a support level from three higher timeframes, you can, for example, calculate your 'multi-timeframe fused level' as (HigherTF_Support_Level_1 + HigherTF_Support_Level_2 + HigherTF_Support_Level_3) / 3.0.
Step 4: Visualization and Interpretation
Once the calculations are complete, the resulting fused indicator values are plotted on the chart. These values reflect the fusion of data from the multiple higher timeframes, giving a broader perspective on the market's behavior and potentially valuable insights without the need to manually consider values from each higher timeframe yourself.
What makes this script unique? Why is it closed source?
While the process described above is fairly unique and sounds simple, the truly important key lies in determining which higher timeframes to fuse together, and how to weight their values when calculating the fused end result in such a way that best leverages their relationship for useful TA.
This MTF Fusion indicator employs a smart, adaptive algorithm which automatically selects appropriate higher timeframes to use in fusion calculations depending on the timeframe of the chart it is applied to. It also uses a dynamic algorithm to adjust and weight the lookbacks used for pivot and S/R level calculations depending on each higher timeframe's relationship to the chart timeframe. These algorithms are based on extensive testing and are the reason behind this script's closed source status.
Included Features
Fusion Support and Resistance Levels
Dynamic Multi-Timeframe S/R Levels
Breakaway Zone fills to highlight breakouts and breakdowns from the Fusion S/R Levels
Customizable lookback approach
Pre-built color stylings
Options
Fusion View: Show/hide the Fusion S/R Levels calculated from multiple higher timeframes
MTF View: Show/hide the S?R levels from multiple higher timeframes used to calculate the Fusion S/R Levels
Breakaway Zones: Show/hide the fill for zones where price breaks away from the Fusion S/R Levels
Lookback: Select how you want your S/R Levels to be calculated (longer = long-term levels, shorter = short-term levels)
Pre-Built Color Styles: Use a pre-built color styling (uncheck to use your own colors)
Manual Color Styles: When pre-built color styles are disabled, use these color inputs to define your own
Key Levels (Open, Premarket, & Yesterday)OVERVIEW
This indicator automatically identifies and draws recent high-probability support and resistance levels (recent key levels). Specifically, yesterdays highs / lows, premarket highs / lows, as well as yesterdays end of day Volume Weighted Average Price and trader specified Moving Average.
This is most useful on charts with intraday time frames (1 minute, 5 minute etc.) commonly used for day trading. This is not ideal for larger time frames (greater than 1 hour) commonly used for swing trading or identifying larger trends.
INPUTS
You can configure:
Line size, style, and colors
Label colors
Which key levels you want to see
Moving Average Parameters
Market Hours and Time Zone
DEV NOTES
This script illustrates:
A method for iterative management of more complex data objects (not just discrete values) with loops and arrays.

EMAflowPRO -Ranges-DISCLAIMER: Always, please keep in mind that market conditions change, past results cannot guarantee the same results in the future.
EMAflowPRO - Ranges-
EMAflowPRO ranges indicator will detect key movements in the market that fit certain conditions and based on that create key tradable zones by providing dynamic and static range levels.
Before reading further please take a look at the indicator values names on the right in the main chart above - these names are linked to the content below when we talk about range structure. The examples included in charts are linked to the area we're discussing (if something was said - most likely closest chart demonstrates it - Also arrows present entries; can be limit or can be market buy/sell in to the wicks.)
Let's find out what indicator does...
Static range logic:
Indicator uses combination of market timing indicators (counting relationship between candles) , fisher transform, stoch rsi, bollinger bands to detect important market price action that show strenght - based on that it will project a static range where key goal is to predict where market will be extremely oversold, extremely overbought or where market could change bias etc.
The setups it provides are very similar to those that come out of harmonic patterns - but it was developed with unique approach without knowing what harmonic patterns are.. so it's not completly the same.
Range is represented by 3 tradable areas (actual trade ideas on charts - arrow points towards a level - on the right there is a scale with a number- limit order can be placed there )
Top of the range - It serves as a shorting area or if top is converted to support can also signal a potential breakout or start of new trend.
Example of a short the top of the range:
29732 - is area where wicks can be sold in to , or limit sell is placed - with higher leverage sl should be tight, with lower sell orders can be spread out up to the middle with sl just above 30500, targets can be choosen based on the provious range top as % moves point.
Example of longing the levels on the recent rise - price staying above middle of the top of the range keeps bias on the upside and potentially signals a break out or start of new trend
Uppper, Middle, Lower part of the range: Sideway area - middle of the range decides direction , above favors the upper levels , below favors the lower levels.
Very nice example where white line is middle of the range and shows that even in strong trend - range projection is able to accurately predict key pullback areas that provide substantial gain. See image below - again settign limit orders where middle of the range is allows you to get a comfortable entry with very big risk reward ratio.
Bottom of the range - market is extremely oversold
Spx example of our recent range from last year's summer - again chart includes both EMAflow indicator and EMAflow ranges as all indicators are extremely complementary and present two sides of the medal sideway and trend view.
Chart only contains ranges but shows the same pair and time:
If price goes below middle of the bottom of the range it could signal a break down or start of new bearish trend.
Dynamic range logic
Since sometimes static range gets broken out or is not respected and the price action is not yet sufficient to generated a new one we included a dynamic supply demand part where dynamic range is generated working in a similar way but does add clarity when static range fails.
example of this can be seen when ftx caused a btc dump we broke through the bottom of the range but dynamic range later showed us new bottom we could trade.
Confluence between both can also provide even more sure levels to place limit orders or to market buy or sell when wicks in to that area occurs.
Minuses:
Since ranges tend to work best when market is sideway - a second part is recommended with EMAflowPRO where focus on moving averages helps you navigate stronger trends.
Not all tfs are well synced with ranges on various assets so you will need to flip through few ones to find the best timeframes that historically worked the best - if you come across an asset that doens't look good you should just change timeframe to higher until you see something that fits or change asset until you get something that looks clear.
Settings:
EMAflow - Ranges - allows you to preset minimum potential of a trade setup you want to look for - default is 6% that ensures you can get a good setup on lower and higher tfs.

Turtle Soup IndicatorTurtle Soup Indicator plots a shape when we have a 20-period high or 20-period low.
Turtle Soup Setup
The Turtle Soup setup was published in the book Street Smarts by Laurence A Connors and Linda Raschke. You can learn about it there. It is a great setup for false breakouts or breakdowns in the group failure tests.
Going long
1) We have a new 20-period low
2) that must have occured at least four trading sessions earlier <- this is very important
Then we place a buy stop above 5-10 ticks or 5 to 10 cents above the previous 20-period low.
If filled immediately place a good til cancelled sell stop one tick or one cent below todays low.
Turtle Soup Plus One
Similar to above but occurs one day later. It should close at/below previous 20-period low.
Buy stop at earlier 20 day low. Cancel fi not filled on day 2.
Take partials within 2-6 bars on this one and trail stop rest of position.
Going short
Reverse
Time frames
Works on all timeframes. Only adjust stoplosses accordingly to chosen timeframe.
Settings
You can change the color, shape and placement of the indicator shape. I actually prefer a grey color for both highs and lows as the color actually doesn't add much information. The placement says it all but it is up to you to change this as you like.

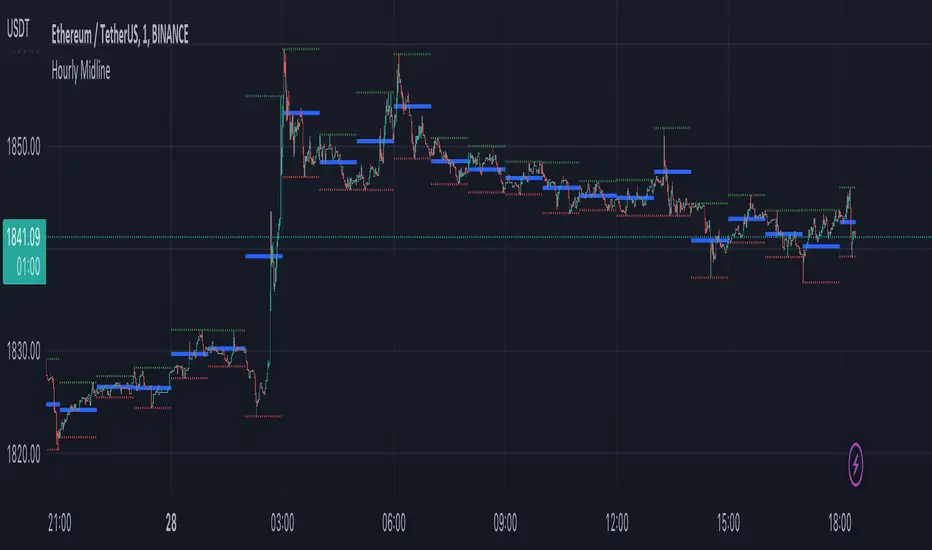
Hourly MidlineDescription:
The indicator displays horizontal line in the middle of each hourly candle. You can change the source for calculating the middle level (either middle between High and Low of hourly candle, or middle between Open and Close). It is intended for use on minutely timeframes.
Parameters:
- Source -> source for calculating the middle level
- Line width -> width of the middle lines
- Line color -> color of the middle lines
- Show 1H candle levels -> display the levels used to calculate middle level
Dual Dynamic Fibonacci Retracement — Long and Short Duration
Title : "The Dual-Dynamic Fibonacci Retracement Script: An Advanced Tool for Comprehensive Market Analysis"
As the author of the "Dual-Dynamic Fibonacci Retracement Script", I am delighted to introduce you to this cutting-edge tool for technical analysis. Unlike conventional Fibonacci scripts, this advanced model incorporates multiple unique features and adjustments that make it a powerful asset for any market analyst. Whether you're dealing with forex, commodities, equities or any other market, this script is versatile enough to enhance your trading strategy.
Uniqueness & Differentiation:
The "Dual-Dynamic Fibonacci Script" stands out by offering two distinct lookback periods. This feature is what separates it from other scripts available in the market. The first lookback period is longer, focusing on capturing broader market trends. The second lookback period is shorter, allowing for a more granular analysis of near-term market fluctuations. This dual perspective provides a more comprehensive view of the market, allowing you to see both the forest and the trees at the same time.
Fibonacci Levels:
While offering the standard Fibonacci retracement levels (0.236, 0.382, 0.5, 0.618, 0.786, and 1.0), the script also gives you the ability to plot 0.114 and 0.886 levels. These additional levels offer an extra layer of depth to your analysis, and can prove crucial in high-volatility markets where they often serve as significant support and resistance points.
Customizable Line Shifts and Extends:
This script provides options for customization of the shift and extension of the plotted lines. This means you can adjust the start and end points of the Fibonacci lines according to your personal trading style and strategy. This level of personalization is not typically available in other scripts, and it allows for a more tailored visual representation.
Flexible Trading Positioning:
Depending on whether the closing price is above or below the midpoint of the pivot high and pivot low, the Fibonacci retracement levels are adjusted accordingly. This ensures the script remains relevant and useful regardless of market conditions.
Clean Visualization:
To prevent clutter and maintain focus on the most relevant price action, the script removes old Fibonacci lines and plots new ones once a new pivot high or low is identified. This clean visualization helps keep your analysis focused and sharp.
How to Use the Script:
To get started, simply adjust the lookback periods according to your trading strategy. If you're a long-term investor or prefer swing trading, a longer lookback period might be appropriate. Conversely, if you're a day trader, a shorter lookback period might be more beneficial.
The "Shift" and "Extend" inputs allow you to control the positioning of the Fibonacci lines on your chart. Positive values shift the lines to the right, while negative values shift them to the left.
You also have the choice to plot the additional Fibonacci levels (0.114 and 0.886) via the "Plot 0.114 and 0.886 levels?" input. Similarly, the "Plot second set of levels?" input lets you decide whether to display the second set of Fibonacci levels derived from the shorter lookback period.
Like any technical analysis tool, this script is most effective when used in conjunction with other indicators and methods of analysis. It is designed to work well in trending markets, where Fibonacci retracements can often indicate potential reversal levels. However, it's always recommended to use a holistic approach to market analysis to maximize the likelihood of successful trades.
Note: the two lines drawn on the chart are there to help the user identify the levels from which the two respective Fib sequences are calculated.
~~~
Input Explanations:
Long Period Pivot High/Low Lookback and Short Period Pivot High/Low Lookback : These settings determine the length of the lookback periods for the long-term and short-term pivot points, respectively. A pivot point is a technical analysis indicator used to determine the overall trend of the market over different time frames. The pivot points are then used to calculate the Fibonacci levels. A longer lookback period will identify pivot points over a broader time frame, capturing major market trends, while a shorter lookback period will identify pivot points over a narrower time frame, capturing more immediate market movements.
Long Period Fibonacci Level Shift and Short Period Fibonacci Level Shift : These inputs control the shift of the Fibonacci levels based on the long and short lookback periods, respectively. If you want to shift the Fibonacci levels to the right, increase the value. If you want to shift the Fibonacci levels to the left, decrease the value. This allows you to adjust the Fibonacci levels to better align with your analysis.
Long Period Fibonacci Level Extend and Short Period Fibonacci Level Extend : These inputs control the extension of the Fibonacci levels based on the long and short lookback periods, respectively. If you want the Fibonacci levels to extend further to the right, increase the value. If you want the Fibonacci levels to extend less to the right, decrease the value. This feature provides the flexibility to adjust the length of the Fibonacci levels according to your personal trading preferences and strategy.
Plot 0.114 and 0.886 levels? : This setting gives you the ability to plot the additional 0.114 and 0.886 Fibonacci levels. These levels provide extra depth to your analysis, particularly in highly volatile markets where they can act as significant support and resistance levels.
Plot second set of levels? : This input allows you to decide whether to plot the second set of Fibonacci levels based on the short lookback period. Displaying this second set of levels can provide a more granular view of market movements and potential reversal points, enhancing your overall analysis.

Psychological levels (Bank levels) PsychoLevels v3 - TartigradiaPsychological levels (Bank levels) plots the closest "round" price levels above and below current price, based on neuroscience research of how humans intuitively calculate in logarithms.
Psychological levels, also called bank levels, are "round" price numbers, by truncating after the nth leftmost digits, around which price often experience resistance or support, because traders and investors tend to set orders around these round numbers.
The calculation done here is fully automatic and dynamic, contrary to other similar scripts, this one uses a mathematical calculation that extracts the 1, 2 or 3 leftmost digits and calculate the previous and next level by incrementing/decrementing these digits. This means it works for any symbol under any price range.
This approach is based on neuroscience research, which found that human brains intuitively approximate numbers on a logarithmic scale, adults and children alike, and similarly to macaques, for more info see Numerical Cognition , Weber-Fechner Law , Zipf law .
For example, if price is at 0.0421, the next major price level is 0.05 and medium one is 0.043. For another asset currently priced at 19354, the next and previous major price levels are 20000 and 10000 respectively, and the next/previous medium levels are 20000 and 19000, and the next/previous weak levels are 19400 and 19300.
IMPORTANT: Please enable "Scale price chart only" in the chart's scale's options, as otherwise major levels may make the chart's scale very small and hard to read.
How it works
At any time, there are 3 levels of strength (1 leftmost digit, 2 leftmost digits, 3 leftmost digits) represented by different sizes, and 3 directional levels for each of these strengths (level above, level below, and half-level) represented by different colors and positions, around current price.
Indeed, contrary to other similar price levels scripts, we do not plot ALL price levels at all times, because otherwise the chart becomes wayyy too cluttered, and also it's highly processing intensive to plot so many lines. So we here use a dynamical approach: we plot only the relevant levels, the closest ones according to current price.
Hence, when a level disappears, it does not mean that it does not exist anymore, but simply that we are not drawing it right now because it is not pertinent for the current price movement (ie, too far away).
Breakouts can be detected in two different ways depending on if SMA is set to a value higher than 1 or not: if SMA == 1, then there is no smoothing, so the levels adapt instantaneously to the current price, so to detect breakout, you should refer to the levels at the previous tick and whether they were broken by current tick's price; if SMA > 1, then there is some smoothing, and so the levels will stay in-place even if there is a breakout, so it's easier to spot breakouts without having to look at the previous ticks, but on the other hand you won't see the new levels for the new price range until after a few more ticks for the smoothing window to adapt. Hence, by default, smoothing is disabled, so that you can see the currently pertinent levels at all time, even right after or during a breakout.
By default, the strong above level is in green, strong below level is in red, medium above level is in blue, medium below level is in yellow, and weak levels aren't displayed but can be. Half levels are also displayed, in a darker color. Strong levels are increments of the first leftmost digit (eg, 10000 to 20000), medium levels are increments of the second leftmost digit (eg, 19000 to 20000), and weak levels of the third leftmost digit (eg, 19100 to 19200). Instead of plotting all the psychological levels all at once as a grid, which makes the chart unintelligible, here the levels adapt dynamically around the current price, so that they show the above/below/half levels relatively to the current price.
Indeed, "half-levels" are also displayed (eg, medium level can also display 19500 instead of only 19000 or 20000). This was made because otherwise the gap between two levels was too big, especially for the strongest levels (eg, there was no major level between 20000 and 30000, but with a half-step we also get a half-level at 25000, and empirically price tends to respect these half levels - I also tried quarter levels but empirically the results were not good). In addition to this hard-coded half-level, you can also create more subdivisions (eg, quarter levels) by setting the simple moving average to a value higher than 1.
The script can be made to run on the daily timeframe whatever the current chart's timeframe is, to reduce the variability in levels, to make it less noisy than intraday price movement. But by default, the chart resolution is used, because I empirically found that the levels found with this indicator work on all time resolutions quite well.
The step can be adjusted to increase the gap between levels, eg, if you want to display one every 2 levels then input step = 2 (eg, 22000, 24000, 26000, etc), or if you want to display quarter levels, input 0.25 (eg, 22000, 22250, 22500, etc). The default values should fit most use cases and cover most psychological levels.
How to read
Focust first on bigger dotted levels, they are stronger and more likely to cause a rebound or a major event or price to stay at this level.
Remember that it's not enough to just look at levels, the context is important, because levels have various effects depending on current price movement: if price is above a level, the level is a support on which price can rebound; if price is below a level, the level is a resistance on which price can rebound (or break); and finally sometimes price also stays hovering around a level for some time.
Levels closer to 9 are less weaker, and levels closer to 0 are stronger, according to Zipf law. This is now reflected since v3 in the transparency, levels that are closer to 9 will be more transparent.
The switch in color for the same level illustrates how a level switches from being a support to a resistance and inversely. Eg, if a major level turns from green to red, then it changed from being a resistance (above) to a support (below).
As is well known in trading, longer standing levels are stronger. This indicator provides a direct illustration: in practice, the number of consecutive dots on the same line influences the strength of the level: the longer the chain of dots, the more you can expect this price level to be significant. The length does not mean the level will necessarily hold, but that other traders are likely to monitor if it holds, and if not then price will break down. Hence, longer levels are good spots to place stop losses, or to enter trades depending on your strategy. In general, a single dot is not enough to consider a level significant, but 2 or more is a good enough level, and 10+ is a strong level. Intuitively, this makes sense, and is what pro traders do: the longer a level is tested, the stronger it is. This indicator can visually represent this intuition and allows to use it as a more systematic trading signal.
Motivation
I initially made the first version of the PsychoLevels indicator mainly to train with PineScript, but I found it surprisingly accurate to define levels that are respected by price movements. So I guess it can be useful for new traders and experienced traders alike, as it's easy to forget that psychological levels can often be as strong if not stronger than technical levels. It can also be used to quickly screen other minor assets for trading opportunities. For example, a hybrid strategy would be to manually define levels on BTCUSD but using this script to automatically define levels in crypto altcoins and quickly screen them for a trade opportunity that can be greater than with BTCUSD but with the same trend.
Personally, although initially I did not believe an automated tool would work well for this purpose, I could now empirically verify that it is quite reliable for the purpose of detecting levels, and so I use it all the time to find the levels automatically and help me monitor them like a hawk, so that I only have to draw uber major levels, the ones that last between cycles and that are hard to autodetect, but otherwise all daily/weekly levels are usually covered. However, trendlines must still be drawn manually or with another indicator (but note that up to now I have found none that worked well enough), as PsychoLevels only draws levels (ie, horizontal lines, not oblique ones!).
Differences with the previous version PsychoLevels v2
price levels now have a transparency according to their importance for the human brain: numbers closer to 9 are weaker, and numbers closer to 0 are stronger and represent a major psychological threshold (eg, that's why prices marked as $9.99 sell better than $10.00). This option can be disabled to get the exact same behavior as v2.
modularized and typed code
PsychoLevels v2 can be found here:

Auction Theory Price LevelsKnowing the levels where price might find support or resistance is critical in trading. These are the levels where buyer or sellers previously showed up.
A bull trend is recognized by higher highs and higher lows on a daily or weekly chart whereas a bear trend is recognized by lower highs and lower lows. Knowing where these daily and weekly levels are will help to expect when and where a bounce or rejection might occur. Alternatively a break of these levels might hint at a change in trend. As they say, never get bullish at the top or bearish at the bottom until the level is broken and held.
This indicator adds these critical levels to the chart and let you hide the ones that are not important to your style of trading (all times are in US Eastern)
- pre-market (4am to 9:30am): low, high, mid
- previous day; low, high, close
- previous week: low, high
- current week: high, low
- initial balance (9:30am to 10:30am): low, high
- current session: open, low, high, mid
If you like the indicator, please like and share!
Thank you!

NSDT Custom High and Low LinesFirst, the credit for the original script to plot a High and Low between a certain time goes to developer paaax.
I took that idea, converted it to Pinescript V5, cleaned up the code, and added a few more lines so you can plot different levels based on time of day.
Published open source like the original.
The example shown has:
Blue - plotting from the start of the Futures Asian session to the start of the Futures USA Session. (6:00PM - 9:30AM Eastern)
Yellow - plotting from the start of the Futures Europe session to the start of the Futures USA Session. (3:00AM - 9:30AM Eastern)
Green - plotting from the start of the Futures US Premarket session to the start of the Futures USA Session. (8:00AM - 9:30AM Eastern)
These are great levels to use for breakouts and/or support and resistance.
Combine these levels with the 5 min Open Range levels, as you have some good trades.
Each of the three sessions have individual start and end times that can be modified by the trader, so you can easily mark off important areas for your style of trading.
