[RS]ZigZag Percent Reversal(Multiple) - Forecast Areasnaive level forecasting of multiple zigzag's
based on this principle:
Levels
2R overlay positive biasHere is a pretty clean 2R - risk reward assessment that is overlaid on the price action. Positive bias, kind of lazy on the release but you can edit to change look back period or drop into one of your indicator edits as another metric for trade risk. If this helps drop a comment or thumbs up.
-Squam

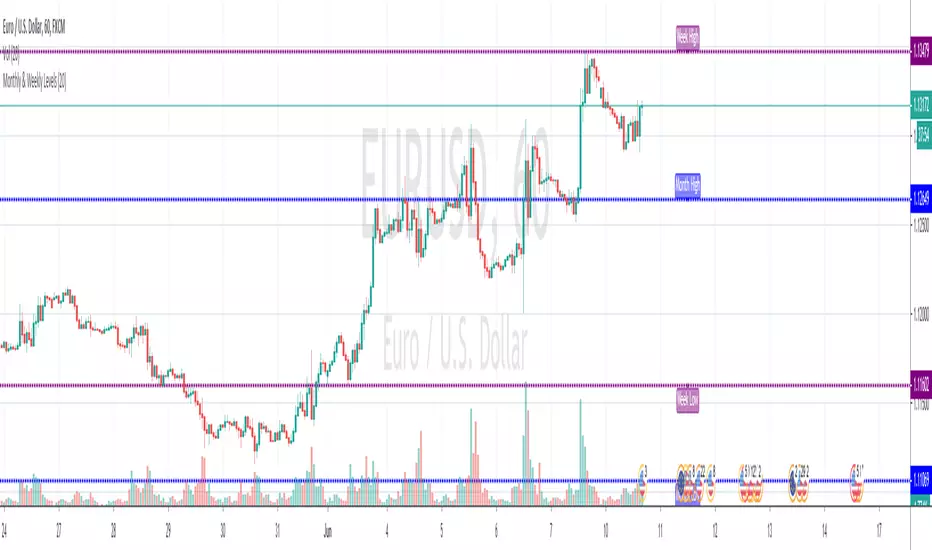
Monthly & Weekly LevelsShows and labels the previous monthly and weekly highs and lows, which are generally great areas to trade off. Loads quick and there's an option to hide the labels if they don't float your boat
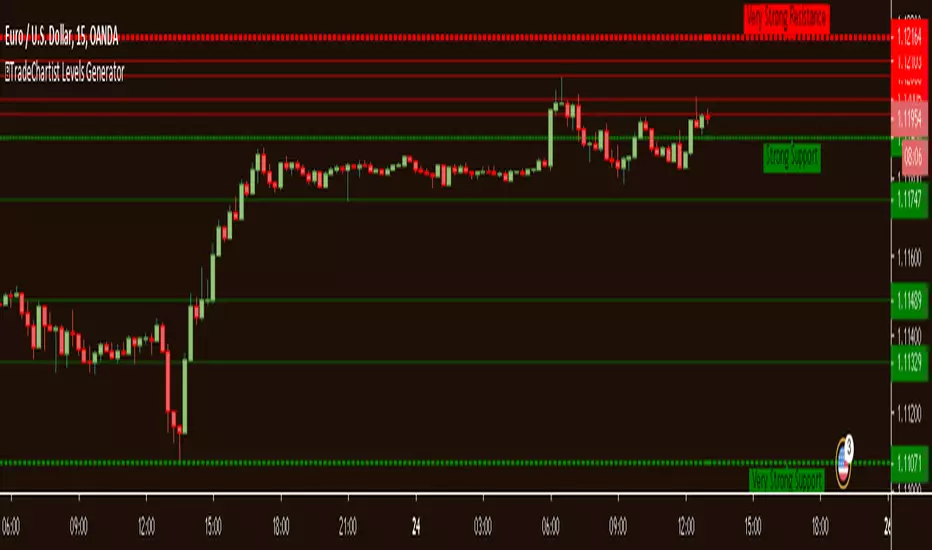
Levels Generator with Fibs"Levels Generator with Fibs" is an easy to use and a well coded script that can be used by traders of all levels from beginners to advanced professionals.
What does the script do?
Plots the support and resistance levels automatically based on user preference of Local or Global levels from indicator settings.
Plots Fibonacci retracement levels between high and low based on 'Days' or 'Candles' lookback from indicator settings.
What markets can this script be used on?
Forex
Stocks
Commodities
Cryptocurrencies
and almost any asset on Trading View
Does the script repaint levels?
No. The script does not repaint as it plots levels based on the past price movement. The only time the levels change for a given timeframe is when the price makes a new All Time High or a new All Time Low.
What is the difference between "Plot Levels" and "Plot Fibonacci Levels"?
"Plot Levels" plots support and resistance levels automatically without any input from the user other than preferred levels 'plot' from the indicator settings namely
Plot All Global Levels - Plots all important levels from ATH to ATL (dependent on data age/availability on Trading View) - recommended for Long term outlook
Plot Local Levels for Higher TF - Plots all important Support/Resistance levels for mostly higher time frames (1hr or higher) - Short to Mid term outlook
Plot Local Levels for Lower TF - Plots all important Support/Resistance levels for mostly smaller time frames (can be used for up to 1hr in most cases) - Recommended for Scalping/Swing Trading mostly dependent on volatility
"Plot Fibonacci Levels" plots all standard Fibonacci retracement levels - 0, 23.6%, 38.2%, 50%, 61.8%, 78.6% and 100% based on
"Days" Lookback - Fibonacci levels between High and Low based on number of days in the past, starting from the current day on any time frame chart
"Candles" Lookback - Fibonacci levels between High and Low based on number of candles in the past, starting from the current candle on any time frame chart
Can the Fibonacci levels be reversed?
Yes. The Fibonacci levels can be reversed by checking the "Reverse" checkbox from the indicator settings. This is very handy if the trend looks like there may be a support or resistance from one of the Fib levels and a possibility of a new high or a new low based on the price action.
What is the need for "Plot 1.272 Fibonacci Level" under "Plot Fibonacci Levels"?
1.272 is an important Fibonacci number as it is the square root of 1.618 and is the near support or resistance after 100% price retracement. Even though it keeps moving on the chart dependent on the new high or new low based on Days/Candles lookback, it serves as a 'nice to have' reference for any trader looking beyond 100% retracement for support/resistance.
Why do the 'local levels' lines' color changes between green and red?
The nearby levels lines change color based on price closing above or below them. This happens to only closest local levels for lower TF near price action and for top/bottom lines of the local levels for higher TF.
The line turns green when it becomes support as price closes above it.
The line turns red when it becomes resistance as price closes below it.
Can the levels lines' colors be changed?
Yes. The color of the Higher TF levels and all Global levels (from "Plot All Global Levels") can be changed from the 'Styles' tab from the indicator settings. Some lines change between green and red (which show on both light and dark themed background), so they are not editable and are hidden, but all other lines can be edited to show /hide or change color from the 'Styles' tab on the indicator settings.
What chart background is recommended?
The colors of the levels are neutral to both light and dark background of the chart screen, but a black or a dark background shows the lines even better. It comes down to user preference. If the default horizontal and vertical lines on chart screen is of no use, it can be hidden from 'Background' tab on Trading View chart settings by increasing the transparency of the lines all the way up.
Get in touch with me if you would like access to the script on monthly, 6 monthly or annual basis.
OHLM/DWMPlots the opens, highs, lows, and mid range of the daily, weekly and monthly. Option to have background highlights for session times but default is off.

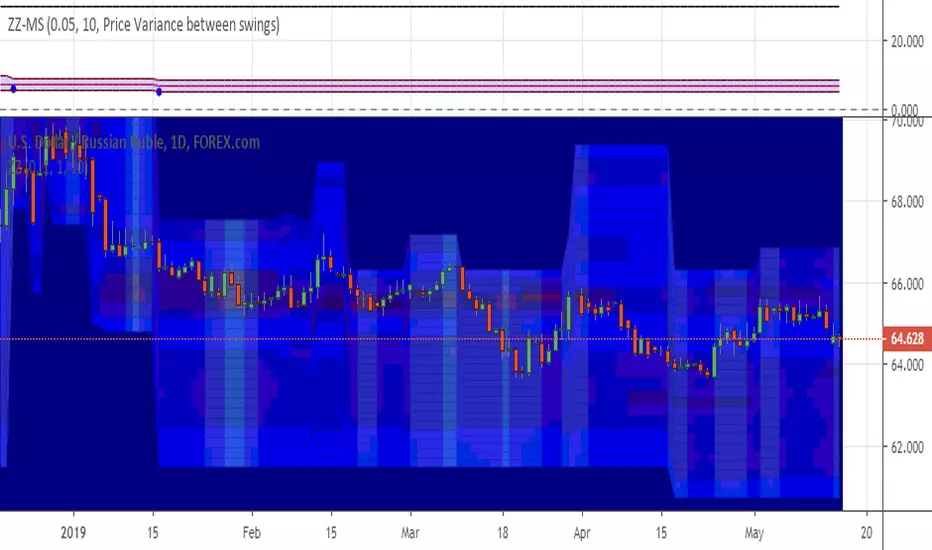
Confidence IntervalsThis indicator allows you to be able to see the confidence intervals for whatever asset you are trading given a certain expiry. Confidence intervals project the most probable price ranges over a certain period of time in the future.
In order to use this you must first specify what expiry you want to use in days, so if you want to project the confidence interval 1 day out you would input 1, if you want 1 year out you'd input 252 (the number of trading days in 1 year), if you want 12hrs out you'd input 0.5.
Next you must specify what timeframe you are using on your chart in minutes, so if you're using 5 min chart you'd input 5, if you're using 4hr you'd input 240, if you're using daily charts you'd use 1440.
Finally you must input what standard deviation you want to use for the confidence range.
Confidence levels are really helpful in trading, especially for options, because it allows you to be able to choose a more strategic expiry based on probabilities. In other types of trading such as stocks, futures, and FX confidence levels can be helpful in helping you better plan out your trade by figuring out where price probably will and will not go given a certain period of time in the future. Additionally, confidence levels allow you to be able to visualize volatility expansion and contraction.
Standard Deviation Probabilities:
0.5 STD has a 99% of touching the bounds of the interval and a 50% chance of closing beyond the bounds (these probabilities are not predicated on a certain direction, if you pick a certain direction divide these probabilities by 2)
1 STD has a 64% of touching the bounds of the interval and a ~30-32% chance of closing beyond the bounds (these probabilities are not predicated on a certain direction, if you pick a certain direction divide these probabilities by 2)
1.6 STD has a ~40% of touching the bounds of the interval and a ~20% chance of closing beyond the bounds (these probabilities are not predicated on a certain direction, if you pick a certain direction divide these probabilities by 2)
2 STD has a ~10% of touching the bounds of the interval and a ~5% chance of closing beyond the bounds (these probabilities are not predicated on a certain direction, if you pick a certain direction divide these probabilities by 2)
3 STD has a <2% of touching the bounds of the interval and a <1% chance of closing beyond the bounds (these probabilities are not predicated on a certain direction, if you pick a certain direction divide these probabilities by 2)

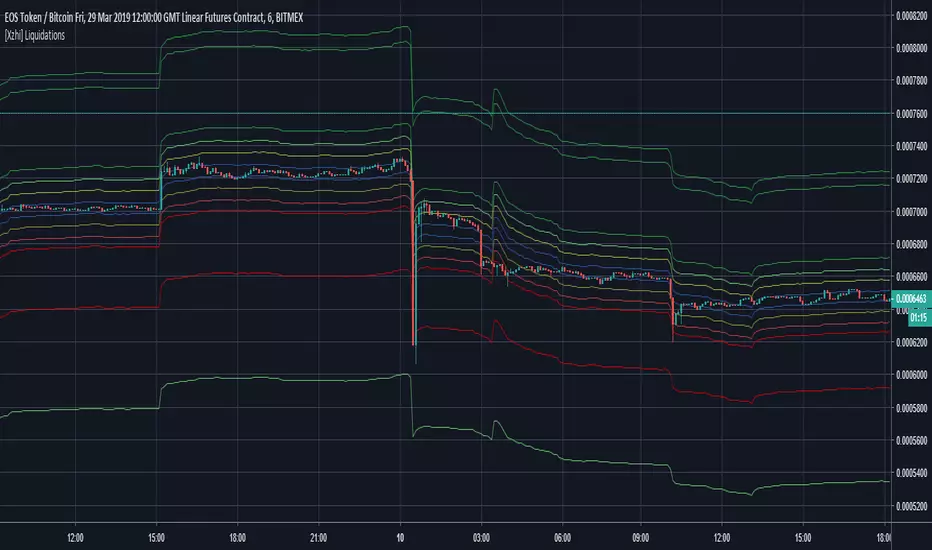
Bitmex Liquidations (More levels)Author of the script is Jaqobs
Moving averages based on VWMA and Bitmex's leverage liquidation multipliers.
Added more levels so it is easier to visually see where scaled limit orders should be placed in order to catch extreme wicks.
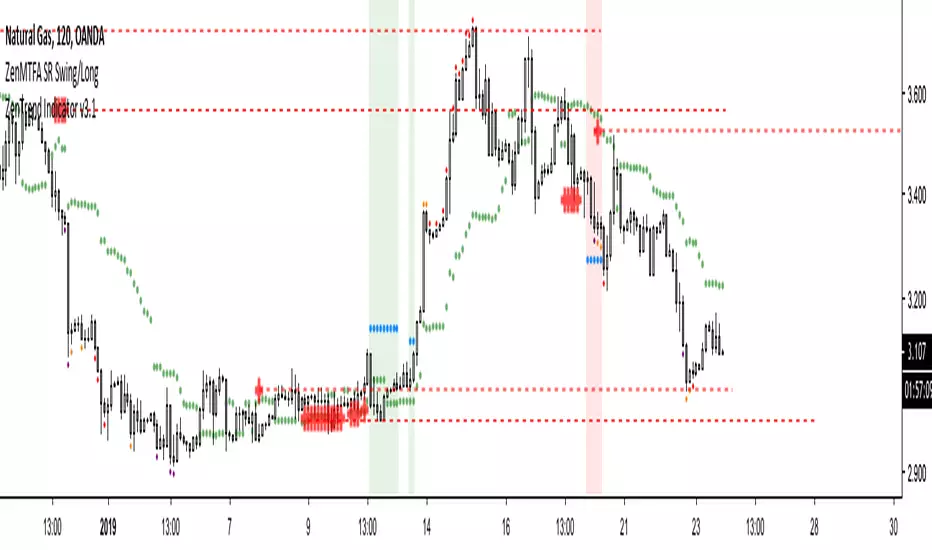
ZenTrading MTFA Support & Resistance_BETAThis is a multiple timeframe analysis indicator for the long term and swing trading timeframes (1HR upwards).
The crosses indicate support/resistance levels. Current levels as well as past levels are relevant.
This is a beta testing version of the indicator, there may be some minor issues, so use at your own risk.
A day trading timeframe version is coming soon.
If you have any questions feel free to contact me
RSI Based Automatic Supply and DemandA script that draws supply and demand zones based on the RSI indicator. For example if RSI is under 30 a supply zone is drawn on the chart and extended for as long as there isn't a new crossunder 30. Same goes for above 70. The threshold which by default is set to 30, which means 30 is added to 0 and subtracted from 100 to give us the classic 30/70 threshold on RSI, can be set in the indicator settings.
By only plotting the Demand Below Supply Above indicator you get automatic SD level that is updated every time RSI reaches either 30 or 70. If you plot the Resistance Zone / Support Zone you get an indicator that extends the zone instead of overwrite the earlier zone. Due to the zone being extended the chart can get a bit messy if there isn't a clear range going on.
There is also a "confirmation bars" setting where you can tell the script how many bars under over 30 / 70 you want before a zone is drawn.
Here is an image of only using the "Demand Below / Supply Above" plot.
As you can see, this could be useful "Price Flow" indicator, where we would only short if a zone appears below another zone, or long if two zones in a row are going up, like stairs.

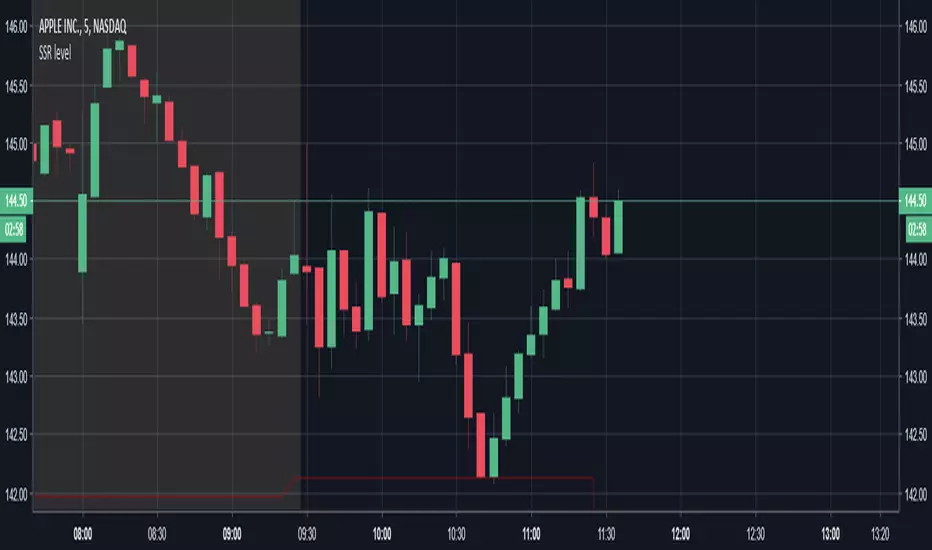
LCI - Short Sale Restriction / SSR levelsThis script highlights the level at which a stock will go into SSR mode for the day. Useful when looking to short a stock
Support and Resistance Levels (Volume) Script to create resistance levels, to find pivot points and accurate entry. On the smallest timeframes, the script shows the most accurate results.
Settings:
"Support / Resistance length" - the more, the less results, but more accuracy
"The number of candles on the screen" - screen length in bars for comfortable work

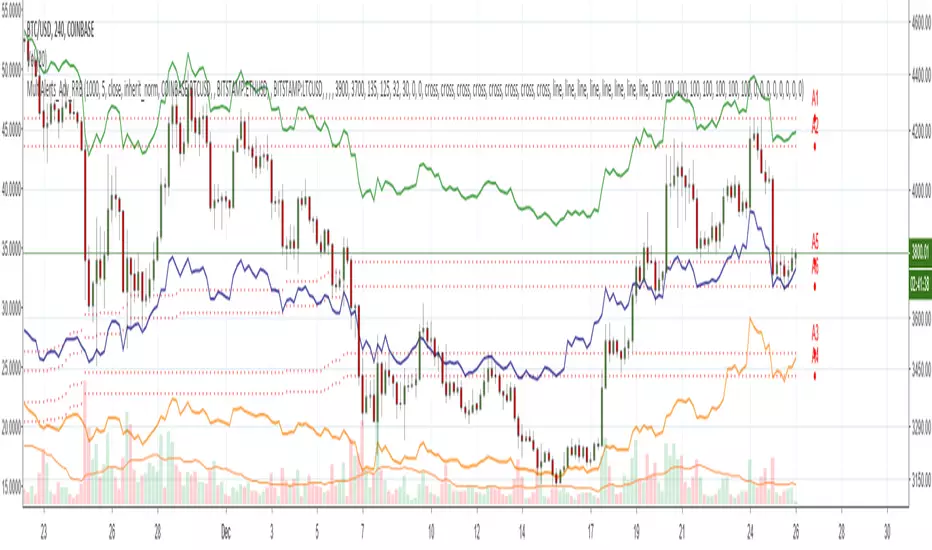
Zindarra Multi Alerts Advanced (8 Symbols, 8 Levels) by RRBZindarra Multi Alerts Advanced by RRB by RagingRocketBull 2018
Version 1.0
This indicator lets you configure multiple alert levels for several assets. Zindarra Multi Alerts Advanced supports 8 symbols with 8 custom alert levels.
You can have an M:M relationship betweeen symbols and levels, for example:
- 4 symbols each boxed by 2 alerts above/below the price
- 3 symbols with 1 alert each
- 2 symbols, 1st with 2 alerts, 2nd - with 6 alerts
- 1 symbol with 8 alerts etc
There are several versions: Simple, Pro, Advanced and Ultimate. This is the Advanced version. The Differences are listed below.
- Simple: 10 Alert Levels, 1 plot mode, alert type: cross, no colors/triggered alerts
- Pro: 9 Alert Levels, 2 plot modes: plot/price line, alert type: cross, +change/swap colors, +hide/disable triggered alerts, 2 penetration modes (close, high/low), trigger on confirmed close
- Advanced: 8 Symbols/Tickers, 8 Alert Levels, +alert types: cross up/cross down, no color change. Display sources as lines/candles, normalize, scale/shift independently
- Ultimate: 5 Symbols/Tickers, 8 Alert Levels, +alert types: volume/price %/abs change, volume/ema/time cross
Features:
- 8 custom symbols, symbols:levels = M:M
- 8 custom alert levels with labels. For each alert there must be a corresponding non-empty symbol (can be a duplicate)
- alert types: cross/cross up/cross down
- normalize symbols (and alert levels) to 100% to compare,
- scale and shift each symbol (and alert levels) to position on a chart independently
- 1 alert levels plot mode: plot
- 2 symbol types: line/candles
- colorize symbol candles
- high/low or close level penetration modes
- show/hide levels/labels
- keep or auto disable triggered alerts
- trigger alerts only after a confirmed close
You will see all symbols on a single chart at the same time with their corresponding alert levels. From this chart you can manage all alerts configured for multiple assets.
Although TradingView has 2 percentage scale modes (Percent, Indexed to 100), somehow they still fail to be usefull when comparing multiple assets.
This indicator lets you normalize all symbols to 100% making a direct single scale comparison between assets with vastly different price levels possible.
All alert levels will be normalized as well.
TradingView does not let you move the plots attached to left scale. When scaled they all remain stuck in the center and can't be moved vertically or relative to each other.
This indicator lets you position all symbols independently using individual scale and shift settings. For example, you can:
- split your screen in 3 horiz areas and have a symbol in each of them without overlapping or
- have several partially overlapping assets with different scale each or
- have all assets fully overlapping and normalized to the same 100% scale
You have to manually create an alert in Manage Alerts Panel and configure it to use with this indicator.
Free accounts are limited to only 1 alert slot and this indicator will take it (any existing alerts must be disabled/stopped).
Once the alert is configured, the indicator can be removed from chart to free a slot for another indicator, but you won't see the alert levels.
Usage:
1. attach indicator to a chart
2. define alert levels in UI settings
3. in TradingView's Manage Alerts panel on the right:
- for free accounts: disable/stop all existing alerts, you are limited to 1 alert slot only. Otherwise you won't be able to save.
- create a new Alert:
- select 'Multi Alerts' indicator name in the Condition dropdown box, leave Level 1 and Multi Alerts Cross as default options
- select 'Once Per Bar' or 'Once Per Minute' instead of 'Only Once' to trigger the alert multiple times
5. click Save. Your 9 alerts are enabled now.
Change Settings:
1. change levels/settings in UI. Any changes will also reset already triggered levels visibility.
2. in Manage Alerts panel:
- open/edit the alert you created
- select new instance of 'Multi Alerts' indicator name in the Condition dropdown box (appears at the bottom)
- check the Condition dropdown again - a single instance should remain selected.
3. click Save. Your alert settings are updated.
Notes on using alerts:
- attaching this indicator to a chart and configuring alert levels will not automatically enable the alerts - you have to manually create/configure a new alert in the Alerts Panel
- removing this indicator from chart will not disable the alerts, you have to manually disable the alert you created in the Alerts Panel
- your alert in the Alerts Panel uses another instance (copy) of indicator/settings. Any changes won't affect the alert. You have to manually update the alert every time you change any settings in the indicator.
- recompiling and attaching your own version of indicator will require creating a new Alert (delete the old one).
- alerts are designed to work in realtime. In replay mode you will see triggered alert levels hiding/changing colors but there will be no system alert messages. It's best to test the indicator in realtime on M1 (1 min) chart
- you will only see 1 system alert per bar/60 sec when multiple alert levels are crossed with a single bar or across several symbols at the same time. However all of these levels will hide in the indicator as expected.
- you can only see the alert levels when the indicator is attached to chart, they are not shown by the system alert.
- For source=high/low a directional level penetration is used automatically (crossunder/low and crossover/high). For source=close a standard bidirectional cross is used unless another alert type is specified.
- normalization breaks/distorts alert levels and symbol price - this is normal and is expected. To view the real price of alert levels uncheck normalize - the first 8 outputs are alert levels. Unnormalized levels are straight lines.
- you will see alerts from all symbols in the system alert message box of the current symbol - a bit confusing, but there's no workaround, you can't have a customized alert message for each symbol/level
- many tickers as arguments can stretch/break TradingView's Create New Alert dialog but it's still possible to push all required buttons and Save.
- duplicate symbols will be displayed by default. You can manually hide duplicates using show/hide flags.
- empty tickers (and corresponding alerts) are essentially disabled
1. uses plot*, cross*, barssince, highest, security, alertcondition
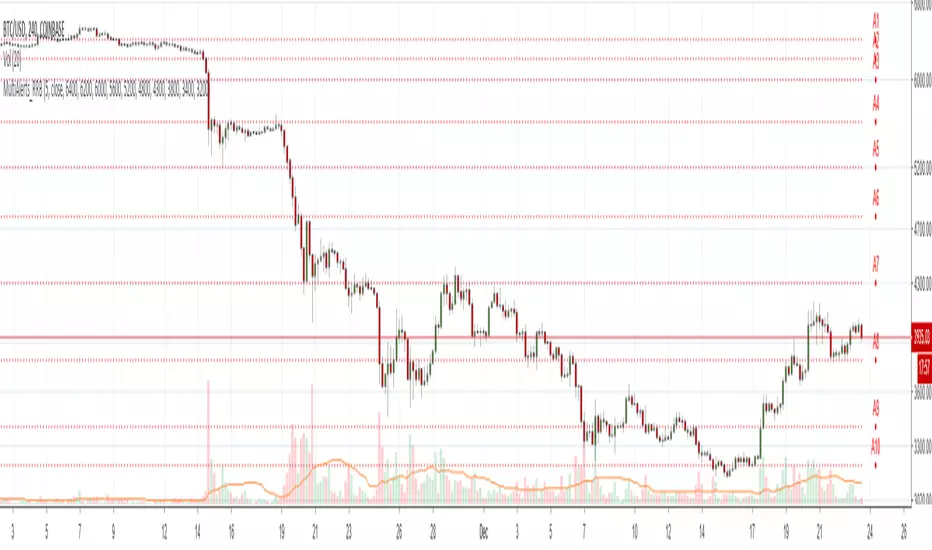
Zindarra Multi Alerts by RRBZindarra Multi Alerts by RRB by RagingRocketBull 2018
Version 1.0
This indicator lets you configure multiple alert levels for an asset. Zindarra Multi Alerts supports 10 custom alert levels.
You have to manually create an alert in Manage Alerts Panel and configure it to use with this indicator.
Free accounts are limited to only 1 alert slot and this indicator will take it (any existing alerts must be disabled/stopped).
Once the alert is configured, the indicator can be removed from chart to free a slot for another indicator, but you won't see the alert levels.
This is the Zindarra Multi Alerts Simple version. You can't auto disable already triggered alerts in this indicator. All alerts will remain active.
If you want to be able to hide/disable/change color of the triggered alert levels use the Zindarra Multi Alerts Pro version.
Features:
- 10 custom alert levels with labels
- set open/high/low/close source point for level penetration
- show/hide levels/labels
Usage:
1. attach indicator to a chart
2. define alert levels in UI settings
3. in TradingView's Manage Alerts panel on the right:
- for free accounts: disable/stop all existing alerts, you are limited to 1 alert slot only. Otherwise you won't be able to save.
- create a new Alert:
- select 'Multi Alerts' indicator name in the Condition dropdown box, leave Level 1 and Multi Alerts Cross as default options
- select 'Once Per Bar' or 'Once Per Minute' instead of 'Only Once' to trigger the alert multiple times
5. click Save. Your 9 alerts are enabled now.
Change Settings:
1. change levels/settings in UI
2. in Manage Alerts panel:
- open/edit the alert you created
- select new instance of 'Multi Alerts' indicator name in the Condition dropdown box (appears at the bottom)
- check the Condition dropdown again - a single instance should remain selected.
3. click Save. Your alert settings are updated.
Notes on using alerts:
- attaching this indicator to a chart and configuring alert levels will not automatically enable the alerts - you have to manually create/configure a new alert in the Alerts Panel
- removing this indicator from chart will not disable the alerts, you have to manually disable the alert you created in the Alerts Panel
- your alert in the Alerts Panel uses another instance (copy) of indicator/settings. Any changes won't affect the alert. You have to manually update the alert every time you change any settings in the indicator.
- recompiling and attaching your own version of indicator will require creating a new Alert (delete the old one).
- alerts are designed to work in realtime. In replay mode you will see only the alert levels but there will be no system alert messages. It's best to test the indicator in realtime on M1 (1 min) chart
- you will only see 1 system alert per bar/60 sec when multiple alert levels are crossed with a single bar.
- you can only see the alert levels when the indicator is attached to chart, they are not shown by the system alert.
- a standard bidirectional cross is used for all penetration sources
1. uses plot*, cross*, alertcondition
Zindarra Multi Alerts Pro (9 Levels) by RRBZindarra Multi Alerts Pro by RRB by RagingRocketBull 2018
Version 1.0
This indicator lets you configure multiple alert levels for an asset. Zindarra Multi Alerts Pro supports 9 custom alert levels.
You have to manually create an alert in Manage Alerts Panel and configure it to use with this indicator.
Free accounts are limited to only 1 alert slot and this indicator will take it (any existing alerts must be disabled/stopped).
Once the alert is configured, the indicator can be removed from chart to free a slot for another indicator, but you won't see the alert levels.
If you want 10 alert levels and don't need colors and Pro features - use Multi Alerts Simple version instead.
Features:
- 9 custom alert levels with labels
- 2 plot modes: plot and price line
- high/low or close level penetration modes
- show/hide levels/labels
- change color based on level position above/below price
- keep or auto disable triggered alerts
- trigger alerts only after a confirmed close
- swap level colors
Usage:
1. attach indicator to a chart
2. define alert levels in UI settings
3. in TradingView's Manage Alerts panel on the right:
- for free accounts: disable/stop all existing alerts, you are limited to 1 alert slot only. Otherwise you won't be able to save.
- create a new Alert:
- select 'Multi Alerts' indicator name in the Condition dropdown box, leave Level 1 and Multi Alerts Cross as default options
- select 'Once Per Bar' or 'Once Per Minute' instead of 'Only Once' to trigger the alert multiple times
5. click Save. Your 9 alerts are enabled now.
Change Settings:
1. change levels/settings in UI. Any changes will also reset already triggered level colors/visibility.
2. in Manage Alerts panel:
- open/edit the alert you created
- select new instance of 'Multi Alerts' indicator name in the Condition dropdown box (appears at the bottom)
- check the Condition dropdown again - a single instance should remain selected.
3. click Save. Your alert settings are updated.
Notes on using alerts:
- attaching this indicator to a chart and configuring alert levels will not automatically enable the alerts - you have to manually create/configure a new alert in the Alerts Panel
- removing this indicator from chart will not disable the alerts, you have to manually disable the alert you created in the Alerts Panel
- your alert in the Alerts Panel uses another instance (copy) of indicator/settings. Any changes won't affect the alert. You have to manually update the alert every time you change any settings in the indicator.
- recompiling and attaching your own version of indicator will require creating a new Alert (delete the old one).
- alerts are designed to work in realtime. In replay mode you will see triggered alert levels hiding/changing colors but there will be no system alert messages. It's best to test the indicator in realtime on M1 (1 min) chart
- you will only see 1 system alert per bar/60 sec when multiple alert levels are crossed with a single bar. However all of these levels will hide/change color in the indicator as expected.
- plot modes: price line - changes color of the whole level, style is not configurable; plot - changes color of a level's segment after each cross, configurable style
- you can only see the alert levels when the indicator is attached to chart, they are not shown by the system alert.
- For source=high/low a directional level penetration is used automatically (crossunder/low and crossover/high). For source=close a standard bidirectional cross is used. Colors always change above/below close.
1. uses plot*, cross*, alertcondition

Levels Ft. VolumeThese are levels based on volume. The idea is that candles of high volume a higher amount of traders with active long/short positions to either close out, protect, or add to.
A stack of red candles means that area is a point of interest, similar to a VPVR POC.

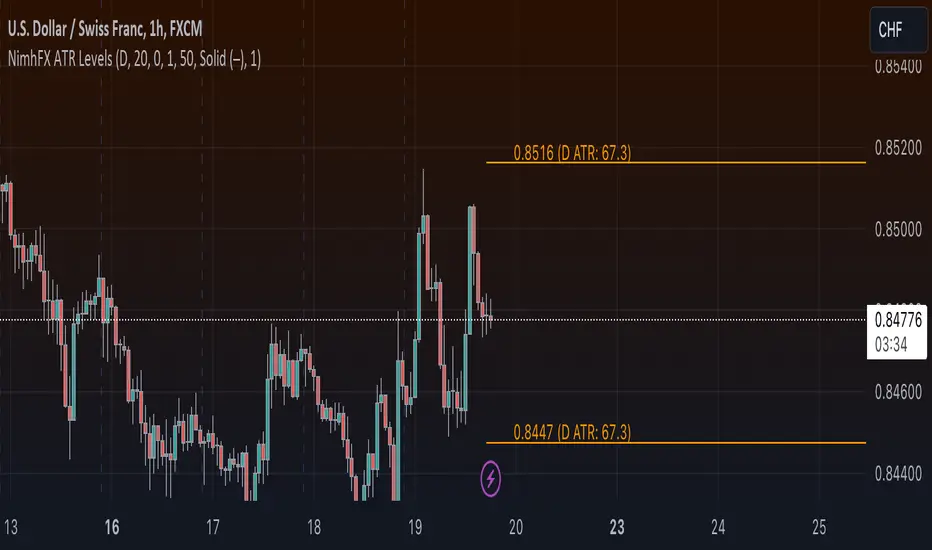
NimhFX Daily ATR High/Low Levels Creates an upper and lower level based on the ATR for your selected period. Calculation is based on the following;
Shift Variable works by allowing calculation from x-periods back.
Upper band = (Daily Low + ATR)
Lower Band = (Daily High - ATR)
Earnings Support and Resistance Levels [NeoButane]Inspired by @LazyBear's/@timwest's script:
Usage: support and resistance levels based on averaging price around earnings and quarterly opens.
What it is plotting:
1. A horizontal level whenever earnings occur. If actual earnings is higher than estimated, the line turns green, else red.
2. A horizontal level every quarterly open, colored black.
3. An average between the two mentioned above, colored orange.
4. 5% moves away from 3M open and earnings
5. Misc: 5% move away from that 5% move away, then 10% move away from the 2nd 5% move away.
By default, 4 and 5 are off to reduce visual noise.
Idea: Traders panic around certain dates that always happen, and traders always panic in the wrong direction. The market is composed of traders trading in the wrong direction at the same time, all the time. That means price will bounce back and forth as the gambling dens colloquially known as 'forex brokerages' or 'stock exchanges' take your money in the form of fees, time, and liquidations. So I put two lines on the chart and put one right in between, because it always goes back. I hope you can find it useful!
Note: This was a part of the old fundamental data indicators and is not officially for use, so while it should work on most U.S. stocks and a couple of other exchanges, it is not perfect.

💪 Support / Resistenace 👊 Finder by 🇨🇷🇾🇵🇹🇴🇷🇹🇭🇾🇭🇲🇸💪 Support / Resistenace 👊 Finder (SRF) dynamically finds support and resistance (supply and demand) levels automatically and weights them accordingly. This is a great tool to use when determining entry/exit upon S/R areas.
💰This indicator is given FREE to all our premium indicator subscribers.
📡SRF calculates the levels working from the current price. So even if you are looking old at historical data it will still calculate the S/R levels from the most recent data. (i.e. it really only works for the last few months on most instruments)
📑The indicator works on any timeframe and any market (stocks, forex, crypto, gold, oil).
📊The option "Pre length" can be changed to fit your needs. It will determine how much historical data the indicator will evaluate for each S/R level.
📊You can also choose how many support/resistance lines to plot from the dropdown menu.
📉Lastly you can also show the current/previous week or months OLHC values. These can often act as S/R levels as well. I suggest only using one at a time or it can get confusing.
💬Come chat with us in telegram (link in signature) if you have any questions or would like a trial of a premium indicators (linked below).
Bull Bear Filter
Bottom Top Finder

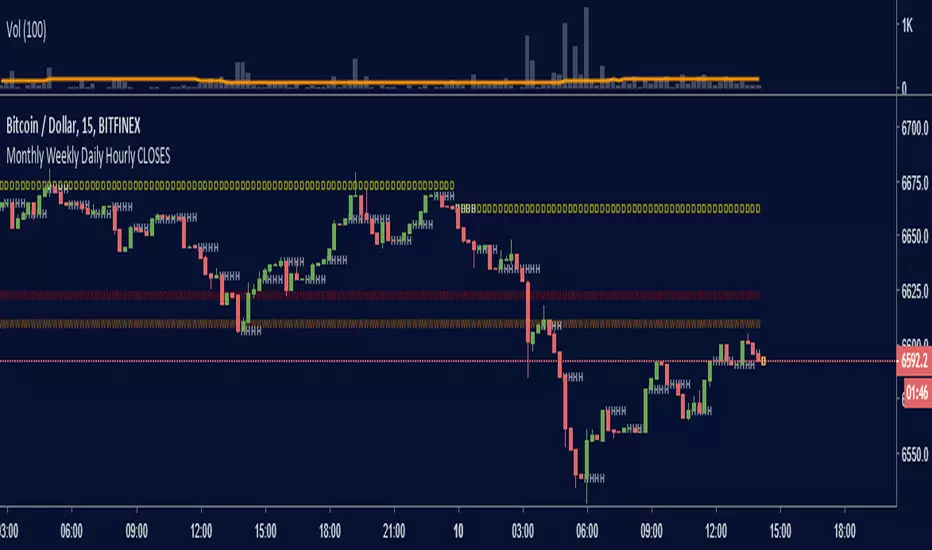
Monthly Weekly Daily Hourly CLOSESDraws horizontal segments where the last Monthly, Weekly, Daily and Hourly closes are.
Easily identify current price relative position to these key prices.
I use it as a kind of pivot points and help me with trend following entries: longs if up from last close, shorts if down from last close.
Monthly: red line (MMMMM)
Weekly: orange line (WWWWW)
Daily: yellow line (DDDDD)
Hourly: white line (HHHHH)
//Original idea from "Key Levels
Key Levels [@treypeng]Draws horizontal lines for Daily, Hourly (1) and Weekly levels. Really handy to switch on quickly when scalping.
Light blue: Previous hour OHLC
Thick light blue: Previous hour Close / current hour Open
Dark blue: Yesterday OHLC
Thick dark blue: Yesterday Close / today Open
Purple: Weekly Open
It's a bit ugly, I'd prefer horizontal rays instead of lines stretching back across the chart but I couldn't figure out how to do this in PineScript. If I get it sorted, I'll publish an update.

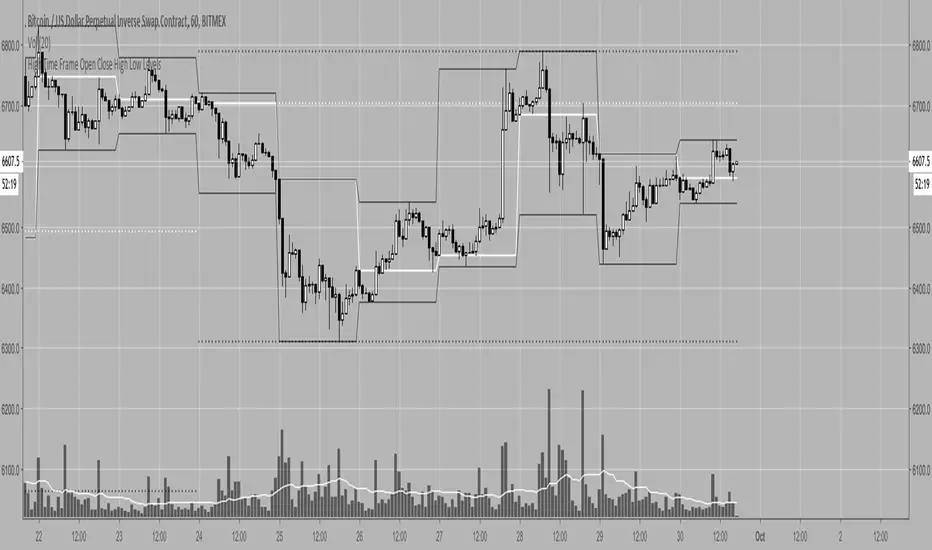
High Time Frame Open Close High Low LevelsGives you the OHLC levels of the weekly and daily candles as levels in whatever timeframe you're on so you can have a macro view in lower timeframes without having to switch timeframes constantly.
You may toggle the visibility of all the daily or weekly levels as well as each individual open/close/high/low.
The line styles and colors are customizable.
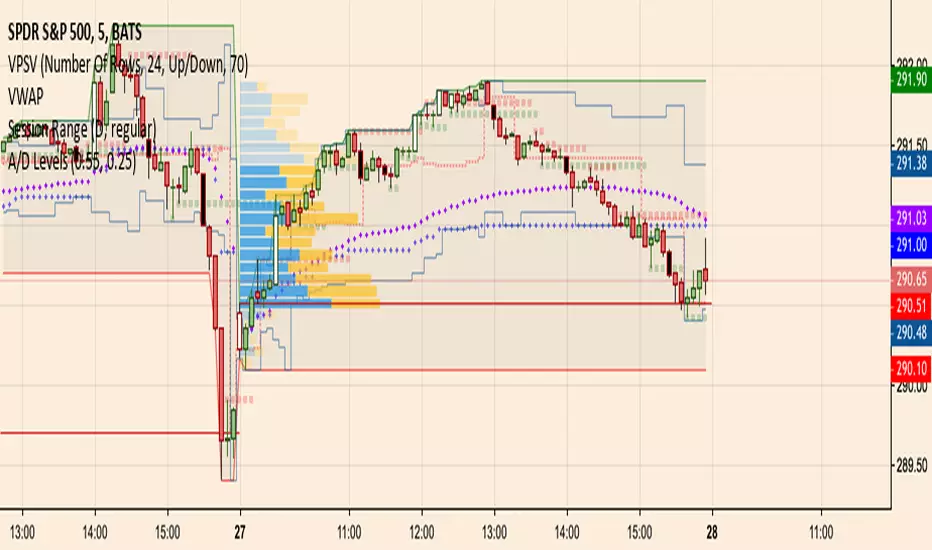
A/D Levelsuses reversal candles to determine accumulation and distribution candles
remembers the last reversal candle and draws a support or resistance line at the reversal level
does a barcolor if the price breaks support/resistance
similar to the hoffman a/d breakout indicator but there is no trend detection components
Dynamic Support & ResistanceThis indicator paints the background of the chart between 2 EMAs when all 3 given EMAs are in sync.
The default settings are:
Long-term EMA: 200 Period.
Short-term EMA 1: 50 Period.
Short-term EMA 2: 20 Period.
So according to the default settings, when the 20EMA is above the 50EMA, and the 50EMA is above the 200EMA, the area between the 20EMA and the 50EMA will turn green. When the 20EMA is below the 50EMA, and the 50EMA is below the 200EMA, the area will turn red. When the EMAs are all over the place (ie. price is consolidating), the area will be painted white.
You can change the colors in the indicator settings menu. To remove the white background, change the transparency to 100%. Unfortunately pinescript does not allow you to do this using code, otherwise I would have made that a default feature.
Enjoy! Let me know if you have any questions.
Regards,
- Matt
