Wick-RSI-CandleBody_SEZERthis strategy is ideal to recognize peaks for both long and short positions in 1h and 4h periods. for quick response and faster trade, please use 15m period but keep in mind targeting lower profits. otherwise you may lose your profit.
Longs

Bar Statistics - DELTA/OI/TOTAL/BUY/SELL/LONGS/SHORTSBar Statistics - Advanced Volume & Open Interest Analysis
Overview
The Bar Statistics indicator is a comprehensive analytical tool designed to provide traders with detailed insights into market microstructure through advanced volume analysis, open interest tracking, and market flow detection. This indicator transforms complex market data into easily digestible visual information, displaying six key metrics in customizable colored boxes that update in real-time.
Unlike traditional volume indicators that only show basic volume data, this indicator combines multiple data sources to reveal the underlying forces driving price movement, including volume delta calculations from lower timeframes, open interest changes, and estimated market positioning.
What Makes This Indicator Unique
1. Multi-Timeframe Volume Delta Precision
The indicator utilizes lower timeframe data (default 1-second) to calculate highly accurate volume delta measurements, providing much more precise buy/sell pressure analysis than standard timeframe-based calculations. This approach captures intraday volume dynamics that are often missed by conventional indicators.
2. Real-Time Updates
Unlike many indicators that only update on bar completion, this tool provides live updates for the developing candle, allowing traders to see evolving market conditions as they happen.
3. Market Flow Analysis
The unique "L/S" (Long/Short) metric combines open interest changes with price/volume direction to estimate net market positioning, helping identify when participants are accumulating or distributing positions.
4. Adaptive Visual Intensity
The gradient color system automatically adjusts based on historical context, making it easy to identify when current values are significant relative to recent market activity.
5. Complete Customization
Every aspect of the display can be customized, from the order of metrics to individual color schemes, allowing traders to adapt the tool to their specific analysis needs.
6.All In One Solution
6 Metrics in one indicator no more using 5 different indicators.
Core Features Explained
DELTA (Volume Delta)
What it shows: Net difference between aggressive buy volume and aggressive sell volume
Calculation: Uses lower timeframe data to determine whether each trade was initiated by buyers or sellers
Interpretation:
Positive values indicate aggressive buying pressure
Negative values indicate aggressive selling pressure
Magnitude indicates the strength of directional pressure
OI Δ (Open Interest Change)
What it shows: Change in open interest from the previous bar
Data source: Fetches open interest data using the "_OI" symbol suffix
Interpretation:
Positive values indicate new positions entering the market
Negative values indicate positions being closed
Combined with price direction, reveals market participant behavior
L/S (Net Long/Short Bias)
What it shows: Estimated net change in long vs short market positions
Calculation method: Combines open interest changes with price/volume direction using configurable logic
Scenarios analyzed:
New Longs: Rising OI + Rising Price/Volume = Long position accumulation
Liquidated Longs: Falling OI + Falling Price/Volume = Long position exits
New Shorts: Rising OI + Falling Price/Volume = Short position accumulation
Covered Shorts: Falling OI + Rising Price/Volume = Short position exits
Result: Net bias toward long (positive) or short (negative) market sentiment
TOTAL (Total Volume)
What it shows: Standard volume for the current bar
Purpose: Provides context for other metrics and baseline activity measurement
Enhanced display: Uses gradient intensity based on recent volume history
BUY (Estimated Buy Volume)
What it shows: Estimated aggressive buy volume
Calculation: (Total Volume + Delta) / 2
Use case: Helps quantify the actual buying pressure in monetary/contract terms
SELL (Estimated Sell Volume)
What it shows: Estimated aggressive sell volume
Calculation: (Total Volume - Delta) / 2
Use case: Helps quantify the actual selling pressure in monetary/contract terms
Configuration Options
Timeframe Settings
Custom Timeframe Toggle: Enable/disable custom lower timeframe selection
Timeframe Selection: Choose the precision level for volume delta calculations
Auto-Selection Logic: Automatically selects optimal timeframe based on chart timeframe
Net Positions Calculation
Direction Method: Choose between Price-based or Volume Delta-based direction determination
Value Method: Select between Open Interest Change or Volume for position size calculations
Display Customization
Row Order: Completely customize which metrics appear and in what order (6 positions available)
Color Schemes: Individual color selection for positive/negative values of each metric
Gradient Intensity: Configurable lookback period (10-200 bars) for relative intensity calculations
Visual Elements
Box Format: Clean, professional box display with clear labels
Color Coding: Intuitive color schemes with customizable transparency gradients
Real-time Updates: Live updating for developing candles with historical stability
How to Use This Indicator
For Day Traders
Volume Confirmation: Use DELTA to confirm breakout validity - strong directional moves should show corresponding volume delta
Entry Timing: Watch for volume delta divergences at key levels to time entries
Exit Signals: Monitor when aggressive volume shifts against your position
For Swing Traders
Market Flow: Focus on the L/S metric to identify when participants are accumulating or distributing
Open Interest Analysis: Use OI Δ to confirm whether moves are backed by new money or position adjustments
Trend Validation: Combine multiple metrics to validate trend strength and sustainability
For Scalpers
Real-time Edge: Utilize the live updates to see developing imbalances before bar completion
Quick Decision Making: Focus on DELTA and BUY/SELL for immediate market pressure assessment
Volume Profile: Use TOTAL volume context for optimal entry/exit sizing
Setup Recommendations
Futures Markets: Enable OI tracking and use Volume Delta direction method
Crypto Markets: Focus on DELTA and volume metrics; OI may not be available
Stock Markets: Use Price direction method with volume value calculations
High-Frequency Analysis: Set lower timeframe to 1S for maximum precision
Technical Implementation
Data Accuracy
Utilizes TradingView's ta.requestVolumeDelta() function for precise buy/sell classification
Implements error checking for data availability
Handles missing data gracefully with fallback calculations
Performance Optimization
Efficient array management with configurable lookback periods
Smart box creation and deletion to prevent memory issues
Optimized real-time updates without historical data corruption
Compatibility
Works on all timeframes from seconds to daily
Compatible with futures, forex, crypto, and stock markets
Automatically adjusts calculation methods based on available data
Risk Disclaimers
This indicator is designed for educational and analytical purposes. It provides statistical analysis of market data but does not guarantee trading success. Users should:
Combine with other forms of analysis
Practice proper risk management
Understand that past performance doesn't predict future results
Be aware that volume delta and open interest data quality varies by market and data provider
Conclusion
The Bar Statistics indicator represents a significant advancement in retail trader access to professional-grade market analysis tools. By combining multiple data sources into a single, customizable display, it provides the depth of analysis needed for comprehensive market microstructure understanding while maintaining the simplicity required for effective decision-making.

Net Positions (Net Longs & Net Shorts) - Volume AdjustedNet Positions (Net Longs & Net Shorts) - Volume Adjusted
Based on the legendary LeviathanCapital - Net Positions Indicator
Adjusted to use volume calculation for more percise data
Few important caveats:
- EVERY BUYER NEED A SELLER AND EVERY SELLER NEED A BUYER
- This indicator is meant to give you a sense of direction for the market orders ("who is the aggresive side") and should be used as confluence not as true values
In reality, in market movement each candle will contain both buying and selling, contracts closing and opening but due to some limitations that is hard to make properly.
Even with these limitations this indicator can provide a better picture than some other even external tools out there.
The main benefit of using volume delta and open interest instead of just open interest and candle closes G/R that it solves the problem with extreme cases where there might be an absorption of market orders.
Example of the Volume Edge in Action:
Bullish Absorption (The "Trap" for Sellers)
Candle Close + OI: A large Red Candle forms with Rising OI. The interpretation is simply: "New shorts are opening"
Volume Delta + OI: The same Red Candle with Rising OI has a Positive Volume Delta.
The True Story: Aggressive buyers tried to push the price up, but they were completely absorbed by large passive sell orders.
The "Volume Delta" logic:
If OI ↑ → new positions opened
• Delta ↑ → net longs added
• Delta ↓ → net shorts added
If OI ↓ → positions closed
• Delta ↑ → shorts closing
• Delta ↓ → longs closing
The "Price" logic:
If OI ↑ → new positions opened
• Price ↑ → net longs added
• Price ↓ → net shorts added
If OI ↓ → positions closed
• Price ↑ → shorts closing
• Price ↓ → longs closing

Market Regime Matrix [Alpha Extract]A sophisticated market regime classification system that combines multiple technical analysis components into an intelligent scoring framework to identify and track dominant market conditions. Utilizing advanced ADX-based trend detection, EMA directional analysis, volatility assessment, and crash protection protocols, the Market Regime Matrix delivers institutional-grade regime classification with BULL, BEAR, and CHOP states. The system features intelligent scoring with smoothing algorithms, duration filters for stability, and structure-based conviction adjustments to provide traders with clear, actionable market context.
🔶 Multi-Component Regime Engine Integrates five core analytical components: ADX trend strength detection, EMA-200 directional bias, ROC momentum analysis, Bollinger Band volatility measurement, and zig-zag structure verification. Each component contributes to a sophisticated scoring system that evaluates market conditions across multiple dimensions, ensuring comprehensive regime assessment with institutional precision.
// Gate Keeper: ADX determines market type
is_trending = adx_value > adx_trend_threshold
is_ranging = adx_value <= adx_trend_threshold
is_maximum_chop = adx_value <= adx_chop_threshold
// BULL CONDITIONS with Structure Veto
if price_above_ema and di_bullish
if use_structure_filter and isBullStructure
raw_bullScore := 5.0 // MAXIMUM CONVICTION: Strong signals + Bull structure
else if use_structure_filter and not isBullStructure
raw_bullScore := 3.0 // REDUCED: Strong signals but broken structure
🔶 Intelligent Scoring System Employs a dynamic 0-5 scale scoring mechanism for each regime type (BULL/BEAR/CHOP) with adaptive conviction levels. The system automatically adjusts scores based on signal alignment, market structure confirmation, and volatility conditions. Features decision margin requirements to prevent false regime changes and includes maximum conviction thresholds for high-probability setups.
🔶 Advanced Structure Filter Implements zig-zag based market structure analysis using configurable deviation thresholds to identify significant pivot points. The system tracks Higher Highs/Higher Lows (HH/HL) for bullish structure and Lower Lows/Lower Highs (LL/LH) for bearish structure, applying structure veto logic that reduces conviction when price action contradicts the underlying trend framework.
// Define Market Structure (Bull = HH/HL, Bear = LL/LH)
isBullStructure = not na(last_significant_high) and not na(prev_significant_high) and
not na(last_significant_low) and not na(prev_significant_low) and
last_significant_high > prev_significant_high and last_significant_low > prev_significant_low
isBearStructure = not na(last_significant_high) and not na(prev_significant_high) and
not na(last_significant_low) and not na(prev_significant_low) and
last_significant_low < prev_significant_low and last_significant_high < prev_significant_high
🔶 Superior Engine Components Features dual-layer regime stabilization through score smoothing and duration filtering. The score smoothing component reduces noise by averaging raw scores over configurable periods, while the duration filter requires minimum regime persistence before confirming changes. This eliminates whipsaws and ensures regime transitions represent genuine market shifts rather than temporary fluctuations.
🔶 Crash Detection & Active Penalties Incorporates sophisticated crash detection using Rate of Change (ROC) analysis with severity classification. When crash conditions are detected, the system applies active penalties (-5.0) to BULL and CHOP scores while boosting BEAR conviction based on crash severity. This ensures immediate regime response to major market dislocations and drawdown events.
// === CRASH OVERRIDE (Active Penalties) ===
is_crash = roc_value < crash_threshold
if is_crash
// Calculate crash severity
crash_severity = math.abs(roc_value / crash_threshold)
crash_bonus = 4.0 + (crash_severity - 1.0) * 2.0
// ACTIVE PENALTIES: Force bear dominance
raw_bearScore := math.max(raw_bearScore, crash_bonus)
raw_bullScore := -5.0 // ACTIVE PENALTY
raw_chopScore := -5.0 // ACTIVE PENALTY
❓How It Works
🔶 ADX-Based Market Classification The Market Regime Matrix uses ADX (Average Directional Index) as the primary gatekeeper to distinguish between trending and ranging market conditions. When ADX exceeds the trend threshold, the system activates BULL/BEAR regime logic using DI+/DI- crossovers and EMA positioning. When ADX falls below the ranging threshold, CHOP regime logic takes precedence, with maximum conviction assigned during ultra-low ADX periods.
🔶 Dynamic Conviction Scaling Each regime receives conviction ratings from UNCERTAIN to MAXIMUM based on signal alignment and score magnitude. MAXIMUM conviction (5.0 score) requires perfect signal alignment plus favorable market structure. The system progressively reduces conviction when signals conflict or structure breaks, ensuring traders understand the reliability of each regime classification.
🔶 Regime Transition Management Implements decision margin requirements where new regimes must exceed existing regimes by configurable thresholds before transitions occur. Combined with duration filtering, this prevents premature regime changes and maintains stability during consolidation periods. The system tracks both raw regime signals and final regime output for complete transparency.
🔶 Visual Regime Mapping Provides comprehensive visual feedback through colored candle overlays, background regime highlighting, and real-time information tables. The system displays regime history, conviction levels, structure status, and key metrics in an organized dashboard format. Regime changes trigger immediate visual alerts with detailed transition information.
🔶 Performance Optimization Features efficient array management for zig-zag calculations, smart variable updating to prevent recomputation, and configurable debug modes for strategy development. The system maintains optimal performance across all timeframes while providing institutional-grade analytical depth.
Why Choose Market Regime Matrix ?
The Market Regime Matrix represents the evolution of market regime analysis, combining traditional technical indicators with modern algorithmic decision-making frameworks. By integrating multiple analytical dimensions with intelligent scoring, structure verification, and crash protection, it provides traders with institutional-quality market context that adapts to changing conditions. The sophisticated filtering system eliminates noise while preserving responsiveness, making it an essential tool for traders seeking to align their strategies with dominant market regimes and avoid adverse market environments.

lon super chart## LON Super Chart Indicator
### Overview
The LON Super Chart indicator is a sophisticated volume-price momentum oscillator that combines price action with volume analysis to identify potential trading opportunities. It features a unique DNA spiral visualization that provides real-time insights into market dynamics.
### Key Features
- **Dual Line System**: Main indicator line and moving average for trend confirmation
- **DNA Spiral Visualization**: Unique spiral connection lines between the two main lines
- **Dynamic Color Coding**: Spiral colors change based on line convergence/divergence
- **Volume-Price Integration**: Combines price movements with volume density analysis
### Visual Elements
- **Red Main Line**: Primary LON indicator line
- **Green Moving Average**: Trend confirmation line
- **DNA Spiral Lines**: Dynamic connection lines with color-coded behavior
- **Zero Axis**: Reference line for trend direction
### Color Interpretation
#### Spiral DNA Colors
- **Red Spiral**: Lines are diverging (increasing distance) - potential trend continuation
- **Green Spiral**: Lines are converging (decreasing distance) - potential reversal signal
- **Gray Spiral**: No significant change in line distance
### Trading Strategy
#### Entry Signals
1. **Convergence Signal**: When spiral turns green (lines converging)
- May indicate potential reversal or consolidation
- Look for additional confirmation signals
2. **Divergence Signal**: When spiral turns red (lines diverging)
- May indicate trend continuation
- Consider following the trend direction
#### Trend Analysis
- **Above Zero**: Bullish momentum
- **Below Zero**: Bearish momentum
- **Line Crossovers**: Potential trend change signals
### Best Practices
- **Timeframe**: Works best on 1H, 4H, and Daily charts
- **Markets**: Effective on stocks, forex, and crypto
- **Confirmation**: Always combine with other technical analysis tools
- **Risk Management**: Use stop losses and position sizing
### Usage Tips
- Monitor spiral color changes for early trend signals
- Use zero axis crossovers for major trend direction
- Combine with volume analysis for stronger signals
- Avoid trading against strong spiral color trends
This indicator excels at identifying momentum shifts and trend dynamics through its innovative visual approach, making it ideal for swing trading and medium-term position management.

LON Super Tiangong Index## LON Super Heavenly Palace Indicator
### Description
The LON Super Heavenly Palace indicator is a sophisticated multi-line oscillator that identifies potential trading opportunities through a combination of momentum and trend analysis. It features four distinct lines that work together to provide comprehensive market insights.
### Key Features
- **Four Main Lines**: Short, Mid, Mid-Long, and Long lines with distinct colors
- **Adaptive Signals**: Uses both absolute and relative value analysis for better market adaptation
- **Visual Alerts**: Background highlighting and shape markers for clear signal identification
- **Multiple Signal Types**: Comprehensive signal system for various market conditions
### Trading Signals
#### Bullish Signals
- **Dragon's Treasure**: Blue background when all lines are in relative bottom territory
- **Golden Signal**: Cyan circles when all lines are below 20
- **Bounce Signal**: Pink triangles when long-term momentum turns positive
- **Perfect Opportunity**: Purple triangles for optimal entry conditions
#### Bearish Signals
- **Heaven's Treasure**: Yellow background when mid and long lines reach relative top territory
- **Top Signal**: Yellow circles when mid line exceeds 80
#### Confirmation Signals
- **Bottom Signal**: Magenta circles for oversold conditions
- **Strong Bottom**: Large purple triangles for major reversal opportunities
### How to Use
#### Entry Strategy
1. **Wait for Dragon's Treasure** (blue background) - indicates oversold conditions
2. **Look for Golden Signal** (cyan circles) - confirms bottom formation
3. **Confirm with Bounce Signal** (pink triangles) - momentum turning positive
4. **Enter on Perfect Opportunity** (purple triangles) - optimal timing
#### Exit Strategy
1. **Monitor Heaven's Treasure** (yellow background) - overbought conditions
2. **Watch for Top Signal** (yellow circles) - exit signal
3. **Use reference lines** (20, 80) for additional confirmation
#### Risk Management
- Use the 15 and 80 reference lines as support/resistance
- Combine multiple signals for higher probability trades
- Avoid trading against strong trend signals
- Use the -90 reference line for extreme oversold conditions
### Best Practices
- **Timeframe**: Works best on 1H, 4H, and Daily charts
- **Markets**: Effective on stocks, forex, and crypto
- **Confirmation**: Always wait for multiple signals to align
- **Patience**: Don't force trades - wait for clear signal combinations
### Visual Reference
- **Blue background** = Potential buying opportunity
- **Yellow background** = Potential selling opportunity
- **Colored circles** = Confirmation signals
- **Triangles** = Entry/exit points
- **Dotted lines** = Key reference levels
This indicator excels at identifying oversold/overbought conditions and potential reversal points, making it ideal for swing trading and medium-term position management.

Order Block Matrix [Alpha Extract]The Order Block Matrix indicator identifies and visualizes key supply and demand zones on your chart, helping traders recognize potential reversal points and high-probability trading setups.
This tool helps traders:
Visualize key order blocks with volume profile histograms showing liquidity distribution.
Identify high-volume price levels where institutional activity occurs.
rank historical order blocks and analyze their strength based on volume.
Receive alerts for potential trading opportunities based on price-block interactions.
🔶 CALCULATION
The indicator processes chart data to identify and analyze order blocks:
Order Block Detection
Inputs:
Price action patterns (consolidation areas followed by breakouts).
Volume data from current and lower timeframes.
User-defined lookback periods and thresholds.
Detection Logic:
Identifies consolidation areas using a dynamic range comparison.
Confirms breakout patterns with percentage threshold validation.
Maps volume distribution across price levels within each order block.
🔶Volume Analysis
Volume Profiling:
Divides each order block into configurable grid segments.
Maps volume distribution across price segments within blocks.
Highlights zones with highest volume concentration.
Strength Assessment:
Calculates total block volume and relative strength metrics.
Compares block volume to historical averages.
Determines probability of reversal based on volume patterns.
isConsolidation(len) =>
high_range = ta.highest(high, len) - ta.lowest(high, len)
low_range = ta.highest(low, len) - ta.lowest(low, len)
avg_range = (high_range + low_range) / 2
current_range = high - low
current_range <= avg_range * (1 + obThreshold)
🔶 DETAILS
Visual Features
Volume Profile Histograms:
Color-coded bars showing volume concentration within order blocks.
Gradient coloring based on relative volume (high volume = brighter colors).
Bull blocks (green/teal) and bear blocks (red) with varying opacity.
Block Visualization:
Dynamic box sizing based on volume concentration.
Optional block borders and background fills.
Volume labels showing total block volume.
Screener Table:
Real-time analysis of order block metrics.
Shows block direction, proximity, retest count, and volume metrics.
Color-coded for quick reference.
Interpretation
High Volume Areas: Zones with institutional interest and potential reversal points.
Block Direction: Bullish blocks typically support price, bearish blocks typically resist price.
Retests: Multiple tests of an order block may strengthen or weaken its influence.
Block Age: Newer blocks often have stronger influence than older ones.
Volume Concentration: Brightest segments within blocks represent the highest volume areas.
🔶 EXAMPLES
The indicator helps identify key trading opportunities:
Bullish Order Blocks
Support Zones: Identify strong support levels where price is likely to bounce.
Breakout Confirmation: Validate breakouts with volume analysis to avoid false moves.
Retest Strategies: Enter trades when price retests a bullish order block with high volume.
Bearish Order Blocks
Resistance Zones: Identify strong resistance levels where price is likely to reverse.
Distribution Areas: Detect zones where smart money is distributing to retail.
Short Opportunities: Find optimal short entry points at high-volume bearish blocks.
Combined Strategies
Order Block Stacking: Multiple aligned blocks create stronger support/resistance zones.
Block Mitigation: When price breaks through a block, it often indicates a strong trend continuation.
Volume Profile Applications: Higher volume segments provide more precise entry and exit points.
🔶 SETTINGS
Customization Options
Order Block Detection:
Consolidation Lookback: Adjust the period for consolidation detection.
Breakout Threshold: Set minimum percentage for breakout confirmation.
Historical Lookback Limit: Control how far back to scan for historical order blocks.
Maximum Order Blocks: Limit the number of visible blocks on the chart.
Visual Style:
Grid Segments: Adjust the number of volume profile segments.
Extend Blocks to Right: Enable/disable extending blocks to current price.
Show Block Borders: Toggle border visibility.
Border Width: Adjust thickness of block borders.
Show Volume Text: Enable/disable volume labels.
Volume Text Position: Control placement of volume labels.
Color Settings:
Bullish High/Low Volume Colors: Customize appearance of bullish blocks.
Bearish High/Low Volume Colors: Customize appearance of bearish blocks.
Border Color: Set color for block outlines.
Background Fill: Adjust color and transparency of block backgrounds.
Volume Text Color: Customize label appearance.
Screener Table:
Show Screener Table: Toggle table visibility.
Table Position: Select positioning on the chart.
Table Size: Adjust display size.
The Order Block Matrix indicator provides traders with powerful insights into market structure, helping to identify key levels where smart money is active and where high-probability trading opportunities may exist.

ZenAlgo - AvengerThe ZenAlgo - Avenger indicator provides a multi-layered view of market behavior by combining volume delta analytics, trend-following EMAs, average price comparison, and price-volume profiling into a unified overlay. It is designed to visually assist traders in identifying areas of interest, momentum shifts, and potential reversals using cumulative data from both spot and perpetual markets.
Volume Delta Calculation
This indicator computes delta as the difference between estimated buy and sell volumes using volume data from multiple centralized exchanges. It distinguishes between spot and perpetual volumes, combining them into total volume.
To estimate buying and selling volume from raw volume data, candle structure is broken down into body and wicks. The body is interpreted as the core directional movement (buy/sell), while the wicks are treated as uncertain or counteraction. This segmentation helps infer the likely share of buying and selling within each bar.
The delta is calculated per bar and then aggregated over a lookback period (default 14 bars) to generate a cumulative delta. This approach provides a smoothed value of volume pressure trends over time.
A moving average is applied to the delta values (using selectable MA types like EMA or SMA) to define signal crossovers and suppress noise.
Delta Visualization
To contextualize delta within price action, the delta is scaled dynamically (by ATR or user-defined value) and plotted as a band around the closing price. Positive delta expands upward from price, negative delta downward. This provides a visual overlay that reflects net market pressure in context with price movement.
In cases of extreme delta (threshold set at 80% of recent maximum), the indicator marks spike bars using symbols to indicate significant directional pressure.
Identification of Noteworthy Conditions
The indicator highlights points on the chart where specific conditions are met based on the interaction between volume delta and its moving average. These conditions may align with moments of market pressure imbalance and directional movement, but they are not to be interpreted as trade signals in isolation.
Instead, these chart markers serve as visual flags for potential interest. They are intended to draw the user’s attention to scenarios where:
The delta crosses above or below its moving average, suggesting a potential shift in volume pressure.
The cumulative delta supports the direction of this crossover.
Optional filters can further restrict these markings to periods where:
The short-term trend (as inferred from EMA slope) supports the direction.
Volume is elevated relative to a recent average.
A user-defined cooldown period prevents multiple markings within short succession to avoid clutter.
It is essential to underscore that these markers do not constitute buy or sell advice . Their role is diagnostic , helping the trader to identify potential moments of interest which should be analyzed in conjunction with broader context, such as trend structure, price action, support/resistance levels, or external market data.
EMA Structure
Six EMAs with fixed lengths (13 to 56) are plotted and colored dynamically based on the most recent crossover between the fastest and slowest (EMA1 and EMA6). These EMAs help visualize short- to mid-term trends. The crossover itself is marked with symbols, with vertical offset based on ATR to maintain chart readability.
Average Line (AVG)
The indicator also calculates an average price based on a fixed window (100 bars). This is not a standard moving average but rather a raw average of recent prices stored in a circular buffer. The average is plotted, and its relative distance to the current price is labeled as a percentage. This feature serves as a simplified representation of fair value or mean reversion anchor.
EMA6 vs AVG Cross
Another layer of point of interest detection involves EMA6 crossing the AVG line. This crossover is only considered valid if EMA6 shows slope consistency in the crossing direction. These events are marked using symbols and offset vertically to avoid overlapping price action.
Divergence Detection
The script detects both regular and hidden divergences between price and delta:
Regular divergences are defined when price makes a higher high or lower low, while delta fails to confirm (makes a lower high or higher low).
Hidden divergences occur when price retraces (lower high or higher low), but delta moves against this retracement, indicating underlying strength or weakness.
Divergence points are labeled with "R" (regular) or "H" (hidden) and appear at local pivot highs or lows. The number of visible divergence labels can be limited for chart clarity.
POC and nPOC Calculations
The script includes a simplified volume profile implementation, calculating:
POC (Point of Control): the price level with the highest volume for the given period.
nPOC (non-tested POC): historical POCs that have not yet been revisited by price.
Price levels are bucketed into rows (user-defined), and volume per bucket is tracked to identify the POC. Upon a new period (e.g., day, week), a horizontal POC line is drawn. Once tested by price, the line’s appearance changes (color fades, label shrinks), helping users distinguish between untouched and touched levels.
Limits are enforced on the number of retained POCs and their maximum distance from current bars to optimize performance and chart readability.
Exchange Aggregation
Volume data is aggregated across major exchanges. This ensures that the delta calculation captures a broader market picture beyond a single venue, reducing exchange-specific noise.
How to Interpret Values
Delta Band: Wide bands indicate strong directional imbalance. Narrow bands suggest indecision or low volume.
EMA Crossover Symbols: Appear on directional shifts in moving averages. Multiple EMAs reinforcing the same slope typically indicate stronger trend.
AVG Line: Represents average price over recent history. Large deviations can indicate overextension or potential mean reversion.
Divergences: Regular ones may point to weakening momentum; hidden ones can suggest continuation despite corrective price action.
POC / nPOC: Key volume-based support/resistance levels. Untested nPOCs can act as magnets for price retests.
How to Best Use This Indicator
Use in conjunction with trend context (e.g., higher timeframe EMAs) to avoid counter-trend indications.
Treat delta spikes as caution zones—especially if they occur at known support/resistance.
Watch for divergences as early warning signs before price reverses.
Use POC/nPOC as target levels, especially if aligned with delta signals.
Apply volume and trend filters to reduce noise on shorter timeframes.
Added Value
Multi-exchange volume aggregation makes the delta calculation more robust.
Real-time cumulative delta overlaid directly on the price chart provides immediate context.
Points of interest on chart are conservative and filterable, intended to reduce false positives.
The combination of delta, trend-following EMAs, fair value line, and volume profile data is rarely found in one overlay script.
POC/nPOC visualization based on real traded volume helps identify high-interest zones for future price interaction.
Why Is It Worth Paying For
While free alternatives may provide partial insights (e.g., basic delta or single EMA crossovers), this indicator integrates multiple domains—delta, divergence, average price, trend overlays, and profile levels—into a coherent, optimized chart tool. The value lies not just in having these tools, but in how they are synchronized and visualized.
Furthermore, sourcing and synchronizing volume data from multiple exchanges for delta estimation is not straightforward in Pine Script and adds to the indicator's complexity and utility.
Disclaimers and Limitations
Delta estimation is based on candle structure and assumes wick/body distribution reflects buyer/seller activity, which may not always be precise.
Multi-exchange volume data relies on availability via TradingView’s request.security() function; if exchange data is missing or delayed, results may be incomplete.
Divergences do not guarantee reversals—should be used as part of a broader analysis framework.
On illiquid instruments or exotic pairs, the value of delta and volume-based analytics may be reduced due to unreliable volume.

Aggregated Open Interest [Alpha Extract]The Aggregated Open Interest indicator provides a comprehensive view of open interest across multiple cryptocurrency exchanges, allowing traders to monitor institutional positioning and market sentiment. By aggregating data from major exchanges like Binance, BitMEX, and Kraken, this indicator offers valuable insights into potential price movements and market shifts.
🔶 CALCULATION
The indicator processes open interest data through multiple analytical methods:
Exchange Aggregation: Collects and normalizes open interest data from multiple exchanges (Binance, BitMEX, Kraken) with proper currency normalization.
Multi-Mode Analysis: Calculates various metrics including raw open interest values, OI change, OI delta, volume-weighted delta, and OI RSI.
Divergence Detection: Uses pivot point analysis to identify divergences between price action and open interest movements.
Activity Assessment: Tracks bullish and bearish activity patterns by correlating open interest changes with price movements.
Formula:
Aggregate OI = Sum of normalized open interest from selected exchanges
OI Change = Current OI - Previous OI
OI Delta = Net change in open interest across timeframes
OI Delta × Volume = OI Delta weighted by relative volume
OI RSI = Relative Strength Index applied to open interest values
OI Heatmap = Multi-timeframe visualization of OI changes across 7 distinct periods
🔶 DETAILS
Visual Features:
Open Interest: Candlestick representation of aggregated open interest
OI Change: Histogram showing period-to-period changes
OI Delta: Histogram displaying net OI movements
OI Delta × Volume: Volume-weighted OI delta for enhanced signals
OI RSI: Oscillator showing overbought/oversold OI conditions
OI Heatmap: Multi-timeframe visualization showing OI changes across 7 periods (3, 5, 8, 13, 21, 34, and 55 days)
Divergence Detection: Color-coded markers (teal for bullish, red for bearish) highlighting significant divergences between price and open interest
Analysis Table: Real-time summary of key metrics including aggregate OI, recent changes, and bullish/bearish activity.
Interpretation:
Increasing Open Interest + Rising Price: Strong bullish trend confirmation
Increasing Open Interest + Falling Price: Strong bearish trend confirmation
Decreasing Open Interest + Rising Price: Weak bullish trend (potential reversal)
Decreasing Open Interest + Falling Price: Weak bearish trend (potential reversal)
Divergences: Signal potential trend exhaustion and reversals when price moves in one direction while open interest moves in the opposite direction
Heatmap: Provides at-a-glance insight into open interest trends across multiple timeframes, with green bars indicating rising OI and red bars indicating falling OI
🔶 EXAMPLES
Trend Confirmation: Rising open interest accompanying a price increase confirms strong bullish momentum with institutional backing.
Example: During January-February 2025, rising OI during price advances confirms institutional participation in the uptrend.
Bearish Divergence: Price makes a higher high while open interest makes a lower high, signaling potential trend reversal.
Example: Red markers appear at market tops where price continues higher but open interest fails to confirm, preceding significant corrections.
Bullish Divergence : Price makes a lower low while open interest makes a higher low, indicating potential bottoming.
Example: Teal markers appear at market bottoms where price continues lower but open interest fails to confirm, preceding significant rallies.
OI Heatmap Analysis : Multiple timeframes showing consistent red signals across short to long-term periods indicate strong institutional selling pressure.
Example: When all 7 periods (3-55 days) show red during a price uptrend, this signals institutional selling into retail strength, often preceding major corrections.
🔶 SETTINGS
Customization Options:
Data Sources: Toggle different exchanges (Binance USDT/USD/BUSD, BitMEX USD/USDT, Kraken USD)
Display Mode: Choose between Open Interest, OI Change, OI Delta, OI Delta × Volume, OI RSI, and OI Heatmap
Currency Units: Display in USD or base cryptocurrency (COIN)
Analysis Tools: Moving Average (length and color), RSI (length and color)
Divergence Detection: Enable/disable signals, adjust lookback period and threshold percentage, customize bullish/bearish divergence colors
OI Heatmap Colors: Customize bullish (green) and bearish (red) signal colors for the multi-timeframe heatmap visualization
The Aggregated Open Interest indicator provides traders with comprehensive insights into institutional positioning across major exchanges, helping identify potential trend continuations, reversals, and key market turning points driven by smart money movements. The addition of the OI Heatmap feature enables traders to quickly visualize open interest trends across multiple timeframes, providing valuable context for institutional positioning over different market cycles.

ZenAlgo - Advanced Open InterestZenAlgo - Advanced Open Interest combines open interest, price changes, and volume dynamics into a single, powerful TradingView indicator. By integrating these key market metrics and enhancing them with proprietary algorithms, it provides traders with actionable insights that streamline decision-making and enhance market analysis.
Features
Open Interest Change (%): Tracks changes in open interest, a key indicator of market participation and sentiment.
Price Change (%): Monitors price momentum, providing clarity on trend directions.
Volume Analysis: Aggregates upward and downward volume for detailed sentiment analysis.
Delta Calculation: Highlights the net difference between upward and downward volume, offering instant insights into buying or selling dominance.
Proprietary Trend Detection: Suggests "Long Enter," "Short Enter," "Long Close," or "Short Close" signals based on a synergy of open interest, price, and volume.
Market Sentiment Insights: Indicates whether new long or short positions dominate.
Customizable Display: Features themes, sizes, and positions for a tailored interface.
Added Value: Why Is This Indicator Original/Why Shall You Pay for This Indicator?
Integrated Synergy: Combining open interest, price, and volume into a single indicator reduces complexity and offers enhanced clarity. Instead of toggling between multiple charts, users receive actionable insights from a unified view.
Proprietary Rules-Based Algorithm: The algorithm synthesizes data from sub-indicators, creating trends and signals not available in free tools. For instance, the "Long Enter" or "Short Close" signals are generated by evaluating relationships between metrics, offering a predictive edge.
Enhanced Trend Confirmation: By correlating open interest changes with price movements and volume imbalances, the indicator provides a more robust confirmation of market trends compared to individual metrics.
Time-Saving and Simplicity: Freely available sub-indicators require manual setup, interpretation, and customization. ZenAlgo - Advanced Open Interest offers pre-configured analysis, reducing the learning curve and decision time.
Unique Customization: With themes, positions, and table sizes, users can adapt the interface to their preferences, enhancing usability.
How It Works
1. Open Interest and Price Change
Retrieves historical open interest and price data for the selected timeframe.
Calculates percentage changes between bars to indicate market participation (open interest) and directional momentum (price).
Combines these metrics to assess whether price movements are supported by increasing or decreasing participation.
2. Volume Aggregation
Splits the selected timeframe into smaller sub-timeframes to analyze granular volume data.
Aggregates upward (price closes above open) and downward (price closes below open) volumes, calculating their totals and percentage contributions to overall volume.
3. Delta Calculation
Computes Delta as the difference between upward and downward volume.
Highlights buyer or seller dominance using color-coded visuals for quick interpretation.
4. Trend Analysis
Uses a proprietary algorithm to classify market states:
"Long Enter": Rising price, increasing open interest, and dominant upward volume.
"Short Enter": Falling price, increasing open interest, and dominant downward volume.
Neutral States: Generated when no strong alignment is found among metrics.
5. Market Sentiment
Correlates open interest and price to indicate if new long or short positions dominate.
Outputs simplified insights like "More longs opened" or "Shorts closing."
6. Customizable Table
Displays real-time updates with user-controlled themes, sizes, and positions for a tailored experience.
Usage Examples
Detecting Bullish Trends: Identify "Long Enter" signals when open interest and price rise, supported by strong upward volume.
Spotting Bearish Reversals: Use "Short Enter" signals when price declines, open interest rises, and downward volume dominates.
Analyzing Volume Shifts: Leverage Delta to uncover significant shifts in buying or selling pressure.
Validating Trends: Use the combination of open interest and volume trends to confirm price movements.
Exiting Profitable Trades: Look for "Long Close" or "Short Close" signals to time exits during profit-taking phases.
Avoiding Choppy Markets: Use "Neutral" signals to stay out of indecisive markets and avoid unnecessary risks.
Identifying Sentiment Swings: Follow "Positions" insights to detect a transition in market dominance from longs to shorts or vice versa.
High-Volume Trend Confirmation: Confirm strong trends during high trading volumes.
Short-Term Scalping: Use sub-timeframes to spot rapid entry and exit points.
Event-Based Trading: Correlate indicator signals with major market events for timely trades.
Settings
ZenAlgo Theme: Toggle a branded theme for better visual integration.
Table Size: Adjust display size (Tiny, Small, Normal, Large) based on preference.
Table Position: Choose between four positions (e.g., Bottom Right, Top Left).
Table Mode: Switch between Dark and Light themes for optimal readability.
Important Notes
This indicator is a technical analysis tool and does not guarantee trading success. Use it with other indicators and fundamental analysis for a comprehensive strategy.
Always validate signals in conjunction with other market factors to ensure informed trading decisions.
Scenarios of Potential Underperformance:
Low-Volume Markets: Signals may lack reliability due to insufficient data granularity.
Extreme Volatility: Rapid price movements can distort short-term insights.
Exchange Variations: Data discrepancies between exchanges may affect calculations.
Choppy Markets: During indecisive phases, the indicator may generate more neutral signals.

DAILY Supertrend + EMA Crossover with RSI FilterThis strategy is a technical trading approach that combines multiple indicators—Supertrend, Exponential Moving Averages (EMAs), and the Relative Strength Index (RSI)—to identify and manage trades.
Core Components:
1. Exponential Moving Averages (EMAs):
Two EMAs, one with a shorter period (fast) and one with a longer period (slow), are calculated. The idea is to spot when the faster EMA crosses above or below the slower EMA. A fast EMA crossing above the slow EMA often suggests upward momentum, while crossing below suggests downward momentum.
2. Supertrend Indicator:
The Supertrend uses Average True Range (ATR) to establish dynamic support and resistance lines. These lines shift above or below price depending on the prevailing trend. When price is above the Supertrend line, the trend is considered bullish; when below, it’s considered bearish. This helps ensure that the strategy trades only in the direction of the overall trend rather than against it.
3. RSI Filter:
The RSI measures momentum. It helps avoid buying into markets that are already overbought or selling into markets that are oversold. For example, when going long (buying), the strategy only proceeds if the RSI is not too high, and when going short (selling), it only proceeds if the RSI is not too low. This filter is meant to improve the quality of the trades by reducing the chance of entering right before a reversal.
4. Time Filters:
The strategy only triggers entries during user-specified date and time ranges. This is useful if one wants to limit trading activity to certain trading sessions or periods with higher market liquidity.
5. Risk Management via ATR-based Stops and Targets:
Both stop loss and take profit levels are set as multiples of the ATR. ATR measures volatility, so when volatility is higher, both stops and profit targets adjust to give the trade more breathing room. Conversely, when volatility is low, stops and targets tighten. This dynamic approach helps maintain consistent risk management regardless of market conditions.
Overall Logic Flow:
- First, the market conditions are analyzed through EMAs, Supertrend, and RSI.
- When a buy (long) condition is met—meaning the fast EMA crosses above the slow EMA, the trend is bullish according to Supertrend, and RSI is below the specified “overbought” threshold—the strategy initiates or adds to a long position.
- Similarly, when a sell (short) condition is met—meaning the fast EMA crosses below the slow EMA, the trend is bearish, and RSI is above the specified “oversold” threshold—it initiates or adds to a short position.
- Each position is protected by an automatically calculated stop loss and a take profit level based on ATR multiples.
Intended Result:
By blending trend detection, momentum filtering, and volatility-adjusted risk management, the strategy aims to capture moves in the primary trend direction while avoiding entries at excessively stretched prices. Allowing multiple entries can potentially amplify gains in strong trends but also increases exposure, which traders should consider in their risk management approach.
In essence, this strategy tries to ride established trends as indicated by the Supertrend and EMAs, filter out poor-quality entries using RSI, and dynamically manage trade risk through ATR-based stops and targets.

ETH Long/Short Ratio BITFINEX - (ALPHRACTAL)Indicator Description: ETH Long/Short Ratio BITFINEX - (ALPHRACTAL)
The ETH Long/Short Ratio BITFINEX - (ALPHRACTAL) indicator provides a detailed analysis of Ethereum (ETH) long and short positions in USD and USDT on the Bitfinex exchange. This indicator is ideal for traders who want to monitor market behavior and better understand the relationship between long and short positions.
Features:
USD and USDT Long/Short Ratio:
Calculates and displays the ratio between long and short ETH positions in USD and USDT.
Helps identify market trends and the relative strength between buyers and sellers.
Color Configuration:
Allows customization of chart colors for clear and distinct visualization of USD and USDT ratios.
Uses colors with adjustable transparency to enhance chart visibility.
Label Display:
Option to show or hide labels indicating the type of ratio (USD or USDT) at the latest chart value.
Labels are useful for quickly identifying the visualized ratio.
Display Control:
Option to enable or disable the display of individual USD and USDT ratio charts.
Flexibility to view only the relevant data for your analysis.
How to Use:
Add the indicator to your chart to visualize the long/short ratios of ETH in USD and USDT.
Adjust colors and transparency as per your preference for better visual distinction.
Use the option to show or hide labels for quick identification of the data.
Analyze the relationship between long and short positions to make informed trading decisions, observing market buying and selling trends.
Example Use Cases:
Market Sentiment Analysis: An increase in the Long/Short ratio may indicate bullish sentiment among traders, while a decrease may indicate bearish sentiment.
Identifying Opportunities: Significant discrepancies between USD and USDT ratios may signal arbitrage opportunities or alert to significant market movements.
This indicator is a powerful tool for Ethereum traders who want a deeper understanding of market behavior and the dynamics of long and short positions on Bitfinex. Add the ETH Long/Short Ratio BITFINEX - (ALPHRACTAL) to your technical analysis toolkit and gain an edge in your trading strategy.
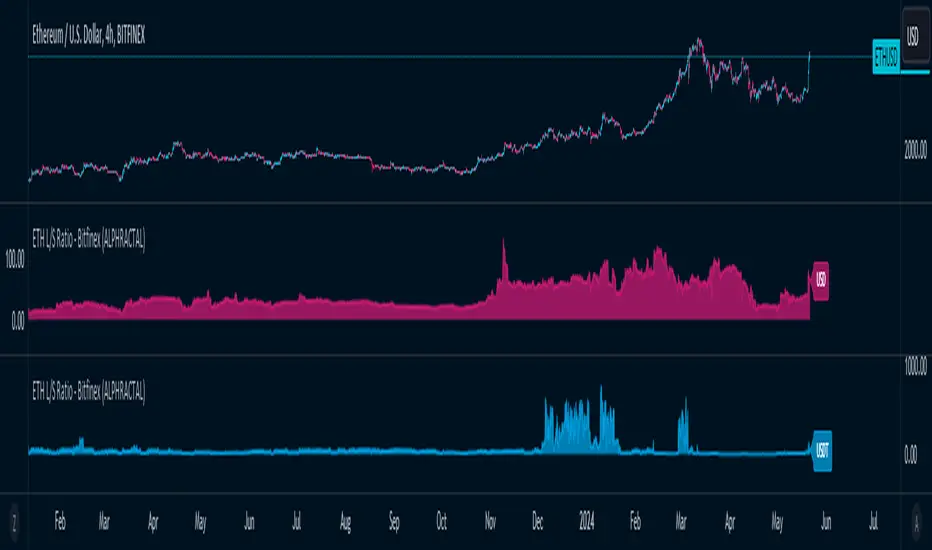
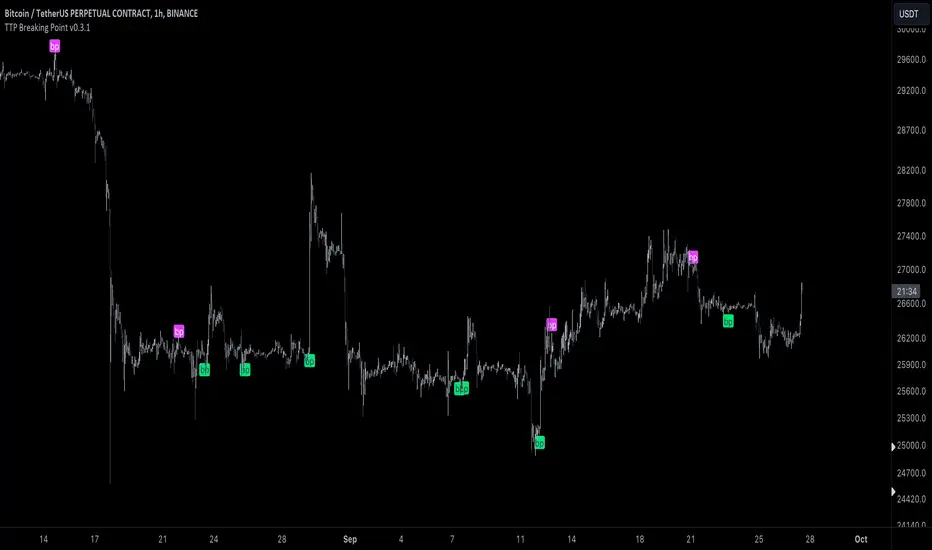
TTP Breaking PointThis signal uses information from BITFINEX:BTCUSDLONGS and BITFINEX:BTCUSDSHORTS to forecast tops and bottoms.
The idea behind is very simple.
We calculate the RSI of the ratio of longs vs shorts and find areas where both the SMA of this RSI and the RSI itself are overextended.
You might notice that the win rate is not high but most of the wins provide a decent move that, if combined with proper risk management, can be used to build profitable strategies.
The signal offers a backtesting stream: 1 for buy and 2 for sell.
Shortly I'll be adding new features including: alerts, support for other symbols, filters, etc.
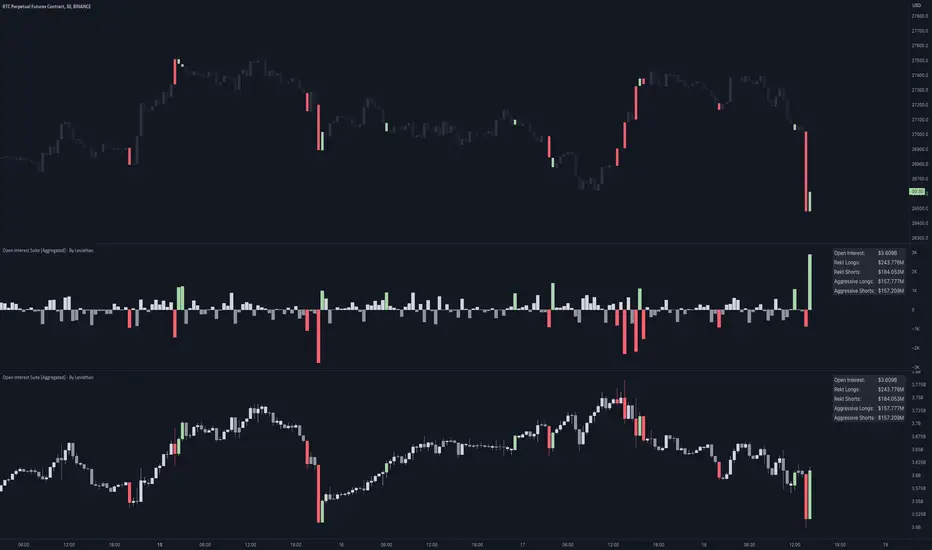
Open Interest Suite [Aggregated] - By LeviathanThis script is an all-in-one indicator that uses aggregated Open Interest data to plot OI candles, Open Interest Delta, OI x rVOL, and OI RSI. It also includes tools such as an OI Distribution profile, large OI increase/decrease coloring, a Stats Screener, and much more.
You can select and have the script plot the following:
- Open Interest in the form of OHLC candles
- Open Interest Delta in the form of a histogram
- Open Interest x Relative Volume in the form of a histogram
- Open Interest RSI in the form of a line
Additional features include:
- OI Distribution Profile (It shows the distribution of open interest in the visible range on y axis. This makes it easier to identify when Open Interest is relatively high or low and at which values most of the action took place)
- Stats screener (The screener includes the real-time net Open Interest value, Rekt Longs/Rekt Shorts based on large OI decreases and Aggressive Longs/Shorts based on large OI increases)
- Coloring (You can color OI Delta nodes, background and chart candles based on large OI increases/decreases)
- more
Instructions for the settings will be provided in the tooltips shortly.
Full credit goes to @KioseffTrading for the profile generation code.
Net Positions (Net Longs & Net Shorts) - By LeviathanThis script is an experimental indicator that visualizes the entering and exiting of long and short positions in the market. It also includes other useful tools, such as NL/NS Profile, NL/NS Delta, NL/NS Ratio, Volume Heatmap, Divergence finder, Relative Strength Index of Net Longs and Net Shorts, EMAs and VWMAs and more.
To avoid misinterpretation, it's important to understand some basics. The “real” ratio between net long and net short positions in a given market is always 1:1. A futures contract is an agreement between two parties to buy or sell an underlying asset at an agreed-upon price. Each contract has a long side and a short side, with one party agreeing to buy (long) and the other party agreeing to sell (short) the asset at the agreed-upon price. The long position holder anticipates that the asset's price will rise, while the short position holder expects it to fall. Because every futures contract involves both a buyer and a seller, it is impossible to have more net longs than net shorts or vice versa (in terms of the net value). For every long position opened, there must be a corresponding short position taken by another market participant (and vice versa), thus maintaining the 1:1 ratio between longs and shorts. While there can be an imbalance in the number of traders/accounts holding long and short contracts, the net value of positions held on each side remains 1 to 1.
Open Interest (OI) is a metric that tracks the number of open (unsettled) contracts in a given market. For example, Open Interest of 100 BTC means that there are currently 100 BTC worth of longs and 100 BTC worth of shorts open in the market. There may be more traders on one side holding smaller positions, and fewer traders on the other side holding larger positions, but the net value of positions on one side is equal to the net value of positions on the other side → 100 BTC in longs and 100 BTC in shorts (1:1). Consider a scenario in which a trader decides to open a long position for 1 BTC at a price of HKEX:30 ,000. For this long order to be executed, a counterparty must take the opposite side of the contract by placing an order to short 1 BTC at the same price of HKEX:30 ,000. When both the long and short orders are matched and executed, the open interest increases by 1 BTC, reflecting the addition of this new contract to the market.
Changes in Open Interest essentially tell us 3 things:
- OI Increase - new positions entered the market (both longs and shorts!)
- OI Decrease - positions exited the market (both longs and shorts!)
- OI Flat - no change in open positions due to low activity or simply lots of transfers of contracts
However, different concepts can be used to analyze sentiment, aggressiveness, and activity in the market by analyzing data such as Open Interest, price, volume, etc. This indicator combines Open Interest data and price action to simplify the visualization of positions entering and exiting the market. It is based on the following concept:
Increase in Open Interest + Increase in price = Longs Opening
Decrease in Open Interest + Decrease in price = Longs Closing
Increase in Open Interest + Decrease in price = Shorts Opening
Decrease in Open Interest + Increase in price = Shorts Closing
When "Longs Opening" occurs, the OI Delta value is added to the running total of Net Longs, and when "Longs Closing" occurs, the OI Delta value is subtracted from the running total of Net Longs.
When "Shorts Opening" occurs, the OI Delta value is added to the running total of Net Shorts, and when "Shorts Closing" occurs, the OI Delta value is subtracted from the running total of Net Shorts.
To summarize:
Net Longs: Cumulative value of Longs Opening and Longs Closing (LO - LC)
Net Shorts: Cumulative value of Shorts Opening and Shorts Closing (SO - SC)
Net Delta: Net Longs - Net Shorts
Net Ratio: Net Longs / Net Shorts
This is the fundamental logic of how this script functions, but it also includes several other tools and options. Here is an overview of the settings:
Type:
- Net Positions (display values of Net Longs, Net Shorts, Net Delta, Net Ratio as described above)
- Relative Strength (display Net Longs, Net Shorts, Net Delta, Net Ratio in the form of a momentum oscillator that measures the speed and change of movements. Same logic as RSI for price)
Display as:
- Candles (display the data in the form of candlesticks)
- Lines (display the data in the form of candlesticks)
- Columns (display the data in the form of columns)
Cumulation:
- Visible Range (data is cumulated from the first visible bar on your chart)
- Full Data (data is cumulated from the beginning)
Quoted in:
- Base Currency (all data is presented in the pair’s base currency eg. BTC)
- Quote Currency (all data is presented in the pair’s quote currency eg USDT)
OI Sources
- Pick the sources from where the data is collected (if available).
Net Positions:
- NET LONGS (show/hide Net Longs plot, choose candle colors, choose line color)
- NET SHORTS (show/hide Net Shorts plot, choose candle colors, choose line color)
- NET DELTA (show/hide Net Delta plot, choose candle colors, choose line color)
- NET RATIO (show/hide Net Ratio plot, choose candle colors, choose line color)
Moving Averages:
- Type (choose between EMA and Volume Weighted Moving Average)
- NET LONGS (show/hide NL moving average plot, choose length, choose color)
- NET SHORTS (show/hide NS moving average plot, choose length, choose color)
- NET DELTA (show/hide ND moving average plot, choose length, choose color)
- NET RATIO (show/hide NR moving average plot, choose length, choose color)
Profile:
- Profile Data (choose the source data of the profile)
- Value Area % (set the percentage width of profile’s value area)
- Positions (set the position of the profile to left or right of the visible range)
- Node Size (set the relative size of nodes to make them appear smaller or larger)
- Rows (select the amount of rows displayed by the profile to control granularity)
- POC (show/hide POC- Point Of Control and select its color)
- VA (show/hide VA- Value Area and select its color)
Divergence finder
- Source (choose the source data used by the script to compare it with price pivot points)
- Maximum distance (the maximum distance between two divergent pivot points)
- Lookback Bars Left (the number of bars to the left of the current bar that the function will consider when looking for a pivot point)
- Lookback Bars Right (the number of bars to the right of the current bar that the function will consider when looking for a pivot point)
Stats:
- Show/Hide the Stats table
- Bars Back (choose the length of data analyzed for stats in number of bars)
- Position (choose the position of the Stats table)
- Select Data you want to display in the Stats table
Additional Settings:
- Volume Heatmap (show/hide volume heatmap and select its color)
- Label Offset (select how much the plot label is shifted to the right
- Position Relative Strength Length (select the length used in the calculation)
- Value Label (show/hide OI Delta values when candles are displayed)
- Plot Labels (show/hide the labels next to the plot)
- Wicks (show/hide wick when candles are displayed)
Code used for generating profiles is taken from @KioseffTrading's "Profile Any Indicator" script (used with author's permission)

Crypto Longs & Shorts (Multi Exchange) - InFinitoThis indicator uses data provided by different crypto derivative exchanges to estimate and display the potential Longs and Shorts opened and closed during a determined period. The indicator supports multiple exchanges and coins.
Knowing the the behavior of traders as in how they're positioning can be useful for different things like:
Get a sense of market sentiment
Better anticipating which way liquidity/stop hunts might potentially go.
All data is calculated based off OI data provided by exchanges except for Bitfinex which provides both Longs and Shorts opened and closed
Preset exchanges included are:
Bitfinex
Binance: USDT, USDPERP & BUSD pairs
Bitmex: USDT & USD pairs
Kraken
The indicator is preset to work with BTC but it can be easily changed to any coin by typing it's name (Capitalized) in the Coin Name box

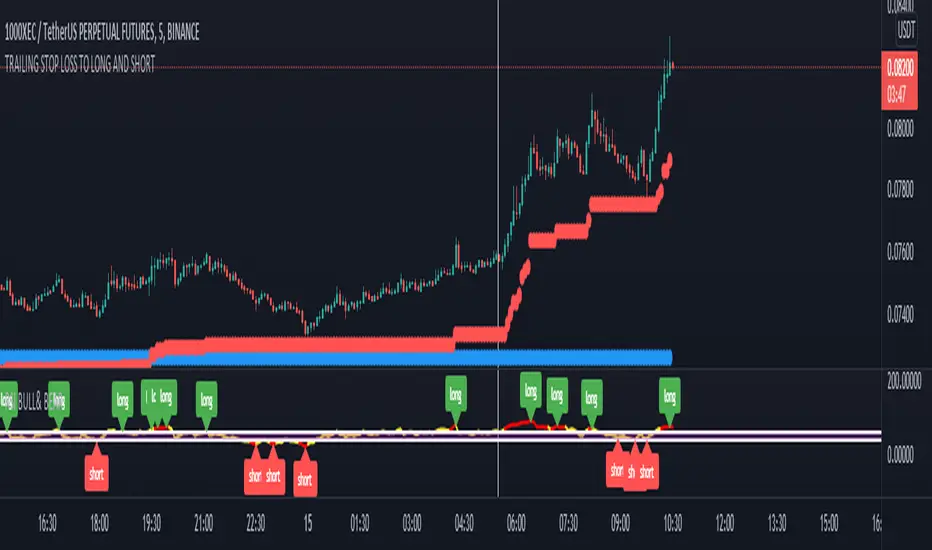
TRAILING STOP LOSS TO LONG AND SHORT LONG AND SHORT ( with stop loss) LONG AND SHORT ( with stop loss) LONG AND SHORT ( with stop loss)
WhaleCrew Long/Short Ratio (Bitfinex)Shows the long/short ratio (amount of longs per short) on ANY Bitfinex pair (BTCUSD, ETHUSD, ADAUSD, ...).


BKN: Hickory Smoked StrategyThis strategy is to be used with the BKN: Hickory Smoked Indicator. This is a strategy that thrives in trending environments. We've included settings for crypto and forex and lower speed options for lower timeframes.
The script offers a stop loss or trailing stop loss that will trigger when an entry is triggered. You can also choose to use it as long or short only. Pictured is the LONG only settings.
You can use this strategy to backtest settings for the indicator.
***IMPORTANT***
For access, please do not comment below. Instead, send a DM here on TradingView or on my linked Twitter account.

Bitfinex BTC Open InterestBitfinex open interest, or bitcoin open interest chart, shows the amount of open positions currently on Bitfinex BTC / USD trading pairs. Usually when open interest reaches unusually high numbers we'll see an increased volatility in Bitcoin's price. The open interest chart could also be useful for determining the tops and bottoms for Bitcoin.

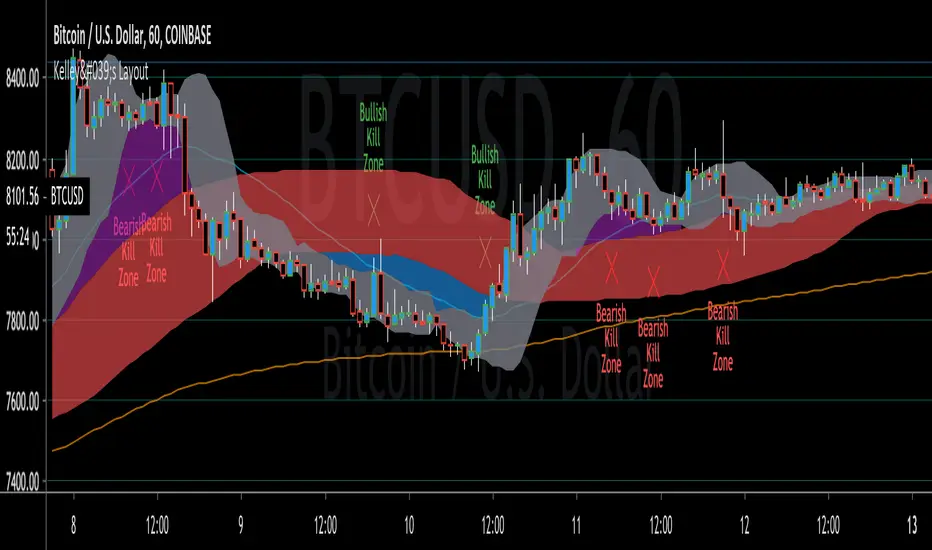
Kelley's LayoutWe use our own proprietary script with a collection of technical indicators that show support and resistance levels as well as momentum and trend direction. The Kelley’s Layout took over 2 years to prefect the formula that allows us to scalp the market in a safe conservative manner. However we do use Moving Averages, Moving Average Convergence Divergence ( MACD ), Simple Moving Average , Golden Ratio, Fibonacci Retracement , Relative Strength Index , and Gann Fan and Square as filters. Using these many filters is the reason why it took us over 2 years to prefect.
1 ~ Simple Moving Average
2 ~ Weighted Moving Average
3~ Convergent Divergent Alpha (Slow)
4~ Convergent Divergent Omega (Fast)
5 ~ Kelley’s Layout Proprietary Bearish Kill Zone
6 ~ Kelley’s Layout Proprietary Bullish Kill Zone
Bitfinex Long/Short Delta (Longs - Shorts)Bitfinex Long/Short Delta (Longs - Shorts)
Longs = Green
Shorts = Red
Delta = Yellow
