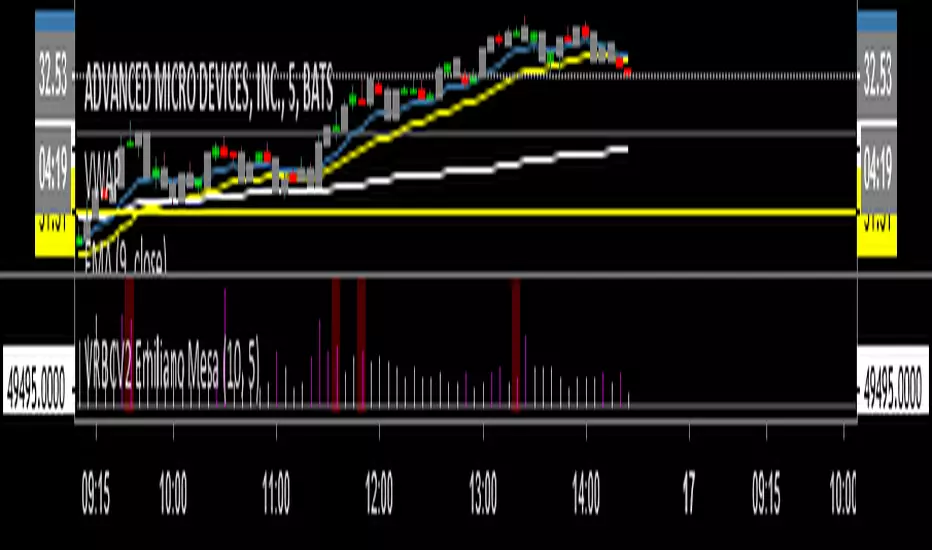
Emiliano Mesa Moving AverageThe Emiliano Mesa Moving average is a completely custom moving average based on support and resistance levels calculated through several variables in any timeframe. The Emiliano Mesa Moving Average, or EMMA works as any simple moving average, however it does involve support and resistance levels which can be turned on and used to show where the price is likely to reverse, or how much strength the trend has in order to keep going above or below it.
Furthermore, the EMMA indicator as most moving averages won't seem to work properly on range markets. However, you can in fact avoid entering a range market by turning on Support and Resistance 1 in the settings. When the price is inside the support and resistance 1 moving averages you can tell the price may have a difficult time trying to get out, indicating the trend is not as strong and we may be stuck for a while...
Along the same lines, I've noticed that when the EMMA and its S/R 1 lines are very close together, the stock/commodity/crypto/pair/etc. is less likely to make a harsh move in the opposite direction of the trend.
Again this is only version one of my custom moving average... Please be sure to leave some positive feedback or general feedback!
Feel free to use it and tell me your experience!
Contact info:
emilianomesauribe2000@live.com
Mesa

MESA Phase [SHK]MESA Phase (By John Ehlers) is a cyclic indicator that predicts market short-term and mid-term movements. It would give you clear divergence signals or you can use it as a price reversal detection indicator.
Please share us any tricks or new useful methods that you determined by using this indicator.

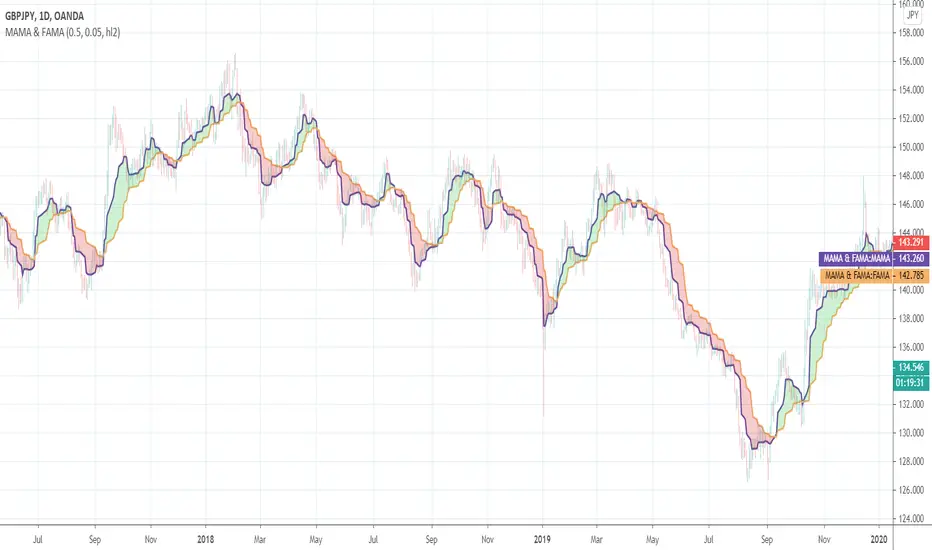
Ehlers MESA Adaptive Moving Averages (MAMA & FAMA)Ehlers MESA Adaptive Moving Averages (MAMA & FAMA) script.
These indicators was originally developed by John F. Ehlers (Stocks & Commodities V. 19:10: MESA Adaptive Moving Averages).
Manipulation IndicatorThis indicator is based on SMA, EMA, Volume, Price Action and more! All in order to find where the BIG BEARS & BIG BULLS are at! This big fishes are able to add huge ammounts of volume in the direction they want, and move the prices. Fact is this indicator shows if the big fish is either a bull or a bear, best entries, targets, exits, and more!
Trade with the trend, not against it
Emiliano Mesa Uribe
Inquires: emilianomesauribe2000@live.com
How it Works?
When the oscillator turns the background red a BIG BEAR has been found. When it turns Green a powerfull bull has been found, furthermore the blue histogram shows high ammount of volume.
The indicator has been tested on 5 min stocks. And with the default values.
Impulse Volume Emiliano Mesa OscillatorThe impulse volume overlay, is the 1st part of my 2 part volume impulse indicator. The indicator has the sole purpose of measurearing a signifcant increase in the volume of either sellers or buyers and with the the help of a signal line suggest when there is an impulse in any of them.
How it works:
Yellow == No impulse... Market will most probably follow the trend
Red == Market has a seller increase
Lime == Market has a buyer increase
I DO NOT TAKE RESPONSABLITY FOR LOSSES. USE INDICATOR UNDER YOUR OWN RISK

Important Gap Finder Emiliano Mesa 1H ONLYTells you to buy or sell a position, with huge accurancy and good profit. Binary option also set with the indicator.
You choose when to exit a position. Enter with arrows

Ultimate Bar Analysis Emiliano MesaMy most complex script as a gift to you @TradingView.
Simple price action analysis. Look at the chart and the indicator will do everything else for you. This indicator is based in a combination of several indicators, including ADX, EMA, and concepts by the book "Bar by Bar" by Al Brooks. You can use it any way you like.
Its been tested in 5 minute stock charts, anything else is not assured to work.
Key:
Yellow/Pink ===> Buyer / Seller pressure (Bears/Bulls are gaining momentum)
Green/Orange ===> Up Trend / Down Trend, this is based on ADX, change the values if you wish.
Red ===> High reversal chance, based on Al Brooks book.
Grey Bars ===> No man land. (No trend is taking place)
Hope you enjoy! Leave your feedback down below.
---------------------------------------------------------------------
Want your own indicator? Email me at : emilianomesauribe2000@live.com
Prices starting at 100$
Bar Trends & Reversals Emiliano MesaThe most advanced code made by me yet! Simple but extremely useful, based on "Reading Price Charts Bar by Bar" - Al Brooks. This indicator will highlight when the market is trending (green). Highlight reversal bars(red) and also bull/bear traps (yellow). I was not sure if to give away this indicator for free, but here it is.
Hopefully you guys enjoy it!
Interested in your own indicator? Email me here for business inquires : emilianomesauribe2000@live.com
(starting price 100$)
I DO NO TAKE RESPONSIBILITY FOR LOSSES. USE INDICATOR UNDER YOUR OWN MEANS
Odd Bars Emiliano MesaSimple code which will find and highlight big price movements in a small period of time. This price movements will usually have an opposite reaction of the same size.
Use this indicator under your own risk.
Emiliano Mesa
Anomaly Indicator V1.1 The Anomaly Indicator is an idea I recently come up with. Its very simple, yet it can be extremely useful. The Anomaly indicator detects the current and general trend channels. When the yellow line which is the current channel, exits the general channel this will usually mean an anomaly. Anomalies can vary within meaning, from a trend reversal, a market change (trending or rangebound) and lastly it can also give you an entering point. You can even use it to know the volatility of the market.
This is a very early version of the indicator and has pre-set values. I personally use it among a 5 minute chart for daytrading.
NOTE : Have in mind my indicator as ny other is not perfect, it might give fake signals. I suggest using Williams Alligator, and RSI with it. Best of luck. Follow my predictions under your own risk.

Ehlers MESA Adaptive Moving Average [LazyBear with ekoronin fix]Mama/Fama with ekronin's fix: www.tradingview.com

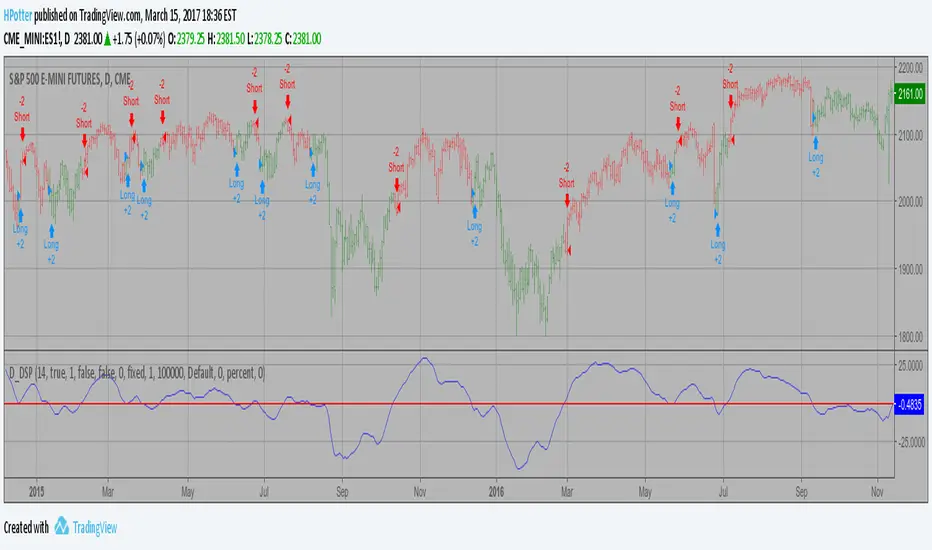
D_ELI (Ehlers Leading Indicator) Strategy Backtest This Indicator plots a single
Daily DSP (Detrended Synthetic Price) and a Daily ELI (Ehlers Leading
Indicator) using intraday data.
Detrended Synthetic Price is a function that is in phase with the dominant
cycle of real price data. This one is computed by subtracting a 3 pole Butterworth
filter from a 2 Pole Butterworth filter. Ehlers Leading Indicator gives an advanced
indication of a cyclic turning point. It is computed by subtracting the simple
moving average of the detrended synthetic price from the detrended synthetic price.
Buy and Sell signals arise when the ELI indicator crosses over or under the detrended
synthetic price.
See "MESA and Trading Market Cycles" by John Ehlers pages 64 - 70.
You can change long to short in the Input Settings
Please, use it only for learning or paper trading. Do not for real trading

D_DSP (Detrended Synthetic Price) Strategy 2 Backtest Detrended Synthetic Price is a function that is in phase with the
dominant cycle of real price data. This DSP is computed by subtracting
a half-cycle exponential moving average (EMA) from the quarter cycle
exponential moving average.
See "MESA and Trading Market Cycles" by John Ehlers pages 64 - 70.
You can change long to short in the Input Settings
Please, use it only for learning or paper trading. Do not for real trading.

D_DSP (Detrended Synthetic Price) Strategy 2 Detrended Synthetic Price is a function that is in phase with the
dominant cycle of real price data. This DSP is computed by subtracting
a half-cycle exponential moving average (EMA) from the quarter cycle
exponential moving average.
See "MESA and Trading Market Cycles" by John Ehlers pages 64 - 70.

D_DSP (Detrended Synthetic Price) Strategy Backtest Detrended Synthetic Price is a function that is in phase with the
dominant cycle of real price data. This DSP is computed by subtracting
a half-cycle exponential moving average (EMA) from the quarter cycle
exponential moving average.
See "MESA and Trading Market Cycles" by John Ehlers pages 64 - 70.
D_DSP (Detrended Synthetic Price) Strategy Detrended Synthetic Price is a function that is in phase with the
dominant cycle of real price data. This DSP is computed by subtracting
a half-cycle exponential moving average (EMA) from the quarter cycle
exponential moving average.
See "MESA and Trading Market Cycles" by John Ehlers pages 64 - 70.

Chaos 2.0This is pure chaos!
I just wanted 1 thing I can put on a chart to try to get a clearer picture of what is going on (and not take up all the indicator spaces a free user is allowed haha)
Many things going on from so many different users
honestly I'm sorry I cant shout out everyone whose code I have ever read and used in another project just for the sake of learning more about pinescript!
As a way of shouting everyone out! (and giving out my most useful and configurable system)
I give you... CHAOS
I originally got an Alligator, AO, and Fractal script from a user ChaosTrader, then realized I love using averages!
I added the MESA (lazybear?) and the McGinley Dynamic Range (sry idk) and a simple 233 SMA.
I also found about something called the www.prorealcode.com another user had created for Pinescript.
I really liked that script so I adapted it to do the same kind of signal printing for circles and squares (crosses and series)
Check it out tell me what you think and how I can make it better for everyone!
thanks all!
Snoop
