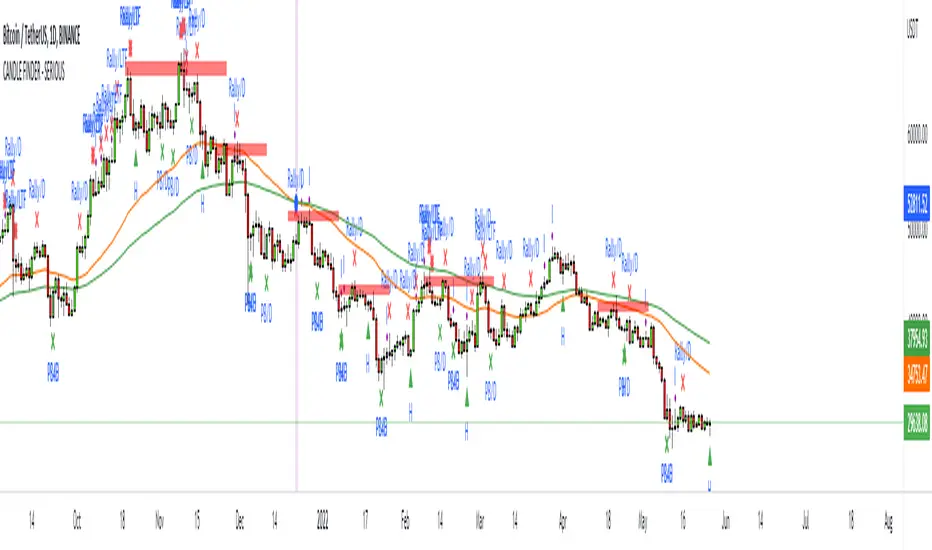
ULTIMATE CANDLESTICK FINDER (Pullback/Rallys/Hammers/Dojis) + MATodays scripts is based on my Pullback And Rally Candles with other meaningful candles such as Hammers and Dojis.
You can choose which Candles to show on the cart and if you want to candles to appear above or below a moving average.
If you follow my work, you may recognise some of these candles which I'm about to show you however these candles are 1) more refined and 2) has moving average filters.
Ive included a D,6H,1H Candle in this script as on different timeframes - each swing low on average has a different amount of bars within the swing low / swing high so the DPB and RD will only work on the Daily
//Pullback candle
This candle is very powerful when used with simple Price Action such as Market Structure//Demand zones and support zones. (((((WORKS BEST IN UPTRENDS AND BOTTOM OF RANGES)))))
Ive included a D,6H,1H Pullback Candle in this script as on different timeframes - each swing low on average has a different amount of bars within the swing low so the DPB will only work on the Daily
//DAILY PULLBACK (Swing Traders)
//4H PULLBACK (Swing Traders)
- this signal will produce more signals due to the swing low filter on the 4H
//1H PULLBACK
- this signal has been refined due to too many candle displaying in weak areas
!!!IF YOU DONT WANT TO USE PULLBACKS DURING DOWNTRENDS THEN USE THE EMA FILTER TO TURN OFF THE PULLBACKS WHEN PRICE IS BELOW THE MOVING AVERAGE!!!
//Rally candle (My personal Favourite) (((((WORKS BEST IN DOWNTRENDS AND TOP OF RANGES)))))
This candle is very powerful when used with simple Price Action such as Market Structure//Supply zones and Resistance zones.
//DAILY RALLY(Swing Traders)
//4H RALLY(Swing Traders)
- this signal will produce more signals due to the swing high filter on the 4H
!!!IF YOU DONT WANT TO USE RALLIES DURING UPTRENDSTHEN USE THE EMA FILTER TO TURN OFF THE RALLIES WHEN PRICE IS ABOVE THE MOVING AVERAGE!!!
//POWERFUL DOJIS (INDECISION)
We look for indecision in key areas to see if momentum is shifting. When combined with Pullbacks or Rallys - this will enhance the odds of a probably area.
//HAMMERS
//MOVING AVERAGES
Short EMA = 50
Long EMA = 200
This filter can be used when the market is trending - look out for rejections off the moving averages
Also you can chance the Short And Long EMA to choose which MA cross you want to use
ALSO ALL THE CANDLES HAVE A ALERT CONDITIONS WHICH YOU CAN ACCESS - THIS WILL ALERT ANY CANDLE YOU CHOOSE
Please leave a like/comment on this post as this is much appreciated....
Movingaveragecrossover
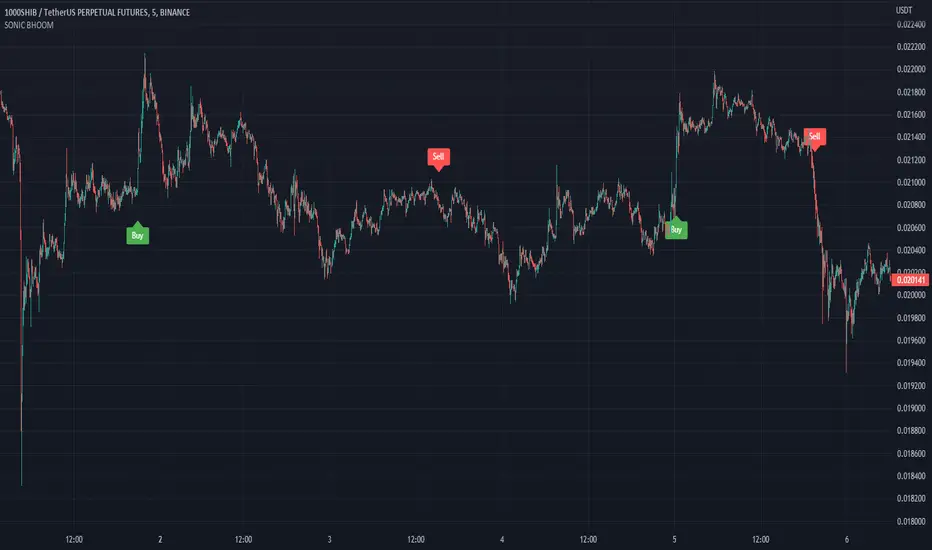
SONIC BHOOM👉 What is this indicator ?
This indicator is made up of Trend and Moving Average, The idea used in this indicator is to understand the current trend and take buy sell entry based on moving average
👉 How many alarms does this indicator have ?
This indicator has two types of alarm for buy signal and sell signal, and it is best to set the alarm by selecting the Alert Once Bar Close option to avoid repaint.
👉 On which coins can this indicator be used ?
This indicator is best used on all cryptocurrencies and forex markets, You can use this indicator with any Time Frame, and this indicator is set to the 1000SHIBUSDT Coin, 5min Time Frame by default. Use appropriate values when using other coins. If you have any difficulty in finding the Value, you can contact us.
Default Setup Instructions 👇
Duration: 5 Minute
Default Coin : 1000SHIBUSDT
The following settings can be found in this indicator
Trend Length :This is an average True change value, Average True Range (ATR) is the average of True ranges over the specified period. ATR measures volatility, taking into account any gaps in the price movement.
Trend High : This is the ATR Factor Value. You can change this value according to the volatility, the ATR Factor value is also used to reduce the chance of a fake signal
Threshold :
The Threshold is the difference between price and moving average. Changing the value of this option will change the accuracy of the trading signal
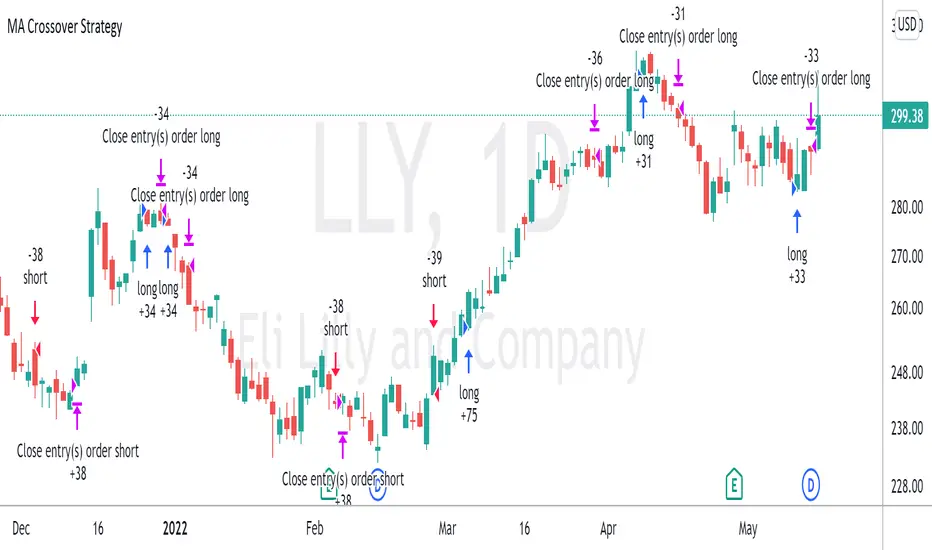
Moving Average Crossover StrategyThe Moving Average Crossover indicator uses 3 moving averages (2 simple moving averages and 1 exponential moving average ) to signal long and short opportunities based on moving average crossovers. This strategy serves as a backtest to that indicator. By taking entry and exit positions based on moving average crossovers, we are able to project profit with this script. You are given the option to select which moving average crossings trigger entry and exit signals. Fast refers to an EMA which should be your shortest MA. Slow refers to the first SMA which will serve as a signal line. Trend refers to a long SMA which will help determine if you should take long positions or short. You can also filter by extra conditions such as minimum volume or RSI. For example, you may have the script trigger a buy signal if the 5ema crosses the 20 sma while RSI reads 60 and sell if it crosses again.
This strategy starts with $100,000 and uses 10% of the account per trade.
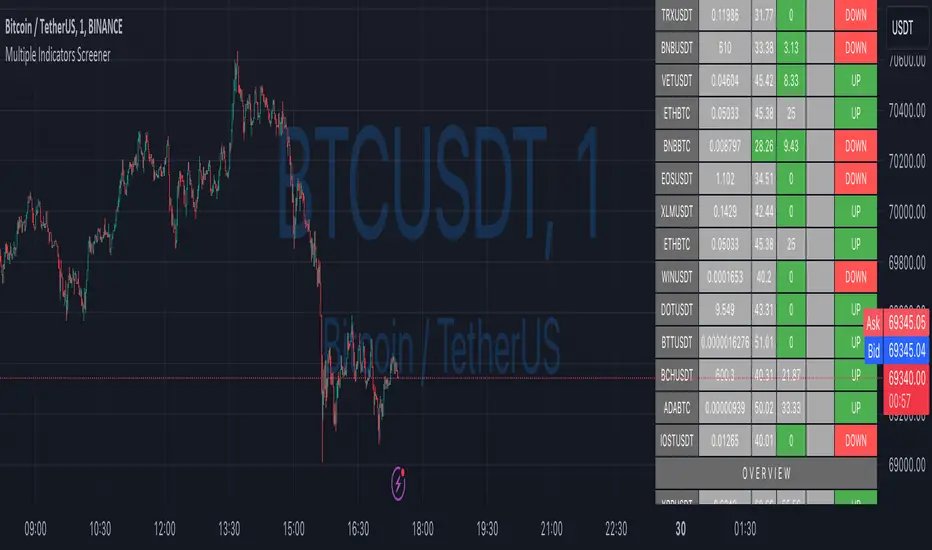
Ultimate Custom ScreenerThis indicator will allow you to make your custom TradingView screener without coding. Add it to the chart, select up to 40 symbols and five indicators, and the screener will do the rest for you. The indicator will form a lovely table with all values and highlighted signals.
The screener is highly customizable, and you can choose its position on the chart, sorting, order of the columns, colors for the tables, and all signals separately. You can easily change parameters for all supported indicators and their signals.
Currently, there are 19 different custom indicators available. Current list of indicators:
Average Directional Index (ADX) - displaying the value of ADX and checking if it's higher than the threshold
Average True Range (ATR) - showing the value of ATR
Awesome Oscillator (AO) - displaying the value of AO and highlighting positive/negative values.
Bollinger Bands (BB) - showing if the price is above/below/in the channel.
Breakout Pivots - Displaying when the price is below/above the most recent pivot low/high.
Commodity Channel Index (CCI) - shows the last CCI value and highlights overbought/oversold values.
Directional Movement Index (DMI) - Up/Down signal (+DI above or below -DI)
Donchian Channel (DC) - showing if the price is above/below/in the channel.
Historical Volatility (HV) - Current value of Historical Volatility
Keltner Channel (KC) - showing if the price is above/below/in the channel.
Moving Average Convergence Divergence (MACD) - Up/Down signal (MACD above / below signal)
Moving Average Crossover (MA Cross) - Displaying MA crosses signals (SMA, EMA, WMA, HMA, VWMA, SMMA, DEMA, VWAP supported)
Moving Average Distance (MA DIST) - Displaying distance to the MA (SMA, EMA, WMA, HMA, VWMA, SMMA, DEMA, VWAP supported)
Price - Displaying the last price for the instrument
Relative Strength Index (RSI) - Displaying the last RSI value and highlighting overbought/oversold values.
Stochastic (STOCH) - Displaying the last Stochastic value and highlighting overbought/oversold values.
Stochastic RSI (STOCH RSI) - Displaying the last Stochastic RSI value and highlighting overbought/oversold values.
SuperTrend - Current state of the SuperTrend.
True Strength Index (TSI) - Displaying the last TSI value and highlighting overbought/oversold values.
We're already working on adding a few more supported indicators. If you have any ideas about the indicators you want to see in our screener, contact us, and we'll consider them.
Disclaimer
Please remember that past performance may not be indicative of future results.
Due to various factors, including changing market conditions, the strategy may no longer perform as well as in historical backtesting.
This post and the script don’t provide any financial advice.
Best TradingView Strategy - For NASDAQ and DOW30 and other IndexThe script is totally based on momentum , volume and price. We have used :
1: Bollinger Band Squeezes to know when a breakout might happen.
2: Used Moving Averages(SMA and EMA) to know the direction.
3: The success Rate of this strategy is above 75% and if little price action is added it can easily surpass 90% success mark.
4: Do not worry about drawdowns , we have implemented trailing SL ,so you might see a little extra drawdown but in reality its pretty less.
5: I myself have tested this strategy for 41 days with a 250$ account and right now I have 2700$.

TWAP + MA crossover Strategy [Dynamic Signal Lab]Dear TV'ers,
Hereby the strategy script for the TWAP/moving average crossover, with unique taking profit options. moving averages include: EMA , WMA , DEMA , TEMA , VAR, WWMA, ZLEMA , TSF , HULL and TILL.
Use the TWAP as the slow moving average and use another moving average as the faster/more responsive moving average. Finally, you can use a green fill to visualize how much you are in profit from your entry point.
Good strategies always involve gradual taking profit, which is also possible in this script.
You can gradually take profit (and set how much%), using the following criteria:
* minimum consecutive green/red candles
* minimum amount of green/red candles in the last 2-8 candles
* both of the above criteria.
The current default properties should be modified to make this strategy cost-effective, but typically 15minutes and higher timeframes (up to 6hr) seem to work well for larger (top10 cap) crypto projects. Don't use this script for small-caps as it will get you rekt.
Additionally, you'll also be able to continuously take profit, making sure you lock in all those sweet profits. Use this script for backtesting and the indicator compagnon to fire your alerts.

Moving Average Macro Trend FilterA simple indicator that adds a background fill to your chart based on a fast and slow moving average.
When the fast moving average is above the slow moving average, the background is green.
When the slow moving average is above the fast moving average, the background is red.
If the fast and slow moving average don't agree on direction, the background is yellow.
Pick between EMA, SMA, RMA, WMA
Select different timeframes for chart, slow MA, and fast MA

Dynamic length MA Strategy [Dynamic Signal Lab]Dear TV'ers,
Hereby the strategy for the dynamic moving average crossover, with some flexible taking profit options.
All moving averages have the option to dynamically change lengths and different source options. They include:
* Hull MA
* volume-weighted Hull MA
* Simple MA
* Money Flow Index
* Chande Momentum Oscilator
* Arnaud Legoux MA
* Weighted MA
* Linear regression
What makes this strategy special is the fact that you can dynamically shorten the length of moving average length depending on how much you are in profit. The more you are in profit, the shorter the length of the MA will become.
The current default properties should be modified to make this strategy cost-effective, but typically 30minutes and higher timeframes seem to work well for larger (top10 cap) crypto projects. Dont use this script for small-caps as it will get you rekt.
Additionally, you'll also be able to continuously take profit, making sure you lock in all those sweet profits.
Use this script for doing backtesting and the indicator compagnon to fire your alerts.

Responsive Magnetic Moving Average - BreatEasyTraders,
It's pretty difficult to judge which moving average is holding the price at present (Holding = Prices Respecting the moving average). some times prices respects 20 MA, 50MA or some other MA or EMA or HMA. Its dynamic in nature and changes based on the script we apply and the timeframe we use.
Having all these different types of moving averages added on to chart may sometime create a clutter. Hence I came up with an idea to summarize into one value which price is respecting.
Important options provided to help adjusting the strength value.
1. No Of Candles = set the number of candles to analyze for the strength. Note: setting the value too less will improve the performance but accuracy is depleted. setting the value to too high may improve accuracy but performance may be depleted.
Performance = calculation time.
2. Close By% = in order to check whether price is respecting the trendline set the % of ATR. This means that when prices are close to any of the moving averages then it checks for the strength of the moving average.
Plz do suggest for any feedback for improvements.
Regards

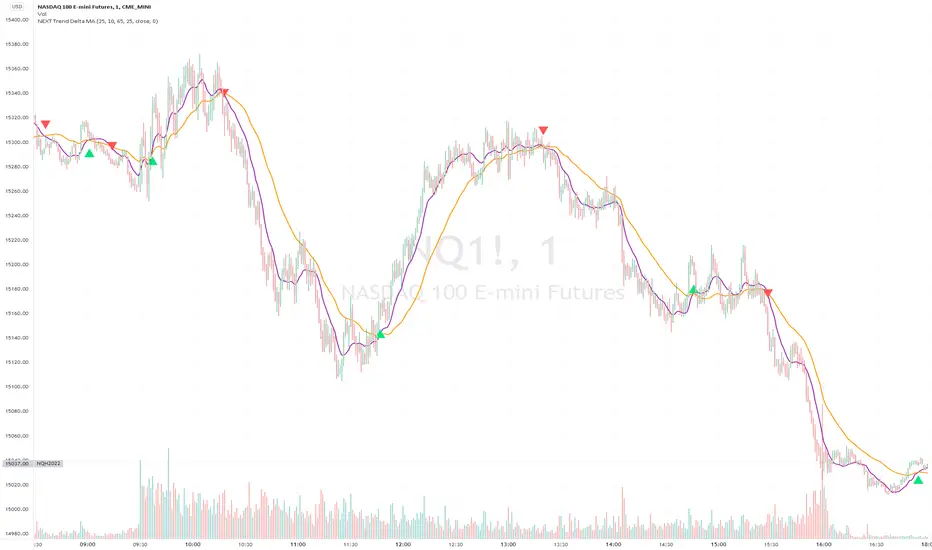
NEXT Trend Delta Moving AverageOverview:
Trend Delta Moving Average (TDMA) is a composite moving average, driven by an algorithm that tracks real-time trends in price, volume, and various changes (delta) between the two. TDMA is low lagging but filtered (smoothed) MA type, with a sometimes predictive slope (via price divergence). This indicator allows you to plot one or two TDMA lines, as well as their crossovers, expressed in the form of long/short signals.
NASDAQ 100 Futures ( CME_MINI:NQ1! ) 1-minute
This Nasdaq futures example shows both TDMA lines and their crossover signals.
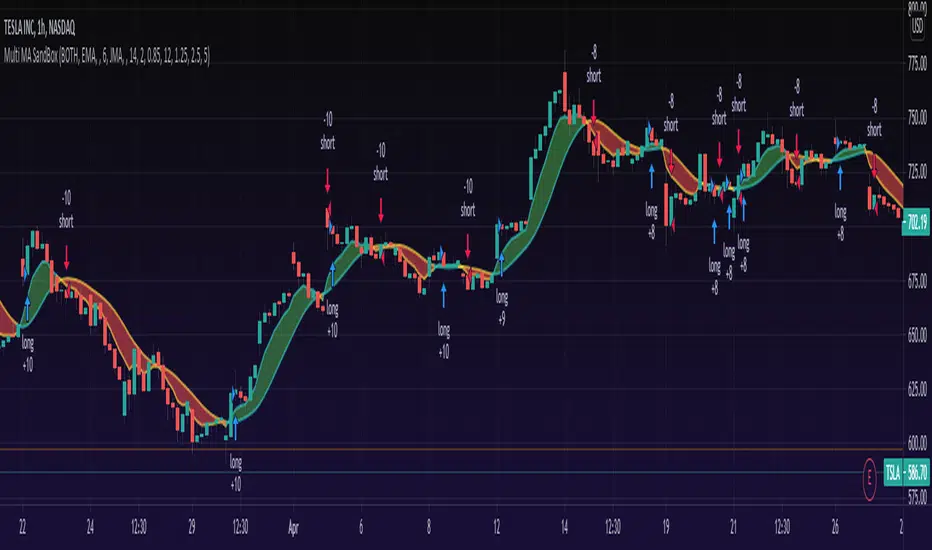
Tesla ( NASDAQ:TSLA ) 1-minute
If you trade price / MA crossovers or use moving averages as part of a broader trading system, you have the option of displaying a single TDMA line without any crossover signals (arrows) by ticking Plot TDMA1 Only checkbox and unticking Plot TDMA Crossovers . Great for breakout stocks like TSLA.
TDMA vs Other Moving Averages
We spent a good amount of effort developing and differentiating Trend Delta Moving Average (TDMA) from other moving averages. We wanted a responsive MA algo that considered price and action, and that incoporated user-controlled lagless filtering (smoothing). Below is a comparison between TDMA (purple) and several popular MA types, including Exponential (blue), Simple (red), and Hull (teal). All MA lengths set to 50.
Lagless Smoothing
You may use the Trendiness input parameter to control the amount of smoothing applied to individual or both TDMA lines. Lower values (emphasis on more recent trends) produce vertically tighter slopes, with TDMA following price action more closely, while higher values (emphasis on more longer term trends) relax the slope, without introducing horizontal (time) lag.
Input Parameters:
Length TDMA1 - length of the first Trend Delta Moving Average (TDMA)
Length TDMA2 - length of the second TDMA
Trendiness TDMA1 - the amount of trend weighting added to the first TDMA line (lower = more recent trend, higher = longer term trend)
Trendiness TDMA2 - the amount of trend weighting added to the second TDMA line (lower = more recent trend, higher = longer term trend)
Source - data used for calculating the MAs, typically Close, but can be used with other price formats and data sources as well.
Offset - shifting of the TDMA lines forward (+) or backward (-).
Plot TDMA1 Only - when checked, will only plot a single TDMA line (TDMA1)
Plot TDMA Crossovers - when checked, will plot an up arrow (long signal) when TDMA1 crosses over TDMA2, and a down arrow (short signal) when TDMA1 crosses under TDMA2.
Alerts
Here is how to set price crossing TDMA1 (or TDMA2) alerts: open a TradingView chart, attach NEXT Trend Delta Moving Average (TDMA), right-click on chart -> Add Alert. Condition: Symbol (e.g. NQ) >> Crossing >> NEXT Trend Delta Moving Average (TDMA) >> TDMA1 >> Once Per Bar Close.
Moving Average Multitool CrossoverAs per request, this is a moving average crossover version of my original moving average multitool script .
It allows you to easily access and switch between different types of moving averages, without having to continuously add and remove different moving averages from your chart. This should make backtesting moving average crossovers much, much more easier. It also has the option to show buy and sell signals for the crossovers of the chosen moving averages.
It contains the following moving averages:
Exponential Moving Average (EMA)
Simple Moving Average (SMA)
Weighted Moving Average (WMA)
Double Exponential Moving Average (DEMA)
Triple Exponential Moving Average (TEMA)
Triangular Moving Average (TMA)
Volume-Weighted Moving Average (VWMA)
Smoothed Moving Average (SMMA)
Hull Moving Average (HMA)
Least Squares Moving Average (LSMA)
Kijun-Sen line from the Ichimoku Kinko-Hyo system (Kijun)
McGinley Dynamic (MD)
Rolling Moving Average (RMA)
Jurik Moving Average (JMA)
Arnaud Legoux Moving Average (ALMA)
Vector Autoregression Moving Average (VAR)
Welles Wilder Moving Average (WWMA)
Sine Weighted Moving Average (SWMA)
Leo Moving Average (LMA)
Variable Index Dynamic Average (VIDYA)
Fractal Adaptive Moving Average (FRAMA)
Variable Moving Average (VAR)
Geometric Mean Moving Average (GMMA)
Corrective Moving Average (CMA)
Moving Median (MM)
Quick Moving Average (QMA)
Kaufman's Adaptive Moving Average (KAMA)
Volatility-Adjusted Moving Average (VAMA)
Modular Filter (MF)

Martyv Technical Analysis KitThis indicator is being developed as a tool hopefully suited to both the beginner/amateur/hobbyist and possibly also the professional analyst/trader. The idea is that it would be a tool that can give you an instant ‘overview’ of a few different schools of measurement on any measurable asset. Makes for great training wheels or a primer for further analysis.
Out of the box settings will give you an AutoFib for the most recent low and high (with extension targets), a pair of commonly-used moving averages (50 SMA and 200 SMA), RSI (and/or many other) divergences on the chart, and candles colored according to current trend (Blue = Bullish Control, Purple = Neutral/Coasting, Red = Bearish Control) and intensity according to volume (Darker = High Volume/Increasing, Lighter = Low Volume/Decreasing). For more advanced traders/analysts, almost all settings can be customized, with multiple options and additional features.
*There are a lot of settings. Shrug. Wink. I tried to bundle them together, however there are a few that I use quite often and placed them at the top for easy access. If you have any suggestions as to what's super useful in the top area, lmk. Happy trading! -E
AutoFib
-Places an AutoFib for the most recent low and high (with extension targets)
-You can choose to "contain price action" inside a 0-1 fib retrace, or allow extension targets to automatically be used (potentially useful within Harmonic Trading among other things)
-Uses the Fast/Medium/Slow (Default) global inputs for fib lookback period (Defaults to 8/21/34 at the time of this writing, can be changed in settings)
-Customizable fib levels, colors, and styles
-Can choose between AutoFib with manually defined levels or SmartFib with levels automatically calculated, including extensions as needed
--Choose between only using the most recent confirmed fib retrace, or the currently developing (non-confirmed) fib retrace - this will also contain price action within a 0-1 fib
--Adds fib extensions as needed, you can define extension levels
-Can change the lookback period and turn the visible Zig Zag and/or AutoFib on/off
-Can turn Logarithmic on/off in settings
Divergence
-Can identify and mark divergences (regular and hidden) for MACD, MACD Histogram, RSI (Default), Stochastic (Default), CCI, Momentum, OBV, Diosc, VWmacd, and Chaikin Money Flow
-Can turn divergences on/off individually
-Can choose to show hidden divergence
-Uses the Fast/Medium/Slow global inputs (Defaults to 8/21/34 at the time of this writing, can be changed in settings)
Trend Channels
-Uses a Zig-Zag with a specified lookback period (can be changed in settings)
-Setting AutoFIb to a different lookback than Trend Channels yields interesting results imo
-Can turn channels on/off
-Can change the lookback period and turn the Zig Zag and/or Channels on/off
Trend Ribbon
-Uses the John F. Ehlers Supersmooth method on a specified lookback period (Default 14)
-Checks the current price action against the lookback period trend and if the Supersmooth signal aligns with the trend direction, it gives a strong signal (Bull/Bear). A continuation signal (Neutral) is given if these two don’t match, and often indicates trend continuation or trend reversal.
-Can turn supersmooth and/or matching bar repaint on/off
-Can choose between Bull/Bear/Neutral signals and only Bull/Bear signals
-Alerts available for Bullish or Bearish change
-Can choose current timeframe or any timeframe
Bar Repaint
-Candles colored according to current trend (Blue = Bullish Control, Purple = Neutral/Coasting, Red = Bearish Control) and intensity according to volume (Darker = High Volume/Increasing, Lighter = Low Volume/Decreasing). You can set candle color to reflect: Open/Close, Trend (Default), or an RSI Gradient. You can set candle intensity to reflect: Volume (Default), Momentum, RSI, or ADX.
Price Tag
-Price tag that sits neatly between the candles and the fib labels. You can turn this on or off.

DC Breakout Strategy | This is simplicity at its finest.As the title already describes: this is a Donchian breakout strategy. This strategy, as of now, only goes long. It goes long when the price close makes a new high and the 8 day moving average is above the 32 day moving average. The strategy exits the trade if the price breaks the atr trailing stop of * 3 or the 8 day moving average crosses below the 32 day moving average.
This is simplicity at its finest.

+ ALMA Trend DetectorHi, again. Here I have a nice moving average script designed to get you into trends and keep you in trends until the opportune moment comes to exit. And, as with any indicator, or suite of indicators, designed to get one into trends and keep him/her in a trend, they do not do so well in chop/ranging/mean reversion conditions, though I would say this one is better than most, otherwise I wouldn’t be fitting it into my trading system.
This is a huge improvement, in my opinion, over an indicator I found recently, and like quite a bit by samsmilesam, which you can find here: www.tradingview.com
In this adaptation of his script I changed a bunch of things, but kept the spirit of the indicator true.
This indicator utilizes three different length Arnaud Legoux moving averages, known for being extremely low lag, and incredibly adjustable (though I find the original authors settings excellent).
While he has buy and sell signals triggering regardless of the fast and slow ma’s position to the trending ma, I actually take the trending ma into account. Furthermore, I wouldn’t say I coded in signals indicating buying and selling, but that I coded in signs that answer the question “what kind of trend are we in?” as well as possible ideal trade exits (which couuuuuld also be taken as entries, but aren’t necessarily meant to).
So, the deets on this:
1) 5 period, 20 period, and 70 period ALMAs. Fast, slow and trend. All customizable independent of each other (unlike the sam’s). All three also change color based on their own individual trends.
2) Uptrends are identified when price is closing above the Trend ma, and both Fast and Slow ma’s are above the Trend ma, and vice versa for downtrends. There are in-between points when a trend is not identified, and this is when price closes above or below the Trend ma, but the other two ma’s have not crossed it. Background color is used to identify the trend.
3) Trade exits are based on closing price and Fast and Slow ma’s relative to the Trend ma, once again. To signal exiting an uptrend price must close below both Fast and Slow ma’s and both Fast and Slow ma’s must be above the Trend ma; and vice versa for exiting a down trend. Obviously there may be false signals, but there are fewer signals, and I think it’s a better strategy than most. I prefer to filter out as much noise as possible. There’s little worse in my opinion than an indicator that gives too many false signals, but obviously it’s impossible to remove them all. Some discretion is necessary on the part of the trader.
4) So what does this mean for trade entries? Well, you can certainly enter a trade on a signal for an exit (go long on a short exit signal) if the chart looks good for that. Or you can wait for trend confirmation with the background color, entering on a pullback to the ma’s perhaps. Or you can enter in the “no man’s land” in between trends. If you’ve exited and price continues on trending your best bet would be to wait for a pullback into the ma’s or a s/r level, or look for the next candle that closes beyond the Fast and Slow ma’s. These are just thoughts of mine.
5) Lastly, there are alert conditions set for uptrends, downtrends and both long and short exits!
Enjoy the indicator! I think with some sort of bands or channels for those times when the market is rangebound or in chop, you could really crush it with this.

Trendsurfer - A new type of moving average algorithmUsing a new type of lag reducing moving average algorithm, this indicator adapts it's sensitivity based on the strength of the trend and the volatility of the asset.
In doing so, signals can be given extremely fast during favorable market conditions. False signals can still appear, so visual confirmation/judgement is required before taking a trade.
The indicator:
Trend Bias Moving average . Thick green and orange line shows us trend bias.
- If the moving average is green, then the average price level is above the moving average = overall bullish conditions.
- As the moving average draws closer to price, or is straight, conditions are changing
- If the moving average is orange, then the average price level is below the moving average = overall bearish conditions.
Dual lag reduced instantaneous moving average.
This moving average is adaptive and fast, and will give buy and sell signals on crossover with price (EMA 6).
Buy and sell signals are shown visually using up and down arrow.
IMPORTANT: To filter out false signals, check other MA's like the 50 period hull moving average (dotted plot) for visual confirmation.
Furthermore, Significant support and resistance levels can be found on the right, shown as dotted horizontal lines. The importance of these levels is calculated based on the strength of the support/rejection, the volume, and the amount of times resistance and support was tested.
The location of the nearest moving averages below and above is also included as further potential support and resistance.
What to watch out for a good entry
- Watch for price to break out of the gray zone, and/or successfully retest it for a great entry.
Make your own decisions and never solely rely on a tool that should only be giving you an "indication".
Happy Trading,
MM

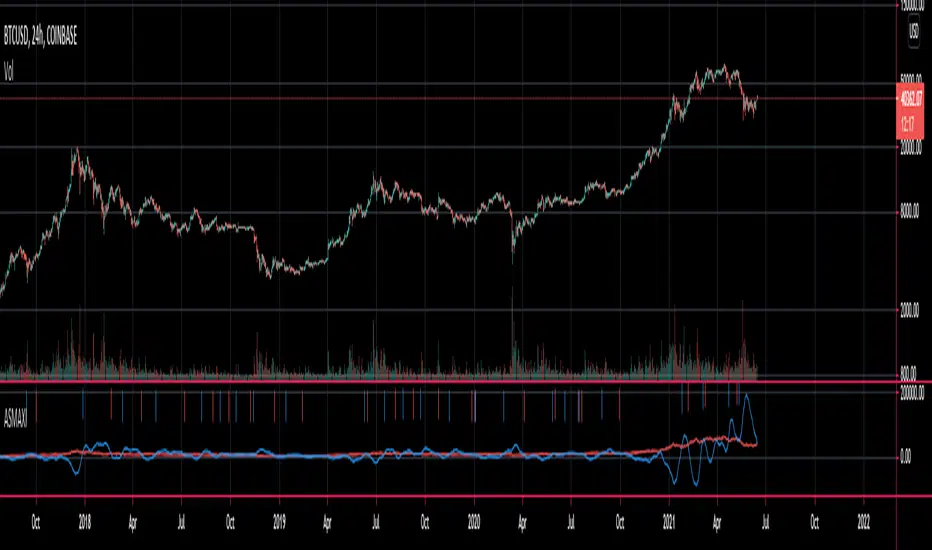
Relative strength DivergenceThe following indicator uses relative comparison of two assets by the formula n/s3, where n is the t asset on the screen while s3 the underlying assets it is being compared to. The usefulness of the indicator is to primarily compare the assets being traded like BTC (most prominent crypto with largest market cap), with some other crypto like TRX(this has a relatively smaller market cap). Since we get a broader market view through relative comparison of the two assets, the most important function is to find the edge through divergences. Just like RSI the divergences rules would be the same and most important trades would be trades in the direction of the trend along accompanies by divergences that are in line with the trend. Simple divergences work for the best trades with default settings. Although BTCUSD is the default asset to compare with it can be switched with any other asset as well, but it is very much preferred that one uses some type of index as the base asset for comparison. Other than that for simple trading the trend MA crossover can also be used as a signal for simple trend following.

Multiple Time Frames Moving Averages (x3)This indicator is a set of 3 moving averages for which you can configure the type of the moving averages , their length , and of course the time frame . The moving averages you can choose from are:
- Simple Moving Average ( SMA )
- Exponential Moving Average ( EMA )
- Weighted Moving Average ( WMA )
- Running Moving Average (RMA)
- Hull Moving Average ( HMA )
- Volume Weighted Moving Average ( VWMA )
- Arnaud Legoux Moving Average ( ALMA )
The time-frames you can choose from - minutes (1, 3, 5, 15, 45), hours (1, 2, 3, 4, 12), days (1, 3), weekly or monthly .
Overall, it is a minimalistic indicator. No major improvements or trading logic like some of my other indicators, but I did make it slightly easier to use and visually appealing. The MAs' colors change from light to dark green/blue/red depending on the trend - bullish or bearish respectively. Initially, those were changing from green to red (based on direction) but it became a bit confusing when they started crossing each other. Anyway, feel free to change those colors to whatever you like.
If you have suggestions on how to improve this indicator or ideas about new ones, please drop me a line. Thanks.

Multi MA MTF SandBox StrategyA moving averages SandBox strategy where you can experiment using two different moving averages (like KAMA, ALMA, HMA, JMA, VAMA and more) on different time frames to generate BUY and SELL signals, when they cross.
Great sandbox for experimenting with different moving averages and different time frames.
== How to use ==
We select two types of moving averages on two different time frames (or the same time frame):
First is the FAST moving average that should be at the same time frame or higher.
Second is the SLOW moving average that should be on the same time frame or higher.
== Buy and Sell Signals ==
When FAST moving average cross over the SLOW moving average we have a BUY signal (for LONG)
When FAST moving average cross under the SLOW moving average we have a SELL signal (for SHORT)
WARNING: Using a lower time frame than your chart time frame will result in unrealistic results in your backtesting and bar replay.
== NOTES ==
You can select BOTH, LONG, SHORT or NONE in the strategy settings.
You can also enable Stop Loss and Take Profit.
More sandboxes to come, Follow to get notified.
Like if you like and Enjoy!
Can also act as indicator by setting 'What trades should be taken' to 'NONE':
Anticipated Simple Moving Average Crossover IndicatorIntroducing the Anticipated Simple Moving Average Crossover Indicator
This is my Pinescript implementation of the Anticipated Simple Moving Average Crossover Indicator
Much respect to the original creator of this idea Dimitris Tsokakis
This indicator removes one bar of lag from simple moving average crossover signals with a high degree of accuracy to give a slight but very real edge.
Moving Averages
A moving average simplifies price data by smoothing it out by averaging closing prices and creating one flowing line which makes seeing the trend easier.
Moving averages can work well in strong trending conditions, but poorly in choppy or ranging conditions.
Adjusting the time frame can remedy this problem temporarily, although at some point, these issues are likely to occur regardless of the time frame chosen for the moving average(s).
While Exponential moving averages react quicker to price changes than simple moving averages. In some cases, this may be good, and in others, it may cause false signals.
Moving averages with a shorter look back period (20 days, for example) will also respond quicker to price changes than an average with a longer look back period (200 days).
Trading Strategies — Moving Average Crossovers
Moving average crossovers are a popular strategy for both entries and exits. MAs can also highlight areas of potential support or resistance.
The first type is a price crossover, which is when the price crosses above or below a moving average to signal a potential change in trend.
Another strategy is to apply two moving averages to a chart: one longer and one shorter.
When the shorter-term MA crosses above the longer-term MA, it's a buy signal, as it indicates that the trend is shifting up. This is known as a "golden cross."
Meanwhile, when the shorter-term MA crosses below the longer-term MA, it's a sell signal, as it indicates that the trend is shifting down. This is known as a "dead/death cross."
MA and MA Cross Strategy Disadvantages
Moving averages are calculated based on historical data, and while this may appear predictive nothing about the calculation is predictive in nature.
Moving averages are always based on historical data and simply show the average price over a certain time period.
Therefore, results using moving averages can be quite random.
At times, the market seems to respect MA support/resistance and trade signals, and at other times, it shows these indicators no respect.
One major problem is that, if the price action becomes choppy, the price may swing back and forth, generating multiple trend reversal or trade signals.
When this occurs, it's best to step aside or utilize another indicator to help clarify the trend.
The same thing can occur with MA crossovers when the MAs get "tangled up" for a period of time during periods of consolidation, triggering multiple losing trades.
Ensure you use a robust risk management system to avoid getting "Chopped Up" or "Whip Sawed" during these periods.
Trend Indicator for Directional Trading (main)TIDT is a two-part trend-based indicator that aims to recognize the general direction and help you identify good opportunities for going long or short. This is the main indicator that is plotted on the chart and is comprised of 3 Moving Averages over which you have full control. You can choose between the following 7 types:
- Simple Moving Average (SMA)
- Exponential Moving Average (EMA)
- Weighted Moving Average (WMA)
- Running Moving Average (RMA)
- Hull Moving Average (HMA)
- Volume Weighted Moving Average (VWMA)
- Arnaud Legoux Moving Average (ALMA)
For clarity of the trend whenever a fast MA crosses up or down a slower MA, the slower one changes its color. The faster MA changes color based on its direction.
Depending on your MA preferences and their period, you generate two main signal types:
1) Moving Average Bounce Signals - You will get a signal whenever the price bounces off, nearly touches or pierces your first MA (depending on your settings as described below)
2) Pullback / Retracement Signals - You will get a signal whenever a trend is established and the price retraces, thus giving you an optimal entry.
I've included 3 additional settings that you can tweak in order to reduce the noise or get more signals, all depending on your risk tolerance and trading style. Configuring these settings will filter the results you get in "Moving Average Bounce Signals". They are as follows:
1) Trend Strength - identifies ranging areas and helps you avoid choppy markets. The higher number, the stronger the trend must be for a signal.
2) Buffer Zone - allows you to receive a signal whenever price approaches your first MA. This way you will not miss a signal if the price doesn't bounce off your MA, or it will notify you in advance of a possible bounce/breakdown.
3) Max Candles Beyond MA - gives you a signal even if the price doesn't bounce off your first MA, but goes through it and then goes back up. You can select how many candles can close beyond the MA before invalidating the signal. Currently, the maximum number of candles that can close beyond the first MA is 5. This is done for your own practicality.
Almost all available options can be configured including the colors of the different signals - Bounces, Pullbacks, MA piercing depending on the number of candles, etc.
The second part of the indicator (called the same way with "add-on" at the end) is meant to complement this one and show additional trending signals, as well as Bull and Bear Divergences. For better results, both indicators must be used at the same time.
Please, note that like any other indicator, this one does exactly this - it indicates a good possibility of an entry, but does not guarantee profitability. Any indicator must be used as part of a system and strict money-management rules.
If you have any questions regarding the indicator or suggestions on how it could be improved, please let me know in the comment section below. Thank you.

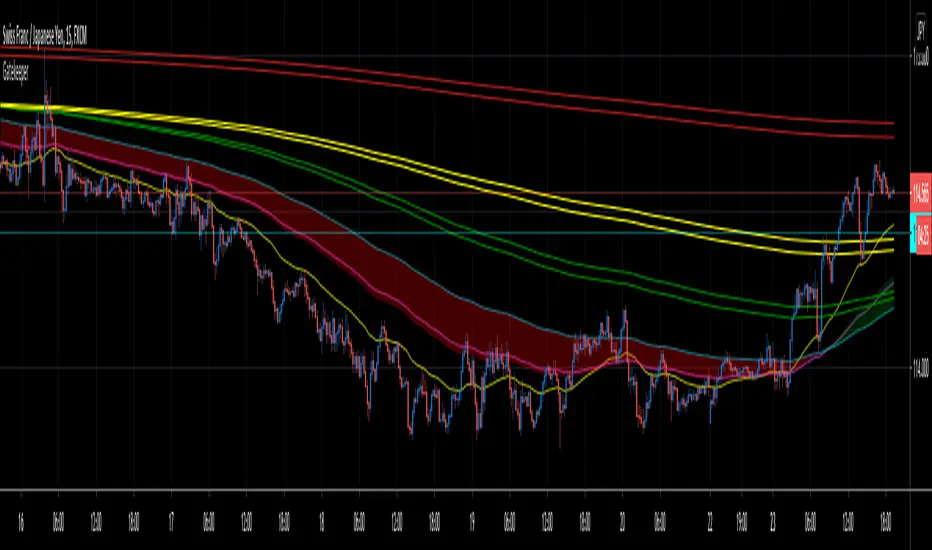
GatekeeperThe Gatekeeper is based on the 30 and 34 ema and their mtf / 3D charting from the seconds to weekly charts. The 34 ema functions as a gatekeeper of the 30 minute chart and similar to the slow guppies, the 30 ema and the 34 ema function as a gatekeeper of a trend. I have included the zone fill for some time frames on this indicator that aids the trader to identify changes in trends or gauge the strength of the current trend. With the utilization of mtf / 3d charting you will see how the higher time frame 30 and/or 34 emas function as a gatekeeper of those particular time frames as well.
The degree of separation between the 13 ema and the longer term moving averages can be used as an indicator of trend strength. If there's a wide separation, then the prevailing trend is strong. Narrow separation or lines that are criss-crossing, indicates a weakening trend or a period of consolidation.
The crossover of the 13 ema and long-term moving averages 30, 34 and 62 represent trend reversals. If the 13 ema crosses above the long-term moving averages, then a bullish reversal has occurred. If the 13 ema crosses below the longer-term moving averages, then a bearish reversal is occurring. When both groups of MAs are moving horizontally or mostly moving sideways and heavily intertwined, it means the asset lacks a price trend and therefore may not be a good candidate for trend trades. A breakout of sort will be coming and it is best to be patient. These periods may be good for range trading.
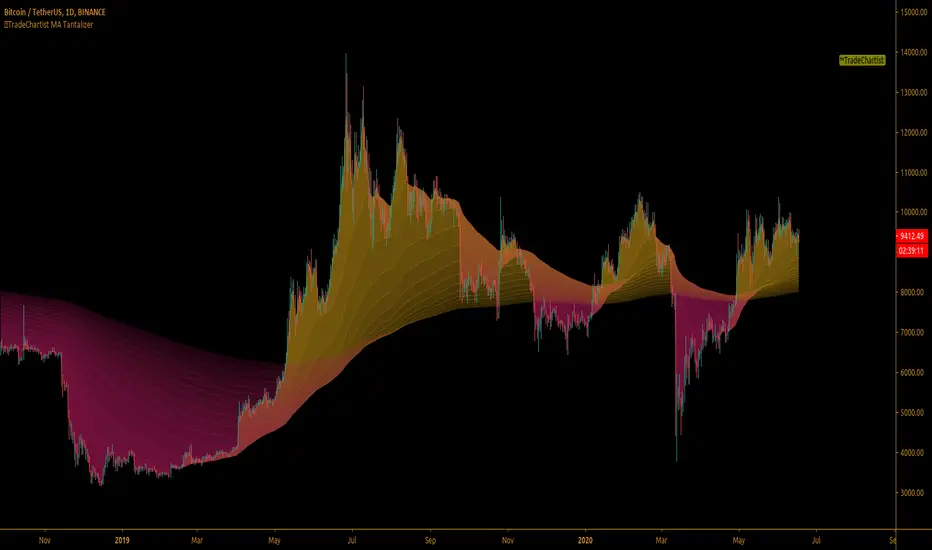
TradeChartist MA Tantalizer ™TradeChartist MA Tantalizer is a free to use, elegantly designed script for MA based traders and it offers a range of useful Moving Averages based plots including MA fishnet/Tantalizer ribbon and custom multi time frame MAs with crosses based on user input. The script's visually appealing design and its functionality offers a pleasing experience for the users, thereby complementing their analysis and helps understand asset's price action better.
What does ™TradeChartist MA Tantalizer do?
1. MA Tantalizer plots Moving Averages Tantalizer (Fishnet or Tantalized) in user preferred color scheme based on selection from a dropdown of 10 MAs ( SMA , EMA , Zero-Lag EMA , SMMA , WMA , DEMA , TEMA , VIDYA ( Variable Index DYnamic Average ), T3 MA (developed by Tim Tillson featured in his article "Better Moving Averages" in 1998), Modified T3 MA ). If length input is 10, Tantalizer plots 15 MA plots ranging from 10 MA to 150 MA. The Tantalized MAs help the traders to visually spot price trends and along with MTF (Multi Time Frame) MA plots with detection of crosses within the script, help traders make an informed trade decision. 15 MA plots can be individually plotted or hidden from the indicator settings.
2. Plots two MAs based on user input length and timeframe which helps detect MA crosses as shown below.
3. Generates Signal for MA crosses that can be plugged as Signal Connector and used with Plug and Trade scripts as below.
The sheer number of interesting things that can be done with this script from plotting visually engaging MA Tantalizer and detecting MA crosses not just on chart Timeframe, but also crosses between MAs of different timeframes, makes this script quite versatile and a real Tantalizer.
Variable Length Moving AverageThe Variable Length Moving Average was created by George R. Arrington Ph.D. (Stocks & Commodities V. 9:6 (219-223)) and I'm really loving this indicator. It is a great moving average that hugs the price very closely and it is fully adjustable to your needs. It detects signals extremely well and I have color coded the moving average line to make it very easy to interpret.
This is not to be confused with the Variable Moving Average created by Tushar S. Chande and as of now I haven't seen any other script for this moving average out there yet.
Please let me know if you would like me to write any other scripts for indicators you would like to see!
