Combo Backtest 123 Reversal & CMOaDisparity Index This is combo strategies for get a cumulative signal.
First strategy
This System was created from the Book "How I Tripled My Money In The
Futures Market" by Ulf Jensen, Page 183. This is reverse type of strategies.
The strategy buys at market, if close price is higher than the previous close
during 2 days and the meaning of 9-days Stochastic Slow Oscillator is lower than 50.
The strategy sells at market, if close price is lower than the previous close price
during 2 days and the meaning of 9-days Stochastic Fast Oscillator is higher than 50.
Second strategy
The related CMOaDisparity Index article is copyrighted material from Stocks & Commodities Dec 2009
My strategy modification.
WARNING:
- For purpose educate only
- This script to change bars colors.
Dao động

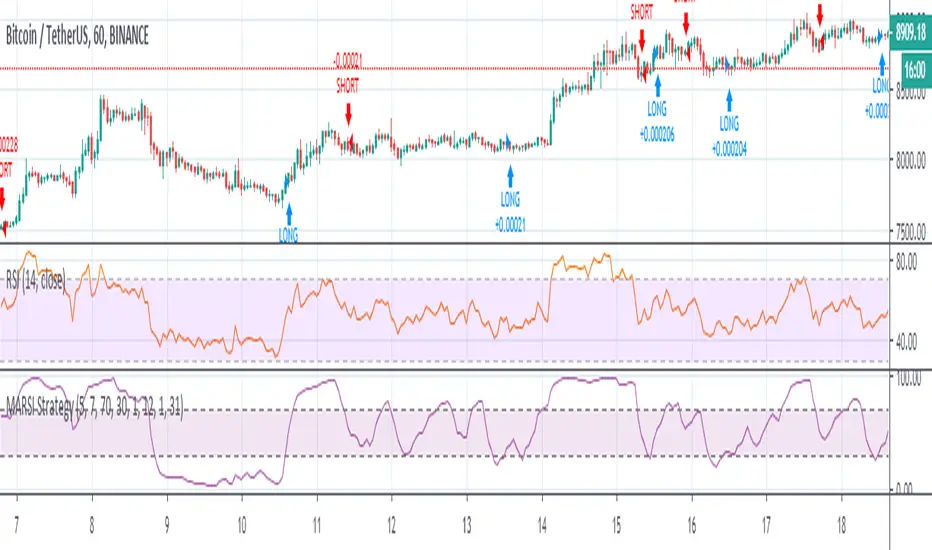
kurdistan MACD & RSI & EMA Hello friends
This indicator can help you to combine the three indicators together
EMA (20), MACD (12, 26, 20), RSI (14)
Apply ema20 to rsi as the signal line
Long arrival time
Price above EMA20, MACD above signal line and RSI above signal line
Short arrival time
Price below EMA20, MACD below signal line and RSI below signal line

ATA v4 StrategyAta strategy is include 3 different time frame = MTF
2 different moving average =MA
Oversold/overbought for relative strength index =RSI
Strategy exit for trailing stop loss %2 =TSL
MTF like 1 day, 4h and 5 min, between 2 moving averages like fibo numbers 21 and 34. Also strategy test for oversold up to 60 and overbought under the 25 with RSI. Stratefy exit include trailing stop loss %2 persantage for max. gain. It was created by XMAXPRO. This system is open to development.

Combo Backtest 123 Reversal & Directional Trend Index (DTI) This is combo strategies for get a cumulative signal.
First strategy
This System was created from the Book "How I Tripled My Money In The
Futures Market" by Ulf Jensen, Page 183. This is reverse type of strategies.
The strategy buys at market, if close price is higher than the previous close
during 2 days and the meaning of 9-days Stochastic Slow Oscillator is lower than 50.
The strategy sells at market, if close price is lower than the previous close price
during 2 days and the meaning of 9-days Stochastic Fast Oscillator is higher than 50.
Second strategy
This technique was described by William Blau in his book "Momentum,
Direction and Divergence" (1995). His book focuses on three key aspects
of trading: momentum, direction and divergence. Blau, who was an electrical
engineer before becoming a trader, thoroughly examines the relationship between
price and momentum in step-by-step examples. From this grounding, he then looks
at the deficiencies in other oscillators and introduces some innovative techniques,
including a fresh twist on Stochastics. On directional issues, he analyzes the
intricacies of ADX and offers a unique approach to help define trending and
non-trending periods.
Directional Trend Index is an indicator similar to DM+ developed by Welles Wilder.
The DM+ (a part of Directional Movement System which includes both DM+ and
DM- indicators) indicator helps determine if a security is "trending." William
Blau added to it a zeroline, relative to which the indicator is deemed positive or
negative. A stable uptrend is a period when the DTI value is positive and rising, a
downtrend when it is negative and falling.
WARNING:
- For purpose educate only
- This script to change bars colors.

Combo Backtest 123 Reversal & DiNapoli Detrended Oscillator This is combo strategies for get a cumulative signal.
First strategy
This System was created from the Book "How I Tripled My Money In The
Futures Market" by Ulf Jensen, Page 183. This is reverse type of strategies.
The strategy buys at market, if close price is higher than the previous close
during 2 days and the meaning of 9-days Stochastic Slow Oscillator is lower than 50.
The strategy sells at market, if close price is lower than the previous close price
during 2 days and the meaning of 9-days Stochastic Fast Oscillator is higher than 50.
Second strategy
DiNapoli Detrended Oscillator Strategy
WARNING:
- For purpose educate only
- This script to change bars colors.

Best Supertrend CCI StrategyHello traders
Someone requested the strategy version of the Supertrend CCI indicator
It's a Supertrend not based on candle close but based on a CCI ( Commodity Channel Index )
How does it work?
Bull event: CCI crossing over the 0 line
Bear event: CCI crossing below the 0 line
When the event is triggered, the script will plot the Supertrend as follow
UP Trend = High + ATR * Factor
DOWN Trend = Low - ATR * Factor
This is an alternative of the classical Supertrend based on candle close being above/beyond the previous Supertrend level.
Hope you'll enjoy it and it will improve your trading making you a better trader
Dave

DPO RMA STRATEGYThis strategy uses tradingview's built-in "Detrended Price Osciilator" ( DPO )indicator script.
It takes the average of 6 different fib lookback periods. (55,89,144,233,377,610)
This is plotted in the purple line.
It then takes the RMA of the DPO and uses the RMA's to determine entry points with crossovers and crossunders.
It's an extremely easy indicator to use. You mostly only need to adjust the last 2 inputs (These are the RMA Smoother inputs)
Works well with most any market and with any timeframe.
Works great on Heiken Ashi if you keep orders under 150. But I can't post in heiken ashi format thanks to automated traders complaining to tradingivew that they can't make any money with heiken ashi candles
And then pine coders like this that are embraced with high regard because they realized that they can spam a heiken ashi chart with over 400 trades and magically it has excessive slippage.

Stochastic Pop and Drop by Jake Bernstein v1 [Bitduke]I found a simple strategy by Jake Bernstein, modified it a little and created a strategy with Risk Management System (SL+TP); After that I test it on the different cryptocurrency pairs.
About the Indicator
Basically it's the strategy of 2 indicators: Stochastic Oscillator to define the bias and Average Directional Index to confirm it.
One again, It uses Stochastic Oscillator to define the trading bias. In particular, the trading bias was deemed bullish when the weekly 14-period Stochastic Oscillator was above some default value (in him paper - 50) and rising and vice versa.
Once the trading bias is established, Steckler used the Average Directional Index (ADX) to define a slowdown in the trend. ADX measures the strength of the trend and a move below 20 signals a weak trend.
Modifications
I didn't implement Average Directional Index (ADX) and test just different sources for data, oscillator periods and different levels in relation to the crypto market.
So, it shows good results with two tight thresholds at 55 and 45 level.
The bar chart below the defining the bullish and bearish periods (green and red) and gives a signal to enter the trade (purple bars).
Backtesting
Backtested on XBTUSD , BTCPERP (FTX) pairs. You may notice it shows good results on 3h timeframe.
Relatively low drawdown
~ 10% (from 2019 to date) FTX
~ 22% (4 years from 2016) Bitmex
I backtested on the different altcoin pairs as well, but the results were just not good.
Relatively good results were shown by some index pairs from the FTX exchange ( FTX:SHITPERP ), but I think there is a few data for backtesting to be asure in them.
Bitmex 3h (2017 - 2020) :
i.imgur.com
FTX 3h (2019 - 2020):
i.imgur.com
Possible Improvements
- Regarding trading algorithm it would be good to check with strategy with ADX somehow. Maybe for the better entries
- As for Risk Management system, it can be improved by adding trailing stop to the strategy.
Link: school.stockcharts.com

Trend Balance Point System by Welles WilderThis is the original Trend Balance Point System created by Welles Wilders in 1978, rules can be found in his book New Concepts in Technical Trading Systems.

HA smoothed eliminator v2 This script is published to show the difference between Heiken ASHI and Japanese candlesticks. I do not recommend using it in trading. the indicator is taken from here

Noro's BottomSensivity v0.6 strategy + rsi + AlarmThe original indicator is Noro's BottomSensivity v0.6
I simply turned noro's bottom sensibility 6.0 indicator, which I consider a great tool to find market bottom, into a strategy.
I also added an additional RSI filter with inputs that can be set by the user for entry and exit from the market.
I have tried to insert an alarm so that I can be notified when this particular purchase condition is formed.
I also tried to insert an additional filter that would allow me to make further pyramid purchases only after a certain percentage of drawdown from the first entry so as to reduce the average purchase price but I was not able ... if someone could implement this I would appreciate it.
Well..this is the first time that I try to program / modify a strategy / indicator, there are certainly some gross errors (as in my English too), please forgive me, I will appreciate the corrections that more experienced users will want to make.
I wish you all a good day, pfjons

MACD_RSI strategyUse three indicator to entry a position
EMA (20), MACD (12, 26, 20), RSI (14)
apply ema20 on rsi as signal line
Entry long when
price above EMA20, MACD above signal line and RSI above signal line
Entry short when
price below EMA20, MACD below signal line and RSI below signal line
Study only, use it under your own risk.

EASYMOKU INDICATORThis is the popular Ichimoku Indicator with an easier way to adjust the settings that can help you in your trading.
Components of the Ichimoku indicator:
Tenkan Sen: Basically it is a moving average that goes from 7 to 9 periods.
Kijun Sen: Like Tenkan Sen, we are facing a moving average, but this time from 22 to 26 periods.
Chikou Span: It is the one that represents the current price, but reflected in 22 to 26 periods back.
Senkou Span A: Unlike Chikou Span, this line is drawn over the next 22 to 26 periods, and its calculation is obtained from the average between Tenkan Sen and Kijun Sen. It is a projected average in the future.
Senkou Span B: It is the result of calculating the average between the maximum and minimum over the last 44 to 52 periods, representing the following 22 to 26 periods (as well as the Senkou Span A)
As with Occidental trading systems, based on the crossings of averages, with the Ichimoku we will use the crossing of the Tenkan Sen (fast moving average) with the Kijun Sen (slow moving average) as buying and selling signals.
Strategy of this script:
A strong bullish signal is when price and Chikou Span rises above Kumo cloud and Tenkan Sen cross above Kijun Sen.
A strong bearish signal is when price and Chikou Span falls below Kumo cloud and Tenkan Sen croos under Kijun Sen.

MA 12, MA 24, RSI OB-OS, CCI by WP@SITechDeveloped by Worachart Pirunruk, MD - Siam Intelligence Technology
This is the signal that generates based on 4 Technical Analysis Tools:
1. SMA 12,
2. SMA 26,
3. RSI 14,3,3
4. CCI
Signal to Buy/Long when the RSI below Dynamic oversold line based on close price back 60 bars.
Parameter. This signal doesn't have to best TP point, I'm working on improvement, now. Btw, don't forget to calculate you Margin Level. I'll teach you guys later of how to calculate.
Have fun Trading guys, and don't forget to give back to others. Because, Giving is Receiving."
WP@SITech


New RenaissancePrelim version of MACD long entry and exit with custom time frame selector.
To do:
Add Stoch and Stoch RSI criteria.


Hancock - Filtered Volume OBV OSC [Strategy]Trading strategy based on Donchain channel price breakouts confirmed by an optionally configurable volume filtered OBV oscillator.
Colored diamonds on charts represent signals where top side is buy side and bot side is sell side - green indicates open and red indicates close.
Pretty simple but nicely demonstrates the volume filtered OBV oscillator found here .
Happy trading
Hancock


Incremental Order size +This is an old and incomplete script that is being pulled up and dusted off as per request.
The sole purpose of this script was to provide code snippets allowing one to easily convert their own script/strategy to include incremental order sizes. More control over your pyramiding orders.
**It may repaint, and was not intended for trading but more as an attempt to provide examples for more control with pyramiding.

Voss Strategy (Filter + Trend Indicator) [Bitduke]Created strategy based on Voss Predictive Filter, implemented by TradingView user e2e4mfck.
Voss Predictive Filter
This is a relatively new filter from John F. Ehlers’ article, “A Peek Into The Future .” Ehlers describes the calculation of a new filter that could help signal cyclical turning points in markets.
But filter has a negative group delay and while an indicator based on it cannot actually see into the future, it may provide the trader with signals in advance of other indicators.
In mentioned article he tested filter on SPY and at one point in time "it went into a trend mode in January 2019, and the cycle signal failed miserably, signaling a short position during the runup. <...> The only way to minimize the impact of this condition is to employ an additional trend detector."
Thus I've added another Ehlers' based trend based indicator Instantaneous Trendline (thanks to LazyBear for implementation) to minimize the impact of the trend mode and got a good results on XBTUSD pair 4h.
Backtest :
> Range: 2016 - 2020
> XBTUSD
> 4h
> ~20% drawdown
> Sharpe (0.361, not too impressive)
I think it can be improved with Risk Management system and experimenting with various trend following indicators.
