Combo Backtest 123 Detrended Price Oscillator This is combo strategies for get a cumulative signal.
First strategy
This System was created from the Book "How I Tripled My Money In The
Futures Market" by Ulf Jensen, Page 183. This is reverse type of strategies.
The strategy buys at market, if close price is higher than the previous close
during 2 days and the meaning of 9-days Stochastic Slow Oscillator is lower than 50.
The strategy sells at market, if close price is lower than the previous close price
during 2 days and the meaning of 9-days Stochastic Fast Oscillator is higher than 50.
Second strategy
The Detrend Price Osc indicator is similar to a moving average,
in that it filters out trends in prices to more easily identify
cycles. The indicator is an attempt to define cycles in a trend
by drawing a moving average as a horizontal straight line and
placing prices along the line according to their relation to a
moving average. It provides a means of identifying underlying
cycles not apparent when the moving average is viewed within a
price chart. Cycles of a longer duration than the Length (number
of bars used to calculate the Detrend Price Osc) are effectively
filtered or removed by the oscillator.
WARNING:
- For purpose educate only
- This script to change bars colors.
Dao động
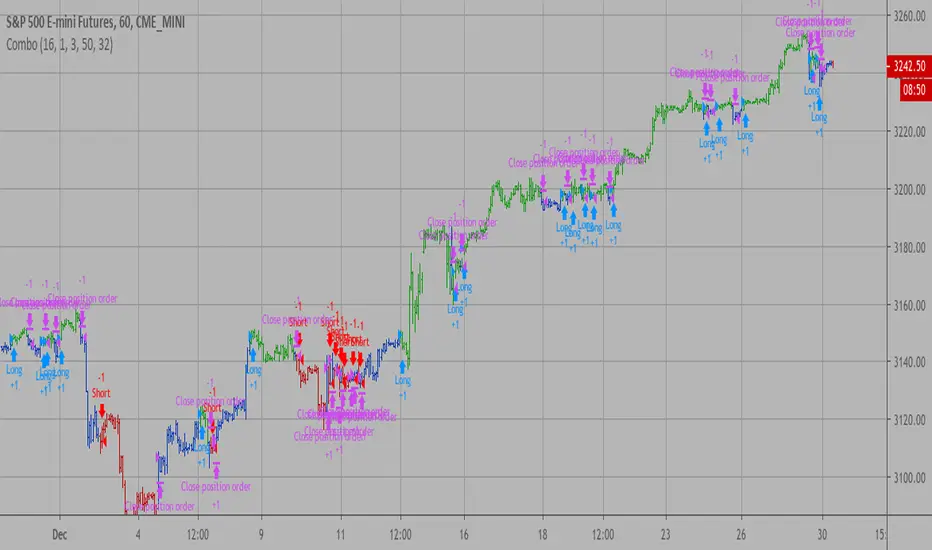
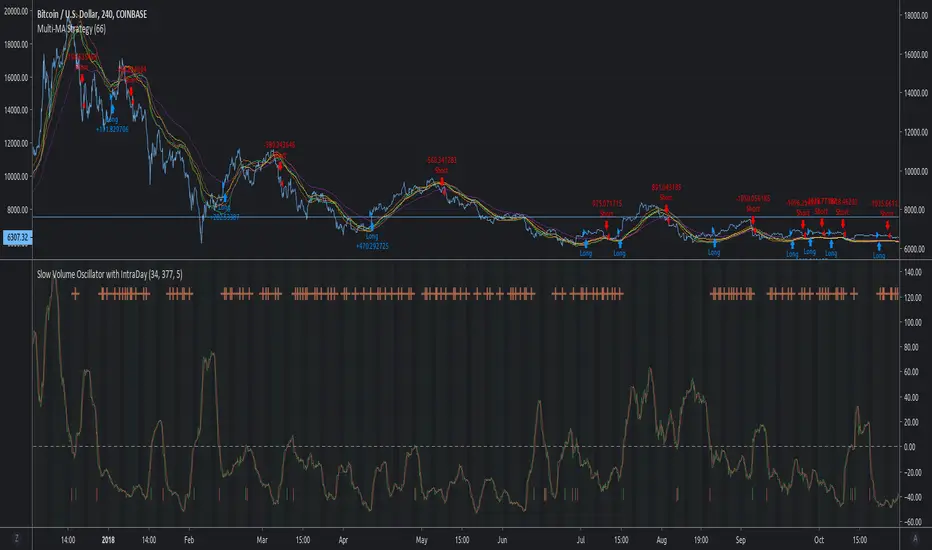
Multi-Oscillator Divergence StrategyNote: This is a modified version of TradingView's built-in "Divergence Indicator" and applied in "Strategy" format to show back testing results
It finds bullish and bearish divergence in a selection of well known MA formulas: MACD, RSI, STOCH, DETRENDED PRICE OSCILLATOR, MOMENTUM.
I've found good results even on 1 minute charts!
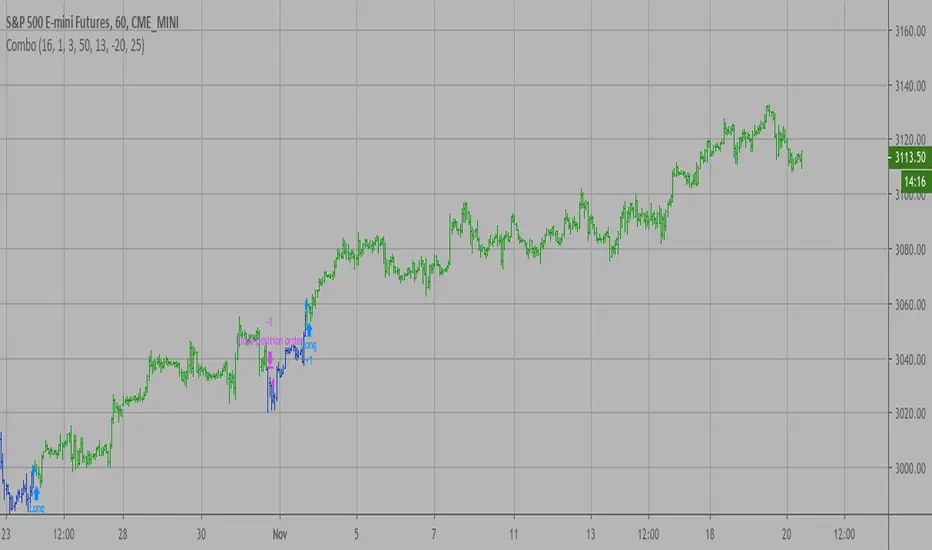
In this example the chart backtest is utilizing the detrended price oscillator (DPO)
There are multiple variables, so the ability to find good back test can sometimes be "time consuming"
And please note that if you increase "Pivot LookBack Right" variable too high, then you will increase chance of repaint. Keep this variable as low as possible
I've also drawn my own solutions on the chart (red and green trend lines) to find good take profit and safe stop loss. In order to study this properly you need the own the chart. Scripts don't give you this option.
See private chart publication link to "own" the chart for yourself. Simply click on the "Share" button (it's the megaphone icon) and click on "Make it Mine"
I've found the best approach is to create 5 copies of indicator on 1 chart and have each running with different MA formula. This will give you a majority consensus type environment.
I will post study with alert conditions next
Good luck and enjoy!

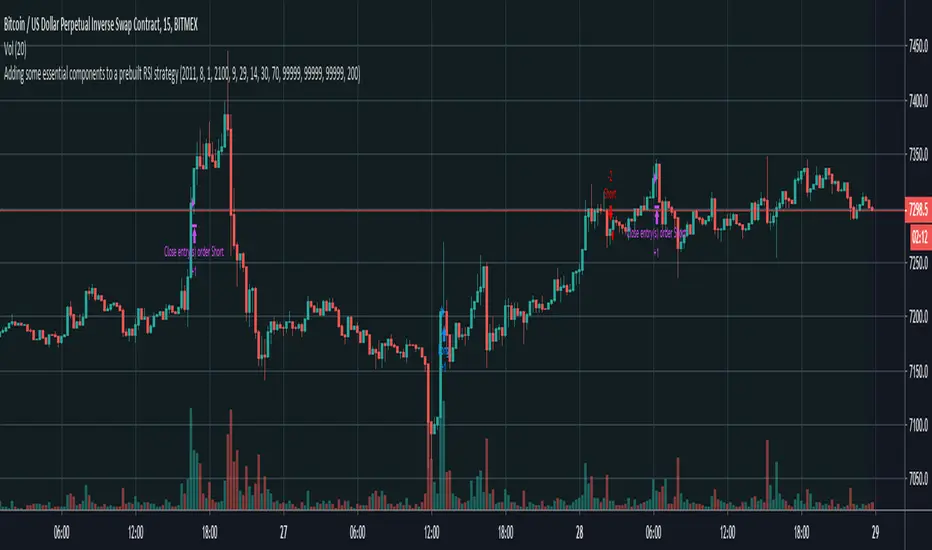
Adding some essential components to a prebuilt RSI strategy v4Taken from and just updated to compile in version 4. Added notes for users on where to swap out RSI component with their setup components to signal a long or short position.
Simple EMA_Hull_RSI StrategyAnother simple strategy. Crossing EMA & Hull MA and the level of RSI (overbought/oversold) defines long or short.
Can be improved by varying the parameters and adding take profit / stop loss.
Backtest: ETHUSD (Bitmex): 5m

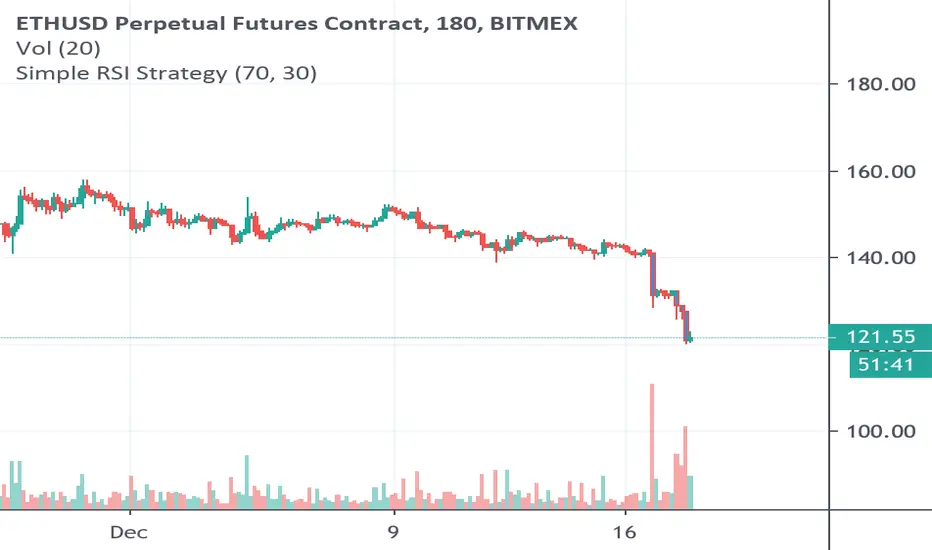
Simple RSI Strategy Buy/Sell at a certain levelSimple Strategy based on RSI, using overbought or oversold levels, defined by us, sell or buy an asset.
Backtest: ETHUSD (Bitmex) - 3h
Ichimoku Kinko Hyo Cloud - no offset - no repaint - strategyIchimoku Kinko Hyo Cloud - no offset - no repaint - RSI filter - strategy
The indicator contains both the standard Ichimoku Cloud , as well as the one without the visual offset.
The Strategy Tester indicates good backtest results when the Ichimoku Cloud is paired with the RSI .
However, it seems it likes to work more as a standalone system.
The indicator can be easily converted to the study() mode by commenting/uncommenting a few lines,
then the alarms can be configured.
There are entry and exit signals ready to be used by the alert system.
The coloring of the cloud without offset contains all 3 conditions: Uptrend , Downtrend , Transition .

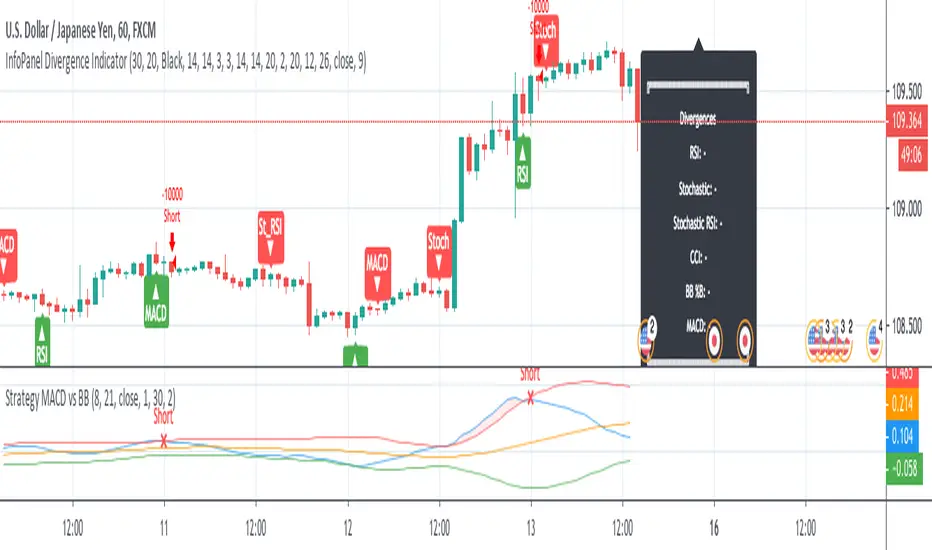
Strategy MACD vs BBStrategy based on MACD and Bollinger Bands, where BBs are calculatend from macd signal.
Strategy doesn't open at breakout of bands but it waits for a pullback.
Upper and lower bands are used as resistance and support.
There are various parameters that can be optimized.
I have also a study with alerts.
Please use comment section for any feedback or cointact me if you need support.
Leverage Strategy and a few words on risk/opportunityHello traders,
I started this script as a joke for someone... finally appears it could be used for educational content
Let's talk about leverage and margin call
Margin Call
A margin call is the broker's demand that an investor deposit additional money or securities so that the account is brought up to the minimum value, known as the maintenance margin.
A margin call usually means that one or more of the securities held in the margin account has decreased in value below a certain point.
Leverage
A leverage is a system which allows the trader to open positions much larger than his own capital. ... “Leverage” usually refers to the ratio between the position value and the investment needed,
Strat
The strategy simulates long/short positions on a 4h high/low breakout based on the chart candle close.
The panel below shows the strategy equity curve. Activating the margin call option will show when the account would be margin called giving the settings
Casino
I'm not doing any financial recommendation here.
I made this strategy so that people include more risk management metrics into their strategy.
From the code, we see it's fairly easy to calculate a leveraged position size and a margin call flag - when that flag is hit, the system stops trading.
I simplified things to the extreme here but my point is that the leverage is a double-edge sword gift.
Assuming we always take the same position sizing, increasing the leverage speed up how fast a margin could be ..... called. (bad joke? feel free to tell me). Not saying it will, saying it introduces more risk by design.
Then one could say "I'll just turn off that stupid margin call option". And that's when someone starts backtesting with unrealistic market conditions.
Finally...
When I backtest I always assume the worst in every scenario possible (because I'm French), I always try to minimize the risk first (also because I'm French), keeping as close from 0 as possible (French again)
Then I add the "opportunity" component, looking to catch the maximum of opportunity while keeping the risk low.
It's like a Rubix cube puzzle - decreasing the risk is one side of the equation but whenever I try to catch more opportunity... my risks increases.
Then I update my risk... and now the opportunity decreases... (#wut #wen #simple)
Completely removing the risk from a trading strategy isn't something I wouldn't dare doing.
Trading involves risk. Being obsessed by decreasing the risk is what I do BEST :)
Dave

Combo Backtest 123 Reversal & DAPD This is combo strategies for get a cumulative signal.
First strategy
This System was created from the Book "How I Tripled My Money In The
Futures Market" by Ulf Jensen, Page 183. This is reverse type of strategies.
The strategy buys at market, if close price is higher than the previous close
during 2 days and the meaning of 9-days Stochastic Slow Oscillator is lower than 50.
The strategy sells at market, if close price is lower than the previous close price
during 2 days and the meaning of 9-days Stochastic Fast Oscillator is higher than 50.
Second strategy
This indicator is similar to Bollinger Bands. It based on DAPD - Daily
Average Price Delta. DAPD is based upon a summation for each of the
highs (hod) for the 21 days prior to today minus the summation for
each of the lows (lod) for the last 21 days prior to today. The result
of this calculation would then be divided by 21.
It will be buy when high above previos DAPD high and sell if low below previos DAPD low
WARNING:
- For purpose educate only
- This script to change bars colors.

SuPeR-RePaNoCHa #2TP#This is the last of the 'RePaNoCHa' script for Automatic Trading ;-) ... This time with two take profits ...
It Use 6 indicators + volume:
-JURIK MOVING AVERAGE
-RANGE FILTER
-ADX
-PARABOLIC SAR
-RSI + VOLUME WEIGHTED
-MACD
-VOLUME
To close the position you can choose between 2 Take Profit and the amount to use on each one.
You can transform it yourself into 'study' mode to get alerts.
Take Profits can be generated from the same entry, (syntax example on the script) so the fees will be lower (0.04 + 0.02 / 2 = 0.03).
Settings for BINANCE FUTURES BTC:USDT
Enjoy...

Expert studio strategy 1 - GBPUSDThis is part of a series of strategies developed automatically by a online software.
I cannot share the site url, which is not related to me in any way, because it is against the TV reules.
This strategy was optimized for GBPUSD, timeframe 1D, fixed lots 0.1, initial balance 1000€.
LOGIC:
- LONG ENTRY when previous candle is bear
- LONG EXIT: RVI > signal line
- SHORT ENTRY when previous candle is bull
- SHORT EXIT: RVI < signal line
NOTE: I considered the open of actual candle instead of close otherwise there will be a back shift of 1 candle in pine script
Take profit = no
Stop loss = no
I have also a study with alarms.
Please use comment section for any feedback.

Combo Backtest 123 Reversal & D_Three Ten OscThis is combo strategies for get a cumulative signal.
First strategy
This System was created from the Book "How I Tripled My Money In The
Futures Market" by Ulf Jensen, Page 183. This is reverse type of strategies.
The strategy buys at market, if close price is higher than the previous close
during 2 days and the meaning of 9-days Stochastic Slow Oscillator is lower than 50.
The strategy sells at market, if close price is lower than the previous close price
during 2 days and the meaning of 9-days Stochastic Fast Oscillator is higher than 50.
Second strategy
TradeStation does not allow the user to make a Multi Data Chart with
a Tick Bar Chart and any other type a chart. This indicator allows the
user to plot a daily 3-10 Oscillator on a Tick Bar Chart or any intraday interval.
Walter Bressert's 3-10 Oscillator is a detrending oscillator derived
from subtracting a 10 day moving average from a 3 day moving average.
The second plot is an 16 day simple moving average of the 3-10 Oscillator.
The 16 period moving average is the slow line and the 3/10 oscillator is
the fast line.
For more information on the 3-10 Oscillator see Walter Bressert's book
"The Power of Oscillator/Cycle Combinations"
WARNING:
- For purpose educate only
- This script to change bars colors.

MACD Multi-MA StrategyThis script applies the average of each major MA (SMA, RMA, EMA, WVMA, WMA) to the MACD formula.
The logic is simple. When all 5 MA's are in agreement in direction, then then script will notify users of change.
I posted this as a strategy to help show how logic does in back test. If you use my simple yet effective solution to find take profit locations, you can blow this back testing out of the water!!!
To set alerts simply turn script into study
//@version=2
study(title="MACD Multi-MA Study", overlay=false)
src = close
len1 = input(8, "FAST LOOKBACK")
len2 = input(144, "SLOW LOOKBACK")
/////////////////////////////////////////////
length = len2-len1
ma = vwma(src, length)
plot(ma, title="VWMA", color=lime)
length1 = len2-len1
ma1 = rma(src, length1)
plot(ma1, title="RMA", color=purple)
length2 = len2-len1
ma2 = sma(src, length2)
plot(ma2, title="SMA", color=red)
length3 = len2-len1
ma3 = wma(src, length3)
plot(ma3, title="WMA", color=orange)
length4 = len2-len1
ma4 = ema(src, length4)
plot(ma4, title="EMA", color=yellow)
long = ma > ma and ma1 > ma1 and ma2 > ma2 and ma3 > ma3 and ma4 > ma4
short = ma < ma and ma1 < ma1 and ma2 < ma2 and ma3 < ma3 and ma4 < ma4
alertcondition(long == true, title='MACD LONG SIGNAL', message='MACD LONG!')
alertcondition(short == true, title='MACD SHORT SIGNAL', message='MACD SHORT!')
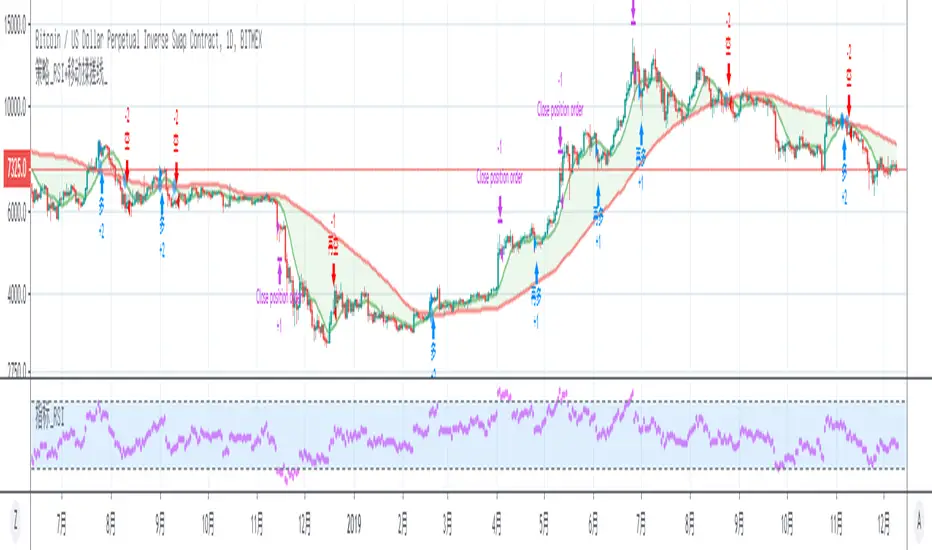
SMA_Cross + RSI1. long
a. RSI does not open an order when it is overbought, until the RSI falls below a certain threshold, and then open a position
b. There are already many positions. If the RSI is overbought, it will be profitable. When the RSI falls below a certain threshold, open a long position again until the moving average crossover signal turns short.
2. Short
a. RSI does not open an order when it is oversold, and then opens a position after RSI rises to a certain threshold
b. There are already short positions. If the RSI is oversold, it will be profitable to close the short position. When the RSI rises above a certain threshold, open the short position again until there is a reversal of the moving average crossing signal.
1. 做多
a. RSI在超买区间时不开单,直到RSI回落到某个阈值之下,再开仓
b. 已经有多仓,如果RSI超买,则平多获利,当RSI回落到某个阈值之下后,再次开多,直到有均线交叉信号反转做空
2. 做空
a. RSI在超卖区间时不开单,直到RSI上升到某个阈值之后,再开仓
b. 已经有空仓,如果RSI超卖,则平空获利,当RSI上升到某个阈值之上后,再次开空,直到有均线交叉信号反转做多
ANN RSI SUPER TREND STRATEGY BY che_traderCreate a strategy for the good indicator created by @RafaelZioni
Which is composed of ANN data taken from
and the super trend shared by www.tradingview.com
Feel free to share and copy this script!
Enjoy!

Combo Backtest 123 Reversal & D_ELI (Ehlers Leading Indicator) This is combo strategies for get a cumulative signal.
First strategy
This System was created from the Book "How I Tripled My Money In The
Futures Market" by Ulf Jensen, Page 183. This is reverse type of strategies.
The strategy buys at market, if close price is higher than the previous close
during 2 days and the meaning of 9-days Stochastic Slow Oscillator is lower than 50.
The strategy sells at market, if close price is lower than the previous close price
during 2 days and the meaning of 9-days Stochastic Fast Oscillator is higher than 50.
Second strategy
This Indicator plots a single
Daily DSP (Detrended Synthetic Price) and a Daily ELI (Ehlers Leading
Indicator) using intraday data.
Detrended Synthetic Price is a function that is in phase with the dominant
cycle of real price data. This one is computed by subtracting a 3 pole Butterworth
filter from a 2 Pole Butterworth filter. Ehlers Leading Indicator gives an advanced
indication of a cyclic turning point. It is computed by subtracting the simple
moving average of the detrended synthetic price from the detrended synthetic price.
Buy and Sell signals arise when the ELI indicator crosses over or under the detrended
synthetic price.
See "MESA and Trading Market Cycles" by John Ehlers pages 64 - 70.
WARNING:
- For purpose educate only
- This script to change bars colors.
MarketCipher B Backtest (FOR TESTING ONLY, NOT SAFE TO TRADE)A script to backtest the strategy outlined. This is not a final version of the script and is therefore not safe to trade. If you choose to ignore this warning, trade at your own risk.
Combo Backtest 123 Reversal & Detrended Synthetic Price V 2 This is combo strategies for get a cumulative signal.
First strategy
This System was created from the Book "How I Tripled My Money In The
Futures Market" by Ulf Jensen, Page 183. This is reverse type of strategies.
The strategy buys at market, if close price is higher than the previous close
during 2 days and the meaning of 9-days Stochastic Slow Oscillator is lower than 50.
The strategy sells at market, if close price is lower than the previous close price
during 2 days and the meaning of 9-days Stochastic Fast Oscillator is higher than 50.
Second strategy
Detrended Synthetic Price is a function that is in phase with the
dominant cycle of real price data. This DSP is computed by subtracting
a half-cycle exponential moving average (EMA) from the quarter cycle
exponential moving average.
See "MESA and Trading Market Cycles" by John Ehlers pages 64 - 70.
WARNING:
- For purpose educate only
- This script to change bars colors.
Combo Backtest 123 Reversal & D_DSP (Detrended Synthetic Price) This is combo strategies for get a cumulative signal.
First strategy
This System was created from the Book "How I Tripled My Money In The
Futures Market" by Ulf Jensen, Page 183. This is reverse type of strategies.
The strategy buys at market, if close price is higher than the previous close
during 2 days and the meaning of 9-days Stochastic Slow Oscillator is lower than 50.
The strategy sells at market, if close price is lower than the previous close price
during 2 days and the meaning of 9-days Stochastic Fast Oscillator is higher than 50.
Second strategy
Detrended Synthetic Price is a function that is in phase with the
dominant cycle of real price data. This DSP is computed by subtracting
a half-cycle exponential moving average (EMA) from the quarter cycle
exponential moving average.
See "MESA and Trading Market Cycles" by John Ehlers pages 64 - 70.
WARNING:
- For purpose educate only
- This script to change bars colors.

TradingView Alerts to MT4 MT5 + dynamic variables NON-REPAINTINGAccidentally, I’m sharing open-source profitable Forex strategy. Accidentally, because this was aimed to be purely educational material. A few days ago TradingView released a very powerful feature of dynamic values from PineScript now being allowed to be passed in Alerts. And thanks to TradingConnector, they could be instantly executed in MT4 or MT5 platform of any broker in the world. So yeah - TradingConnector works with indices and commodities, too.
The logic of this EURUSD 6h strategy is very simple - it is based on Stochastic crossovers with stop-loss set under most recent pivot point. Setting stop-loss with surgical precision is possible exactly thanks to allowance of dynamic values in alerts. TradingConnector has been also upgraded to take advantage of these dynamic values and it now enables executing trades with pre-calculated stop-loss, take-profit, as well as stop and limit orders.
Another fresh feature of TradingConnector, is closing positions only partly - provided that the broker allows it, of course. A position needs to have trade_id specified at entry, referred to in further alerts with partial closing. Detailed spec of alerts syntax and functionalities can be found at TradingConnector website. How to include dynamic variables in alert messages can be seen at the very end of the script in alertcondition() calls.
The strategy also takes commission into consideration.
Slippage is intentionally left at 0. Due to shorter than 1 second delivery time of TradingConnector, slippage is practically non-existing. This can be achieved especially if you’re using VPS server, hosted in the same datacenter as your brokers’ servers. I am using such setup, it is doable. Small slippage and spread is already included in commission value.
This strategy is NON-REPAINTING and uses NO TRAILING-STOP or any other feature known to be faulty in TradingView backtester. Does it make this strategy bulletproof and 100% success-guaranteed? Hell no! Remember the no.1 rule of backtesting - no matter how profitable and good looking a script is, it only tells about the past. There is zero guarantee the same strategy will get similar results in the future.
To turn this script into study so that alerts can be produced, do 2 things:
1. comment “strategy” line at the beginning and uncomment “study” line
2. comment lines 54-59 and uncomment lines 62-65.
Then add script to the chart and configure alerts.
This script was build for educational purposes only.
Certainly this is not financial advice. Anybody using this script or any of its parts in any way, must be aware of high risks connected with trading.
Thanks @LucF and @a.tesla2018 for helping me with code fixes :)

On Balance Volume Oscillator Strategy [QuantNomad]Looking for the way to use OBV Oscillator in a strategy.
Here is my first try. I just enter to position of a cross of 2 emas based on OBV.
Here is my original oscillator indicator:

Combo Backtest 123 Reversal & Cueing Off Sup/Res Levels This is combo strategies for get a cumulative signal.
First strategy
This System was created from the Book "How I Tripled My Money In The
Futures Market" by Ulf Jensen, Page 183. This is reverse type of strategies.
The strategy buys at market, if close price is higher than the previous close
during 2 days and the meaning of 9-days Stochastic Slow Oscillator is lower than 50.
The strategy sells at market, if close price is lower than the previous close price
during 2 days and the meaning of 9-days Stochastic Fast Oscillator is higher than 50.
Second strategy
Cueing Off Support And Resistance Levels, by Thom Hartle
modified by HPotter for trade signals.
The related article is copyrighted material from Stocks & Commodities.
WARNING:
- For purpose educate only
- This script to change bars colors.

Combo Backtest 123 Reversal & Confluence This is combo strategies for get a cumulative signal.
First strategy
This System was created from the Book "How I Tripled My Money In The
Futures Market" by Ulf Jensen, Page 183. This is reverse type of strategies.
The strategy buys at market, if close price is higher than the previous close
during 2 days and the meaning of 9-days Stochastic Slow Oscillator is lower than 50.
The strategy sells at market, if close price is lower than the previous close price
during 2 days and the meaning of 9-days Stochastic Fast Oscillator is higher than 50.
Second strategy
This is modified version of Dale Legan's "Confluence" indicator written by Gary Fritz.
================================================================
Here is Gary`s commentary:
Since the Confluence indicator returned several "states" (bull, bear, grey, and zero),
he modified the return value a bit:
-9 to -1 = Bearish
-0.9 to 0.9 = "grey" (and zero)
1 to 9 = Bullish
The "grey" range corresponds to the "grey" values plotted by Dale's indicator, but
they're divided by 10.
WARNING:
- For purpose educate only
- This script to change bars colors.
