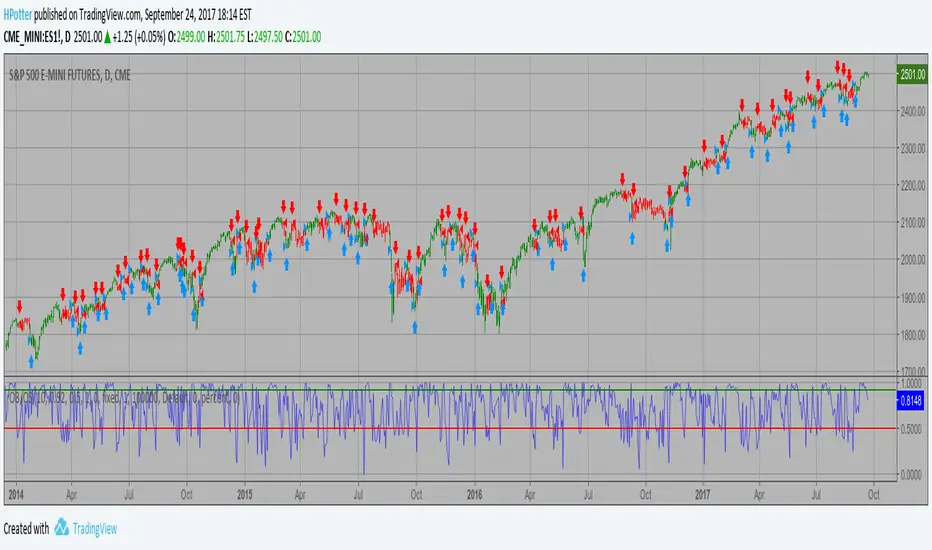
Rsi/Cci Overbought Oversold CandlesThis indicator will allow you to see overbought and oversold areas of the rsi or the cci, you must set yourself the upper and lower band of the rsi (70-30) or cci (100, -100). By default, it's Rsi
I have already posted the same indicator but only with the Rsi, I wanted to posted a more complete that offers the 2.
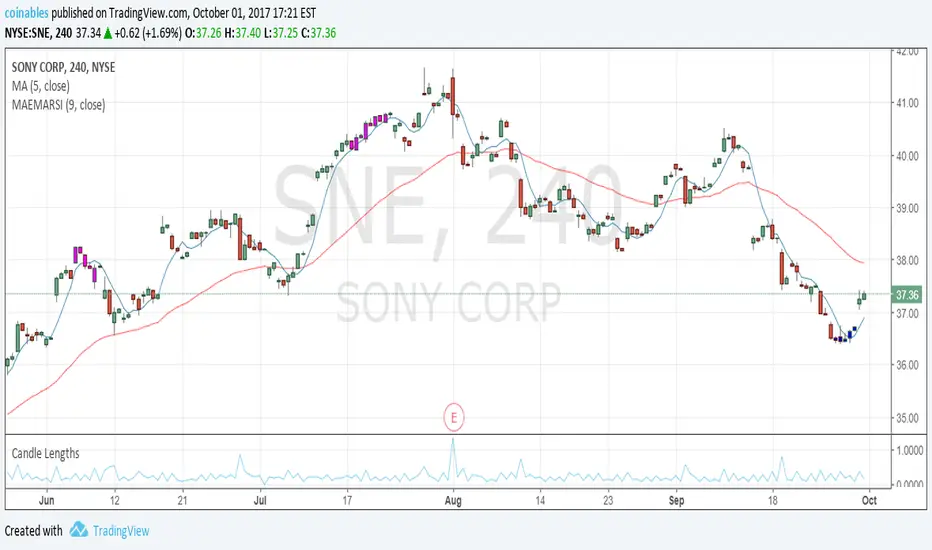
On the chart, it is the overbought / oversold area of the Cci that is displayed
Chỉ báo Pine Script®