Trend Break CandlesBar Colors based on trend breaks Trend lines not included, just drawn as an example of what is happening.Chỉ báo Pine Script®của CrispIndicators4040116
Vpricesarthis VPrice SAR seems to look good:) VPRICE is a volume indicator that I made when I was bored at job:) now we put to action with SAR :) alerts insideChỉ báo Pine Script®của RafaelZioniCập nhật 66470
moneymachineV1so in this update . the color are the berish or bullish zone of SAR (green ,red) 3 buy system 1. guppy (made by justuncle gamma oscilator and SAR (shown in green and red arrow) 2. RSI ATR channel (B=BUY ) S=SELL - RSI signal is done by combination of slow and fast rsi . the length of ATR also influance the signal 3. Support and resitance line signal are made by bolinger and ATR channel (u=UP ,D =down ) alerts inside have fun Chỉ báo Pine Script®của RafaelZioni77119
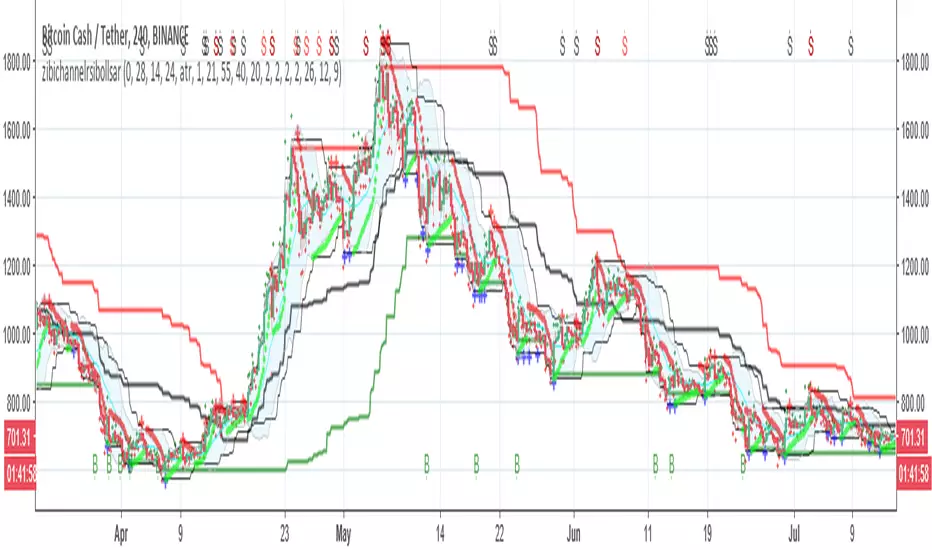
zibichannelrsibollsarsame as last version but instead of filter with Bollinger we filter with sar and rsiChỉ báo Pine Script®của RafaelZioni33140
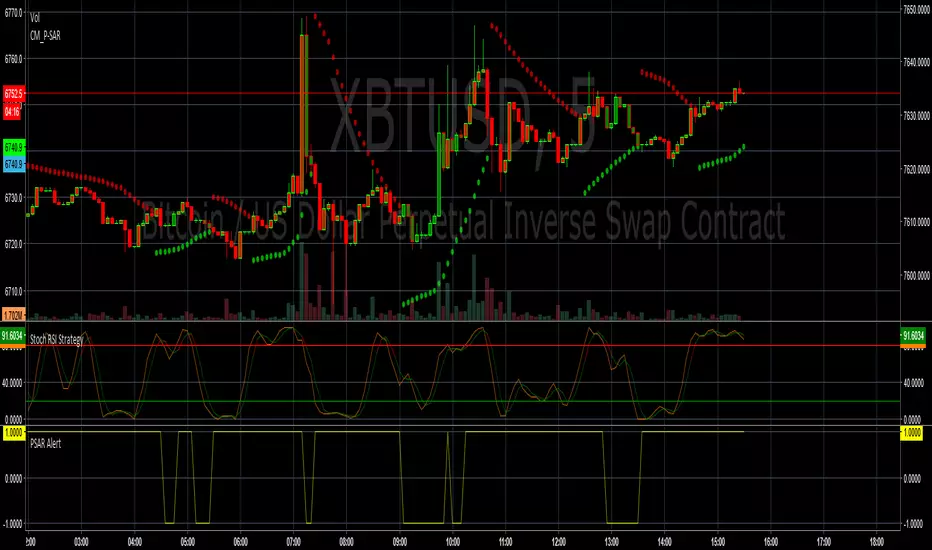
PSAR + SRSI AlertBUY- Will Buy If PSAR is green. SELL- Will Sell if PSAR is red OR SRSI becomes overbought. PM for Use.Chỉ báo Pine Script®của hexelbyte35
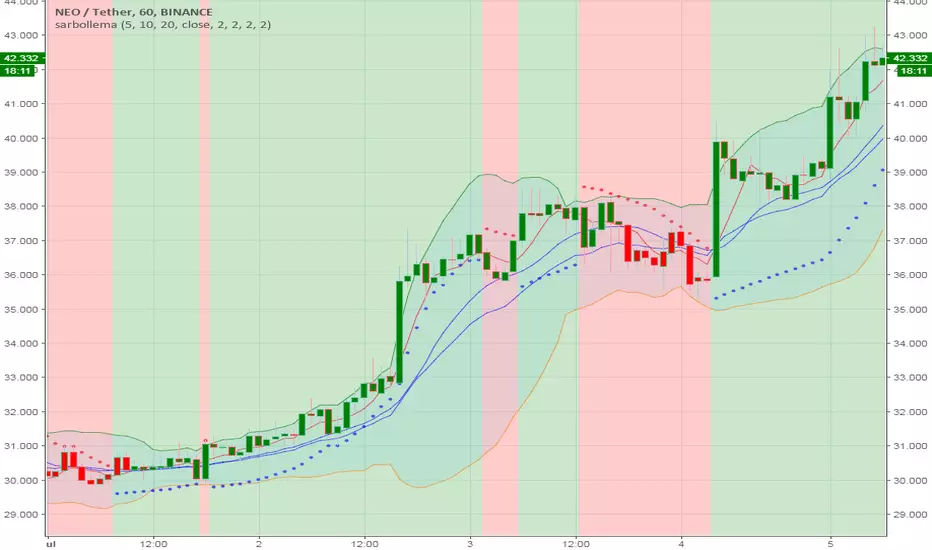
sarbollemav1same as the older version just added support and resistance level to make life more easy alerts inside for 2 buy points =sar cross and the other based on ema over ma Chỉ báo Pine Script®của RafaelZioni11115
PSAR Change Of Color AlertAlerts for PSAR Change In Value. PM for use.Chỉ báo Pine Script®của hexelbyte6661
sarbollemaThere is two buy points one based on ema cross MA= long short alert sar up or down= long1 short1 color change by change of sar and bollinger to have fun Chỉ báo Pine Script®của RafaelZioni182
PSARbackgroundThis is a visual representation of the 'Parabolic SAR' indicator through the color of the background. 이 지표는 배경 색을 통해 PSAR 지표를 시각적으로 나타낸 것입니다. For access, please press the button"agree" and leave a comment below. 사용권한을 원하시는분은 밑에 "동의" 버튼을 눌러주시고 아래 코멘트에 글을 남겨주세요Chỉ báo Pine Script®của UnknownUnicorn2384621404076
PSARbackground This is a visual representation of the 'Parabolic SAR' indicator through the color of the background. 이 지표는 배경 색을 통해 PSAR 지표를 시각적으로 나타낸 것입니다. How to get invited? => link ↓Chỉ báo Pine Script®của UnknownUnicorn2384621181874
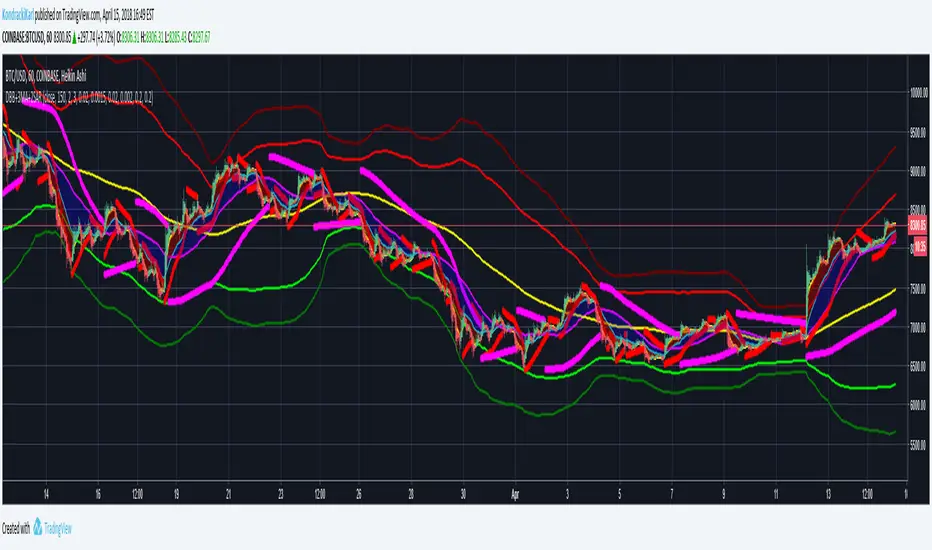
Double Bands, 3MA and 2SARMoving Averages (5,20,50), Double BollHello Made an indicator set that includes Moving Averages 5EMA, 20EMA, 50SMA, 200SMA Fill between 5-20 MA and 20-50MA Double Bollinger Bands Parabolic SAR x2 Multiple indicators for the cost of 1Chỉ báo Pine Script®của KondrackiKarl57
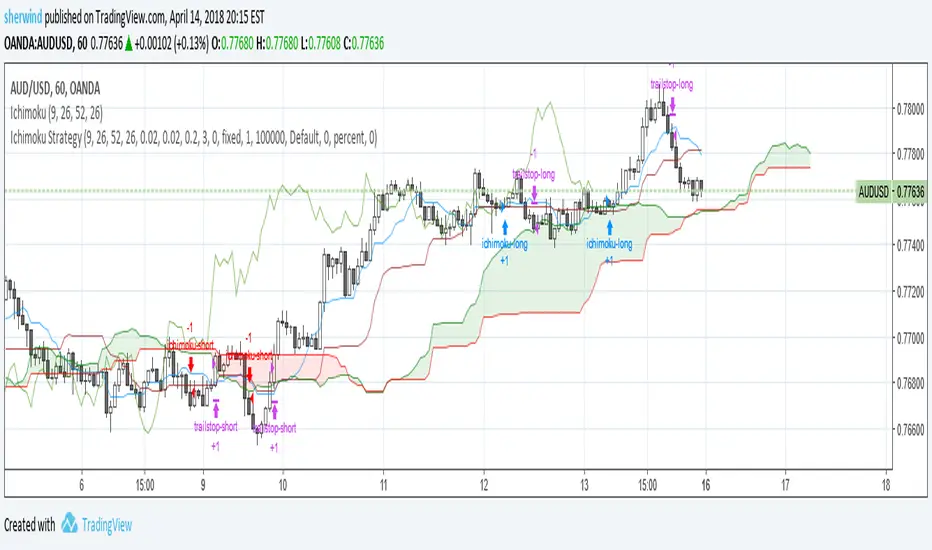
Ichimoku Cloud StrategyBased on the trading strategy described at stockcharts.com See Also: - Backtesting and forwardtesting (of TradingView Strategies) - 9 Mistakes Quants Make that Cause Backtests to Lie - When Backtests Meet Reality - Why MT4 backtesting does not work Chiến lược Pine Script®của sherwind11330
Shinkansen SAR ScalperRed = Last 8 Candle Support Green = Last 8 Candle Resistant Blue line is Parabolic SAR I'm glad if you happy to using this indicator and take more profit from scalp :DChỉ báo Pine Script®của rapdodge6628
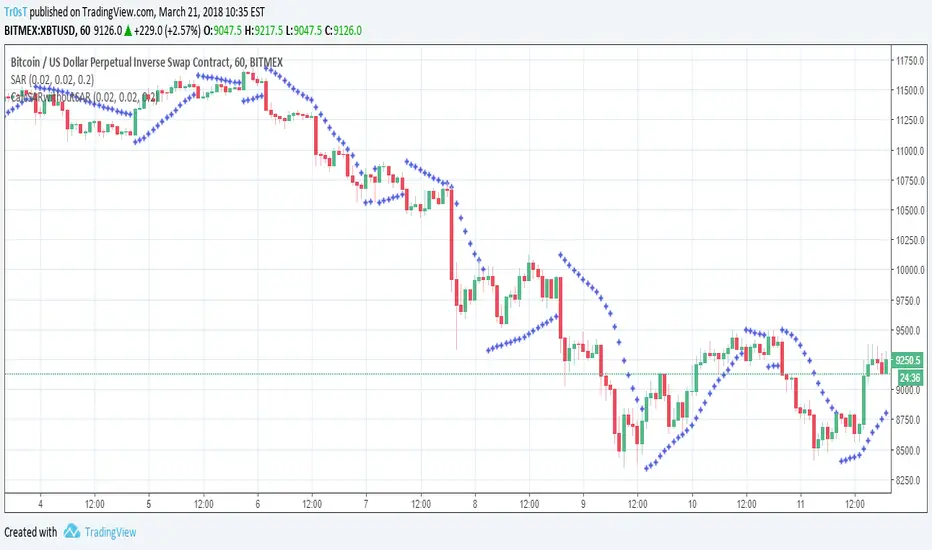
SAR formulaThis is how built-in S.A.R. indicator calculates S.A.R...Chỉ báo Pine Script®của Tr0sT1212225
Parabolic SAR StrategyParabolic SAR strategy with a couple of extra features. Developed as a professional service and published for customer verification/approval. Please visit the backtest-rookies (.com) website if you are interested in development services Features Parabolic SAR stop entry strategy. Backtesting Ranges and dates for testing over specific regimes/periods Long only or dual direction inputs Chiến lược Pine Script®của BacktestRookies77138
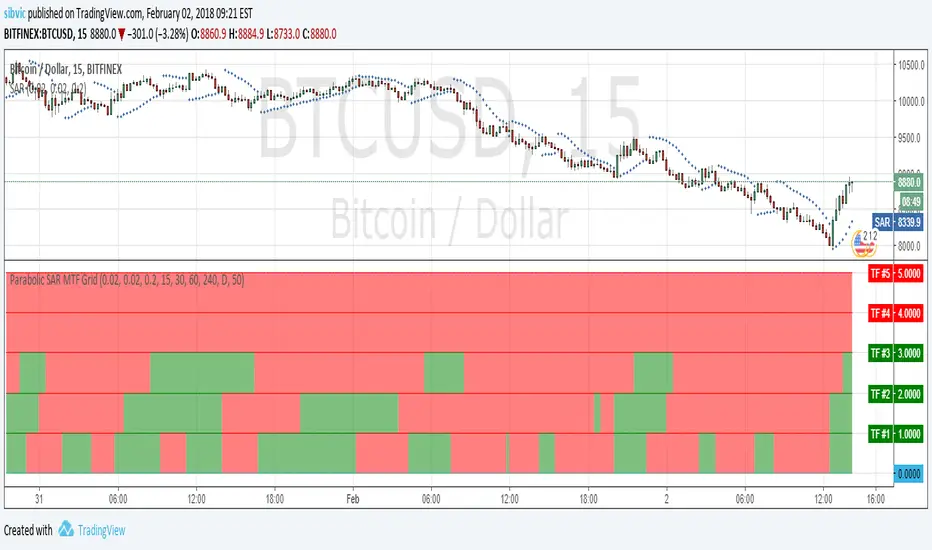
Parabolic SAR MTF GridShow a grid with Parabolic SAR in 5 timeframes. Shows an alert when the Parabolic SAR show the same direction for all 5 timeframes.Chỉ báo Pine Script®của sibvicCập nhật 1313508
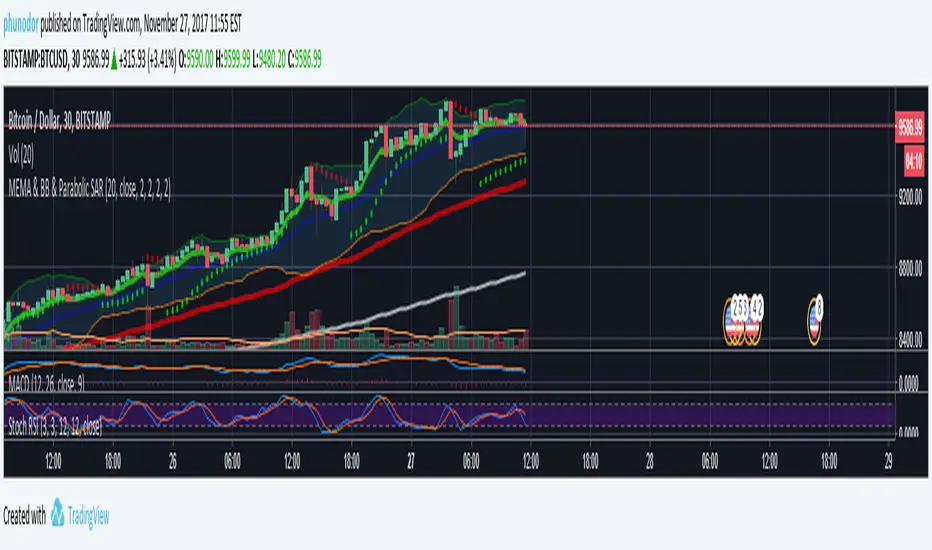
MEMA & BB & Parabolic SARMultiple Exponential Moving Average : 7, 77, 231 Bollinger Bands Parabolic SARChỉ báo Pine Script®của phunodor11501
Crypto-Adjusted Parabolic Stop and Reverse (CAPSAR)Finally, a more accurate PSAR is here! This PSAR will show up , and stick around when a majority of the Crypto-Currencies in the index below conform in the same direction. The CAPSAR can be applied to any Crypto-currency and ANY time-frame! This Crypto-Index makes up over 90% of the Crypto-Currency market cap (total global Crypto investment). Bitcoin Ethereum Bitcoin Cash Ripple Litecoin Nemcoin Thick Blue lines beneath the price indicate a change in direction, and momentum up. Thick Red lines above the price indicate a change in direction, and momentum down. This indicators holds three editable parameters: 1. "Start" - The starting value for the Acceleration Factor (.02 is the Default). 2. "Increment" = The increment in which the Acceleration Factor will move (.02 is Default). 3. "Max" - The maximum value of the Acceleration Factor (.20 is the Default)Chỉ báo Pine Script®của GrantPeace8686329
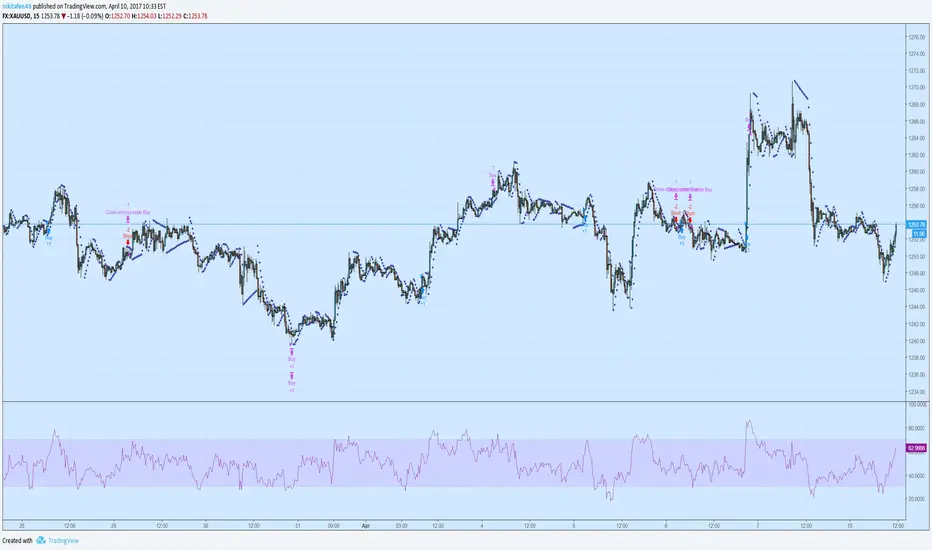
Generation 4 Gold Strategy UpgradedUp to date in all my scripts, this is the best strategy so far. Previously, there was profit in the mid 100s in % over 3 months. Now, that is 224% net profit over 3 months - granted, this is slightly more because this one has been testing for a week longer than the last one. Instead of a 30% success rate, that is now 55%. Instead of a 16.5% drawdown, that is now 13.5%. Overall, this is simply a more refined version of the previous strategies. I added the Parabolic SARS indicator, the RSI, and mixed up my exponential and simple moving averages, and voila - 223% net profit in 13 weeks. Protected script, so add to your favorites and insert into XAUUSD 15m chart. Chiến lược Pine Script®của MtxTrader44231
Magic Circles V3Magic Circles indicator uses an ATR based trend indicator in conjunction with a Parabolic SAR indicator for creating signals. Blue is neutral. Green is buy and red is sell. A hollow green circle followed by a regular green indicates a strong buy while a hollow red circle followed by a regular red one indicates a strong sell signal. This version gives you the option to choose your own magic number. Default is 1.618 also known as the golden ratio. The indicator works best at trending markets. Version 3 comes with ADX filtering to avoid misleading signals and set on by default. Also you can now see the support / resistance levels. Another option added is showing the current trend direction. ADX is Average Directional Index and founded by Welles Wilder. Wilder published his work in his book titled New Concepts in Technical Trading Systems (1978).Chỉ báo Pine Script®của rollas88289
Magic Circles V2Thanks for your feedback in regard to the Magic Circles indicator. As a common question, Magic Circles indicator uses an ATR based trend indicator in conjunction with a Parabolic SAR indicator for creating signals. Blue is neutral. Green is buy and red is sell. A hollow green circle followed by a regular green indicates a strong buy while a hollow red circle followed by a regular red one indicates a strong sell signal. This version gives you the option to choose your own magic number. Default is 1.618 also known as the golden ratio. The indicator works best at trending markets.Chỉ báo Pine Script®của rollas22129
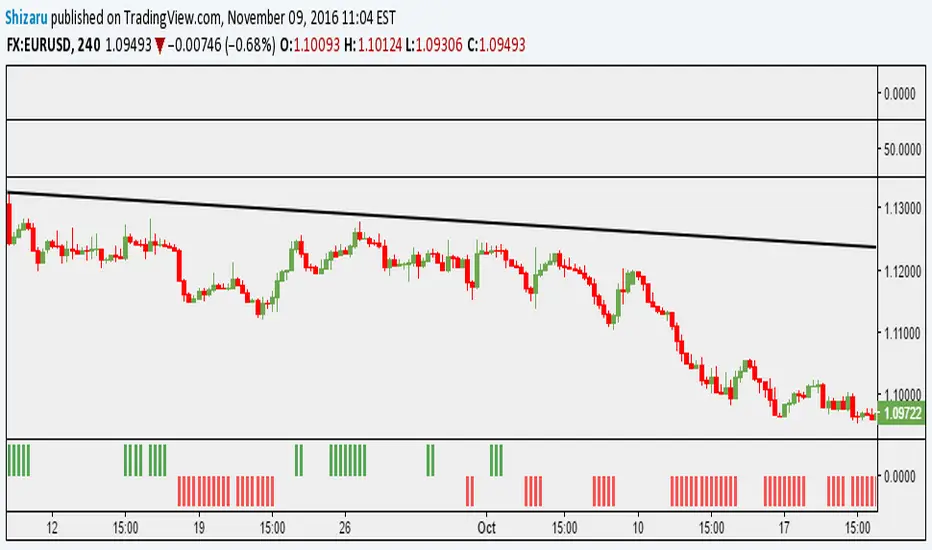
SMACH Indicator v1.0SMACH Indicator uses 3 signals from MACD, STOCHASTIC and PARABOLIC SAR. Histogram represents trend direction. If it is greater than 2 or lesser than -2 trend is consolidated and you can trade. I'm the author of this simple indicator. Feel free to use it as you want. Follow me on Trading View if you want to be updated on more ideas. Thanks! Chỉ báo Pine Script®của Shizaru22350
Simple Buy/Sell IndicatorThe original script was posted on ProRealCode by user Doctrading. This little and simple code allows you to draw an indicator, which show you when buy or sell conditions are met. For "buy" conditions, I did just set : close > MM200 close > Parabolic SAR MACD > 0 RSI7 > 50 For "sell" conditions : the opposite. Of course, you can set what you want, in order to test your strategies. Of course, to be profitable, you must also set your trading rules (entry, stop loss, trailing stop, take profit, etc.) It's only an indicator, which doesn't show entry or exit rules.Chỉ báo Pine Script®của Shizaru11 1.1 K