Các điểm Pivot

TTM scalper indicator Backtest TTM scalper indicator of John Carter’s Scalper Buys and Sells. The methodology
is a close approximation of the one described in his book Mastering the Trade.
The book is highly recommended. Note the squares are not real-time but will
show up once the third bar has confirmed a reversal.
You can change long to short in the Input Settings
WARNING:
- For purpose educate only
- This script to change bars colors.

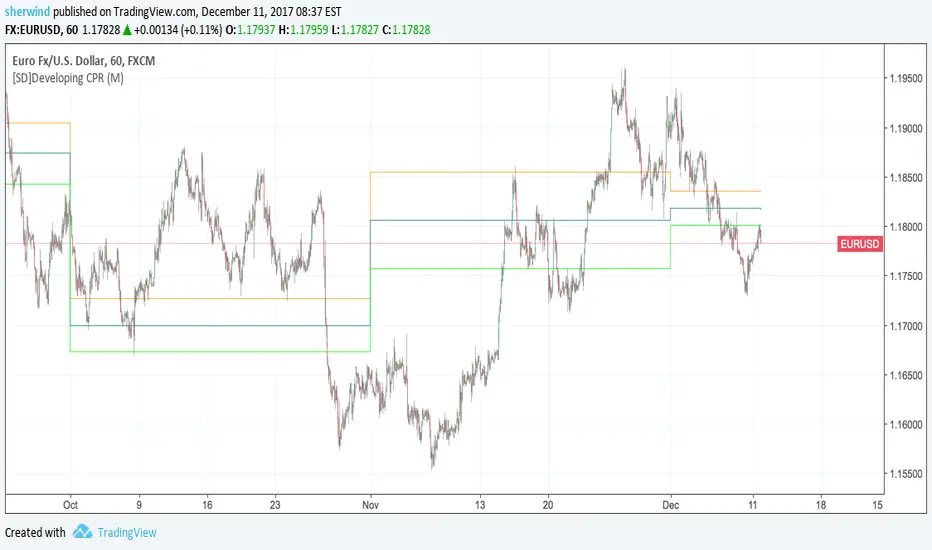
SD - Developing Central Pivot RangeThis script implements a developing version of Central Pivot Range.
Inputs:
Developing 'CPR' resolution - Either D (Daily), W (Weekly), M (Monthly) or 12M (Yearly). The default value is M.
On Balance True Range and Kalman FilterThis is a modification of On Balance True Range where the plot is made on the chart based on VWAP. Getting the previous day values of this logic is useful in determining the major pivot points during the day. The intra day VWAP is also plotted to know if the price is being traded above or below the average price.
The script also has a Kalman Filter based moving average that acts as a short term moving average.

High_Low_ProjectionHigh Low Projections of daily/weekly/quarterly/yearly price movement. Dark/night mode version. Green when broken through to upside, red when broken through to bottom side.


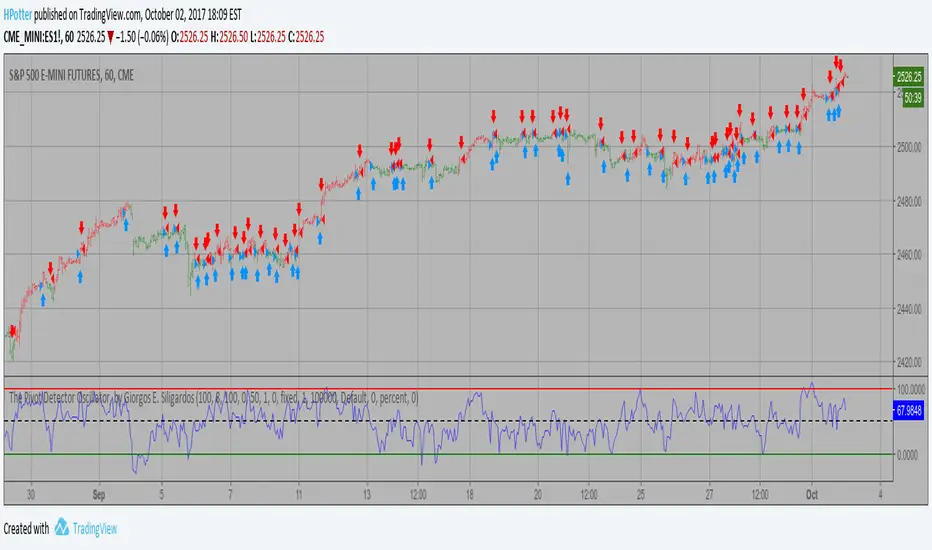
The Pivot Detector Oscillator Backtest The Pivot Detector Oscillator, by Giorgos E. Siligardos
The related article is copyrighted material from Stocks & Commodities 2009 Sep
You can change long to short in the Input Settings
WARNING:
- For purpose educate only
- This script to change bars colors.
Pivot alerts by Funded-TraderThis indicator draws Standard Pivot Levels on all products on all timeframes.
The P Pivot is included, and it goes as far as R3 and S3, as pivots 4 and 5 are rarely reached in the market.
This indicator differs from the "Standard Pivot" published by TradingView as this can be used to set-up an Alert: just add a new alert, pick "crossing" and in value pick "Pivot Alerts"
I have chosen a neutral colour Orange for all pivot levels.

The Pivot Detector Oscillator Strategy The Pivot Detector Oscillator, by Giorgos E. Siligardos
The related article is copyrighted material from Stocks & Commodities 2009 Sep
WARNING:
- This script to change bars colors.

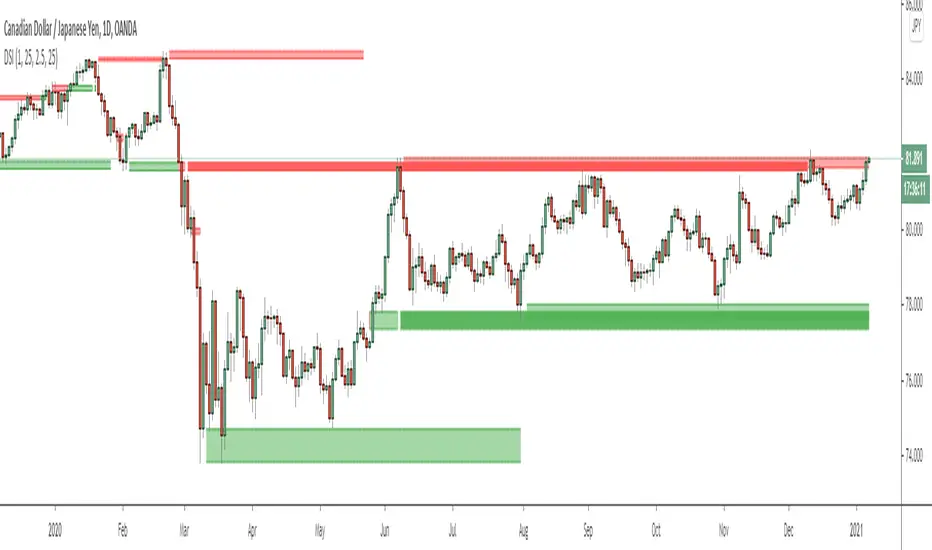
Dynamic Structure IndicatorThis is a dynamic structure indicator designed to map potential support and resistance zones (in all markets). It does this by looking back x amount of candles to identify major swing highs and lows on the specified reference timeframe, and then it draws a zone between the highest/lowest wick and the highest/lowest candle close across the chart until a new zone is created.
The settings are important because it gathers data from a separate reference timeframe, so sometimes it will map zones that aren’t really appropriate for lower timeframes. On lower timeframes (1Hr and under) I’d recommend setting the reference timeframe to your actual trading timeframe and increasing the lookback period to fine-tune the zone mapping. The script is set for 4 Hour forex charts by default.
Please note: the max zone option is disabled by default because it is different for every instrument, but this is a useful feature that I recommend using. Sometimes the indicator picks up huge gaps that aren’t really considered support or resistance zones. If this happens to you, use the zone size settings to invalidate huge (or tiny) zones. The zone size is in pips.
To be honest I didn’t get this indicator to be quite as accurate as I envisioned and it’s still a work in progress as I learn pine script, but this is the best I’ve been able to get it to function and with the right settings it works fairly well so I figured I might as well release this first version. Maybe someone with better skills than me can help refine it to more accurately identify major fractals and levels - if so, please get in touch! All traders should be able to identify their own major levels by eye anyway, but this script is intended to be a building block for future signal indicators I wish to develop.
Last of all - please don’t use this indicator to trade blindly! Often price will blast right through these zones and the zones aren’t always accurate. Remember that structure levels only work if they’re obvious to other traders, and always wait for confirmation signals that meet your trade plan rules before entering trades – especially reversals or counter-trend trades.
If you have any questions or tips to improve the script, feel free to leave a comment or private message me.
Enjoy, and good luck out there :)
- Matt.

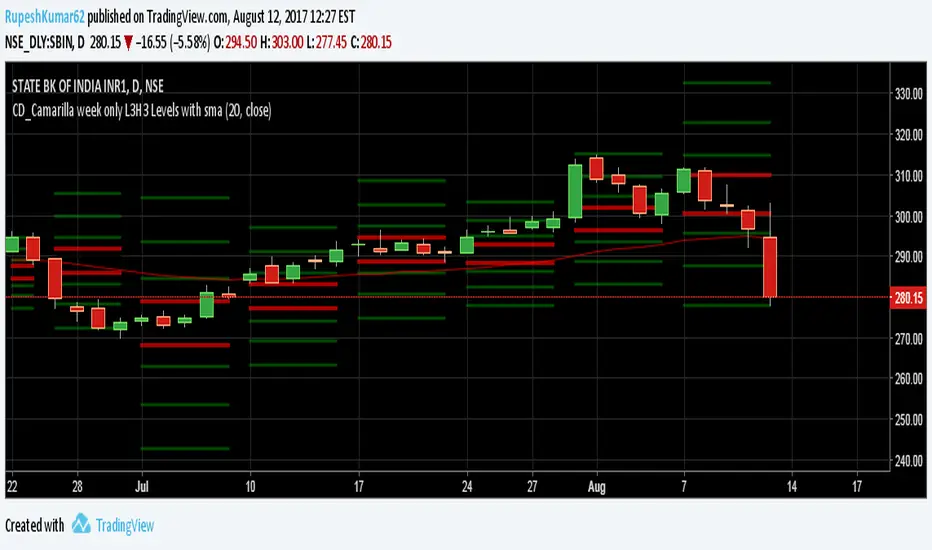
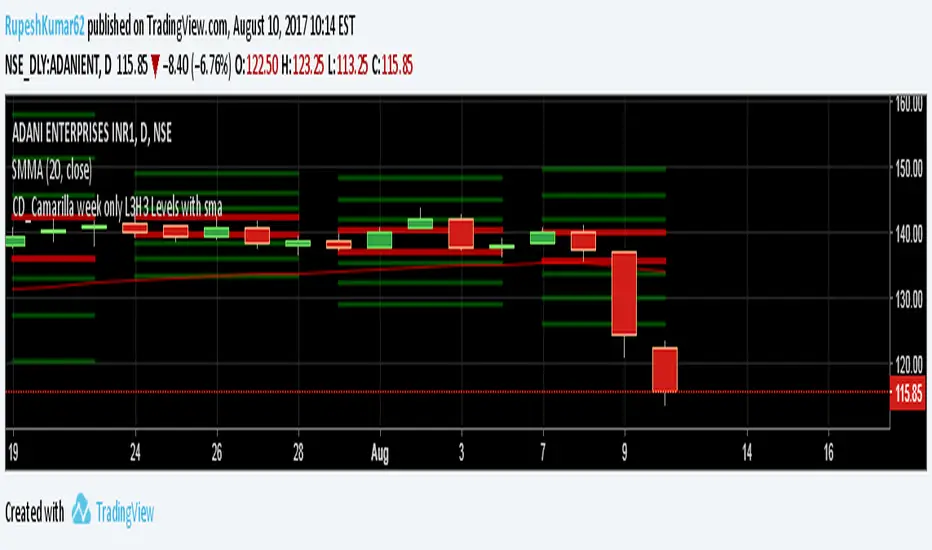

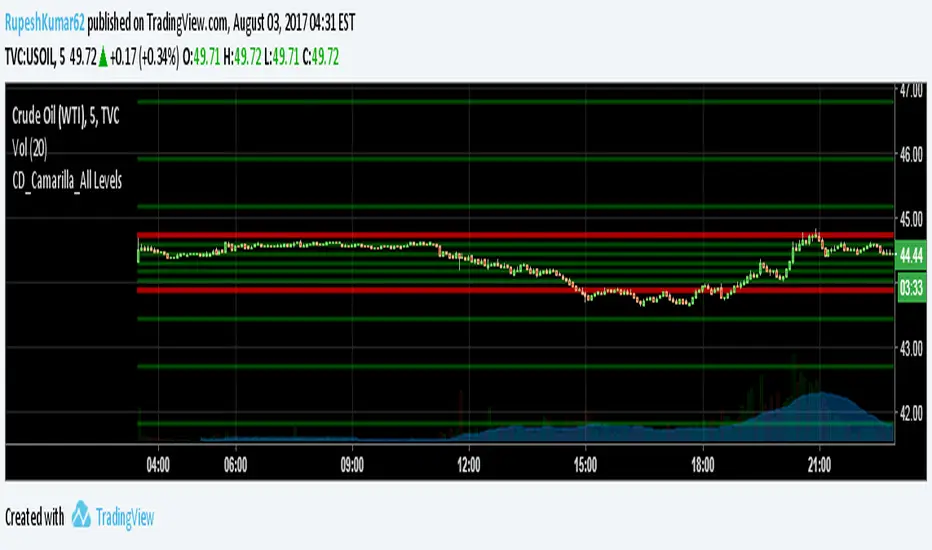
Camarilla all level with mid line This camrilla has mid line which is exact works as mid line of previous day

[naoligo] Pivot Points (Daily)Suporte/Resistência do Pivot diário para gráficos intraday
Marcação do S/R tradicional e S/R Fibonacci
Daily Pivot Point Support/Resistances on intraday charts
Both Traditional and Fibonacci methods plotted

Pivot Hilo Support n Resistance Levels R3-3 by JustUncleLThis is an update to the "Pivot HiLo Support n Resistance Levels" indicator, important updates are no re-painting; and different lengths available for each side of Pivot.
Description:
The Pivot Points are marked with "star" and with Optional Support and Resistance extension Levels shown.
Options:
Show Pivot Points (default true)
Pivot Length Left Side (default 7), the number of bars left hand side of the Pivot candle.
Pivot Length Right Side (default 3), the number of bars right hand side of the Pivot candle.
Show S/R Extension Levels (default true)
Maximum S/R Extension Length (default 0, no limit)
Show Pivot Labels (instead of "star") " " and " "
Revisions this release:
Added code to force Pivot to be always complete before drawing.
Added option for different length test for each side of Pivot.
Operación con Pivotes V.1.0 -BETA-Permite identificar puntos pivote diario, semanal y mensual e implementa la estrategia de Day of Reversal con RSI para identificar puntos de inflexión (compra o venta) en los instrumentos.

[PW]D/W/M/Y pivots with S/R levelsI could not find a pivots script that was entirely to my liking on TV so I re-worked this from the ' Shifted Pivots V1' script by RicardoSantos.
You can choose which timeframe pivots you would like to display from day, week, month, and year.
You can also choose how many levels of S/R you would like to show.

Scalping Swing Trading Tool R1-4 by JustUncleLDescription:
This study project is a "Scalping Swing trading Tool" and is an alternative to the "Scalping Pullback Tool R1". It is designed for a two pane TradingView chart layout :
the first pane set to 15min Time Frame;
the second pane set to 1min Time Frame(TF).
The tools incorporates the majority of the indicators needed to analyse and scalp Trends for Swings, PullBacks and reversals on 15min charts and 1min charts.
Incorporated within this tool are the following indicators:
1. The following EMAs are drawn automatically:
Green = EMA89 (15min TF) = EMA75 (1min TF)
Blue = EMA200 (15min TF) = EMA180 (1min TF)
Black = EMA633 (15min TF) = EMA540 (1min TF)
2. The 10EMA (default) High/Low+Close Price Action Channel (PAC), the PAC channel
display is disabled by default.
3. Optionally display Fractals and optional Fractal levels
4. Optional HH, LH, LL, HL finder.
5. Coloured coded Bar high lighting based on the PAC:
blue = bar closed above PAC
red = bar closed below PAC
gray = bar closed inside PAC
lime Line = EMA10 of bar close
6. Pivot points (disables Fractals automatically when selected) with optional labels.
7. EMA5-12 Channel is displayed by default.
8. EMA12-36 Ribbon is displayed by default
9. Optionally display EMA36 and PAC instead of EMA12-36 Ribbon.
Set up and hints:
I am unable to provide a full description here, as Pullback Trading incorporates a full trading Methodology, there are a number of articles and books written on the subject.
Set to two pane TradingView chart, set first pane to 15Min and second to 1min.
Set the chart to Heikin Ashi Candles (optional).
I also add a "Sweetspot Gold2" indicator to the chart as well to help with support and resistance finding and shows where the important "00" lines are.
Use the EMA200 on the 15min pane as the anchor. So when prices above EMA200 we only trade long (buy) and when prices below the EMA200 we only trade short (sell).
On the 15min chart draw any obvious Vertical Trend Lines (VTL), use Pivots point as a guide.
On the 15min chart what we’re looking for price to Pullback into the EMA5-12 Channel or EMA12-36 ribbon, we draw Trendlines uitilising the Pivot points or Fractals to guide your TL drawing.
On the 15min chart look for the trend to resume and break through the drawn TL. The bar color needs to change back to the trend direction colour to confirm as a break.
Now this break can be traded as a 15min trade or now look to the 1min chart.
On the 1min chart draw any Pullback into any of the EMAs.
On the 1min chart look for the trend to resume and break through the drawn TL. The bar color needs to change back to the trend direction colour to confirm as a break.
Now this break can be traded as a 1min trade.
There is also an option to select Pristine (ie Ideal) filtered Fractals, which look like tents or V shape 5-candle patterns. These are actually used to calculate the Pivot points as well.
Other than the "SweetSpot Gold2" indicator, you should not need any other indicator to successfully trade trends for Pullbacks and reversals. If you really want another indicator use the AO (Awesome Oscillator) as it is momentum based.

Pivots Daily Weekly Monthly YearlyDaily, Weekly, Monthly and yearly pivot lines
Just the pivot lines without the support and resistance lines

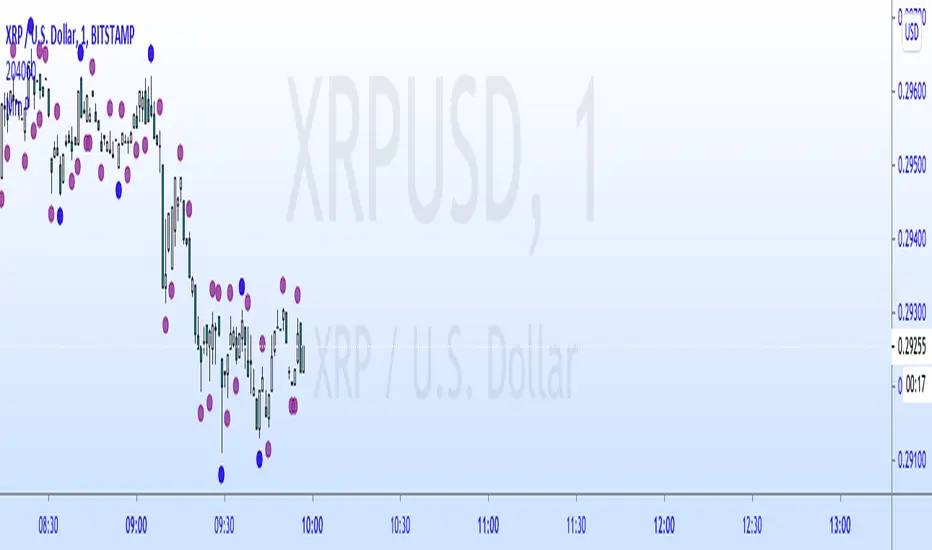
Major Minor Fib PointsHey guys I made this indicator that plots major and minor lows based on the candle duration since it's last seen a lower low or higher high.
I made this after watching a seminar and seeing it as a way to simply, easily and naturally find the plot points for fibonacci retracements and extentions.
Blue dots are Major, Purple are Minor.
The dots only appear if there has not been a newly established low or high in the default(13) periods (for Major) before or after that candle. This is done to make the pivot candle clear and less subjective. The periods are also changeable in the format icon.
Let me know what if you like/hate it. It's just another indicator and is only a visual tool. But I hope it helps. I hope it helps me as well!