Session Range by Black Dragon (Timezone + Days + Weekend)Session Range by Black Dragon (Timezone + Days + Weekend)
Range

ZynIQ Market Regime Master Pro v2 - (Pro Plus Pack)Overview
ZynIQ Market Regime Master Pro v2 identifies shifts in market conditions by analysing volatility, directional flow and structural behaviour. It highlights when the market transitions between trending, ranging, expansion and contraction phases, giving traders clearer context for decision making.
Key Features
• Multi-factor regime detection (trend, range, expansion, contraction)
• Adaptive volatility and momentum analysis
• Direction-aware colour transitions
• Optional HTF regime overlay
• Configurable sensitivity to match different markets
• Clean visuals suitable for intraday or swing trading
• Complements trend, breakout, liquidity and volume tools
Use Cases
• Determining whether the market is trending or ranging
• Identifying expansion phases vs contraction phases
• Filtering signals during unfavourable regimes
• Combining regime context with structure or breakout tools
Notes
This tool provides regime classification and contextual analysis. It is not a trading system by itself. Use with your own confirmation and risk management.

Session Opening Range Breakout (ORBO)This strategy automates a classic Opening Range Breakout (ORBO) approach: it builds a price range for the first minutes after the market opens, then looks for strong breakouts above or below that range to catch early directional moves.
Concept
The idea behind ORBO is simple:
The first minutes after the session open are often highly informative.
Price forms an “opening range” that acts as a mini support/resistance zone.
A clean breakout beyond this zone can lead to high-momentum moves.
This script turns that logic into a fully backtestable strategy in TradingView.
How the strategy works
Opening Range Session
Default session: 09:30–09:50 (exchange time)
During this window, the script tracks:
orHigh → highest high within the session
orLow → lowest low within the session
This forms your Opening Range for the day.
Breakout Logic (after the window ends)
Once the defined session ends:
Long Entry:
If the close crosses above the Opening Range High (orHigh),
→ strategy.entry("OR Long", strategy.long) is triggered.
Short Entry:
If the close crosses below the Opening Range Low (orLow),
→ strategy.entry("OR Short", strategy.short) is triggered.
Only one opening range per day is considered, which keeps the logic clean and easy to interpret.
Daily Reset
At the start of a new trading day, the script resets:
orHigh := na
orLow := na
A fresh Opening Range is then built using the next session’s 09:30–09:50 candles.
This ensures entries are always based on today’s structure, not yesterday’s.
Visuals & Inputs
Inputs:
Opening range session → default: "0930-0950"
Show OR levels → toggle visibility of OR High / Low lines
Fill range body → optional shaded zone between OR High and OR Low
Chart visuals:
A green line marks the Opening Range High.
A red line marks the Opening Range Low.
Optional yellow fill highlights the entire OR zone.
Background shading during the session shows when the range is currently being built.
These visuals make it easy to see:
Where the OR sits relative to current price
How clean / noisy the breakout was
How often price respects or rejects the opening zone
Backtesting & Optimization
Because this is written as a strategy():
You can use TradingView’s Strategy Tester to view:
Win rate
Net profit
Drawdown
Profit factor
Equity curve
Ideas to experiment with:
Change the session window (e.g., 09:15–09:45, 10:00–10:30)
Apply to different:
Markets: indices, FX, crypto, stocks
Timeframes: 1m / 5m / 15m
Add your own:
Stop Loss & Take Profit levels
Time filters (only trade certain days / times)
Volatility filters (e.g., ATR, range size thresholds)
Higher-timeframe trend filter (e.g., only take longs above 200 EMA)

ZynIQ Breakout Lite v1.2 - (Lite Pack)Overview
ZynIQ Breakout Lite v1.2 provides a streamlined breakout framework designed to highlight expansion moves from short-term consolidation. It focuses on clarity and simplicity, making it suitable for intraday and swing trading.
Key Features
• Breakout range detection based on a configurable lookback period
• Optional minimum candle-range filter
• Simple signal spacing to reduce clustered signals
• Direction-aware breakout triggers (non-repainting)
• Optional ZynIQ Risk Helper for structured SL/TP planning
• Optional HUD panel showing current settings and breakout context
Use Cases
• Identifying range breakouts
• Highlighting directional shifts
• Quickly assessing breakout structure with lightweight visuals
Notes
This tool assists with breakout structure and risk planning. It is not a trading system by itself. Use with your preferred confirmation tools and risk management.
Superior-Range Bound Renko - Alerts - 11-29-25 - Signal LynxSuperior-Range Bound Renko – Alerts Edition with Advanced Risk Management Template
Signal Lynx | Free Scripts supporting Automation for the Night-Shift Nation 🌙
1. Overview
This is the Alerts & Indicator Edition of Superior-Range Bound Renko (RBR).
The Strategy version is built for backtesting inside TradingView.
This Alerts version is built for automation: it emits clean, discrete alert events that you can route into webhooks, bots, or relay engines (including your own Signal Lynx-style infrastructure).
Under the hood, this script contains the same core engine as the strategy:
Adaptive Range Bounding based on volatility
Renko Brick Emulation on standard candles
A stack of Laguerre Filters for impulse detection
K-Means-style Adaptive SuperTrend for trend confirmation
The full Signal Lynx Risk Management Engine (state machine, layered exits, AATS, RSIS, etc.)
The difference is in what we output:
Instead of placing historical trades, this version:
Plots the entry and RM signals in a separate pane (overlay = false)
Exposes alertconditions for:
Long Entry
Short Entry
Close Long
Close Short
TP1, TP2, TP3 hits (Staged Take Profit)
This makes it ideal as the signal source for automated execution via TradingView Alerts + Webhooks.
2. Quick Action Guide (TL;DR)
Best Timeframe:
4H and above. This is a swing-trading / position-trading style engine, not a micro-scalper.
Best Assets:
Volatile but structured markets, e.g.:
BTC, ETH, XAUUSD (Gold), GBPJPY, and similar high-volatility majors or indices.
Script Type:
indicator() – Alerts & Visualization Only
No built-in order placement
All “orders” are emitted as alerts for your external bot or manual handling
Strategy Type:
Volatility-Adaptive Trend Following + Impulse Detection
using Renko-like structure and multi-layer Laguerre filters.
Repainting:
Designed to be non-repainting on closed candles.
The underlying Risk Management engine is built around previous-bar data (close , high , low ) for execution-critical logic.
Intrabar values can move while the bar is forming (normal for any advanced signal), but once a bar closes, the alert logic is stable.
Recommended Alert Settings:
Condition: one of the built-in signals (see section 3.B)
Options: “Once Per Bar Close” is strongly recommended for automation
Message: JSON, CSV, or simple tokens – whatever your webhook / relay expects
3. Detailed Report: How the Alerts Edition Works
A. Relationship to the Strategy Version
The Alerts Edition shares the same internal logic as the strategy version:
Same Adaptive Lookback and volatility normalization
Same Range and Close Range construction
Same Renko Brick Emulator and directional memory (renkoDir)
Same Fib structures, Laguerre stack, K-Means SuperTrend, and Baseline signals (B1, B2)
Same Risk Management Engine and layered exits
In the strategy script, these signals are wired into strategy.entry, strategy.exit, and strategy.close.
In the alerts script:
We still compute the final entry/exit signals (Fin, CloseEmAll, TakeProfit1Plot, etc.)
Instead of placing trades, we:
Plot them for visual inspection
Expose them via alertcondition(...) so that TradingView can fire alerts.
This ensures that:
If you use the same settings on the same symbol/timeframe, the Alerts Edition and Strategy Edition agree on where entries and exits occur.
(Subject only to normal intrabar vs. bar-close differences.)
B. Signals & Alert Conditions
The alerts script focuses on discrete, automation-friendly events.
Internally, the main signals are:
Fin – Final entry decision from the RM engine
CloseEmAll – RM-driven “hard close” signal (for full-position exits)
TakeProfit1Plot / 2Plot / 3Plot – One-time event markers when each TP stage is hit
On the chart (in the separate indicator pane), you get:
plot(Fin) – where:
+2 = Long Entry event
-2 = Short Entry event
plot(CloseEmAll) – where:
+1 = “Close Long” event
-1 = “Close Short” event
plot(TP1/TP2/TP3) (if Staged TP is enabled) – integer tags for TP hits:
+1 / +2 / +3 = TP1 / TP2 / TP3 for Longs
-1 / -2 / -3 = TP1 / TP2 / TP3 for Shorts
The corresponding alertconditions are:
Long Entry
alertcondition(Fin == 2, title="Long Entry", message="Long Entry Triggered")
Fire this to open/scale a long position in your bot.
Short Entry
alertcondition(Fin == -2, title="Short Entry", message="Short Entry Triggered")
Fire this to open/scale a short position.
Close Long
alertcondition(CloseEmAll == 1, title="Close Long", message="Close Long Triggered")
Fire this to fully exit a long position.
Close Short
alertcondition(CloseEmAll == -1, title="Close Short", message="Close Short Triggered")
Fire this to fully exit a short position.
TP 1 Hit
alertcondition(TakeProfit1Plot != 0, title="TP 1 Hit", message="TP 1 Level Reached")
First staged take profit hit (either long or short). Your bot can interpret the direction based on position state or message tags.
TP 2 Hit
alertcondition(TakeProfit2Plot != 0, title="TP 2 Hit", message="TP 2 Level Reached")
TP 3 Hit
alertcondition(TakeProfit3Plot != 0, title="TP 3 Hit", message="TP 3 Level Reached")
Together, these give you a complete trade lifecycle:
Open Long / Short
Optionally scale out via TP1/TP2/TP3
Close remaining via Close Long / Close Short
All while the Risk Management Engine enforces the same logic as the strategy version.
C. Using This Script for Automation
This Alerts Edition is designed for:
Webhook-based bots
Execution relays (e.g., your own Lynx-Relay-style engine)
Dedicated external trade managers
Typical setup flow:
Add the script to your chart
Same symbol, timeframe, and settings you use in the Strategy Edition backtests.
Configure Inputs:
Longs / Shorts enabled
Risk Management toggles (SL, TS, Staged TP, AATS, RSIS)
Weekend filter (if you do not want weekend trades)
RBR-specific knobs (Adaptive Lookback, Brick type, ATR vs Standard Brick, etc.)
Create Alerts for Each Event Type You Need:
Long Entry
Short Entry
Close Long
Close Short
TP1 / TP2 / TP3 (optional, if your bot handles partial closes)
For each:
Condition: the corresponding alertcondition
Option: “Once Per Bar Close” is strongly recommended
Message:
You can use structured JSON or a simple token set like:
{"side":"long","event":"entry","symbol":"{{ticker}}","time":"{{timenow}}"}
or a simpler text for manual trading like:
LONG ENTRY | {{ticker}} | {{interval}}
Wire Up Your Bot / Relay:
Point TradingView’s webhook URL to your execution engine
Parse the messages and map them into:
Exchange
Symbol
Side (long/short)
Action (open/close/partial)
Size and risk model (this script does not position-size for you; it only signals when, not how much.)
Because the alerts come from a non-repainting, RM-backed engine that you’ve already validated via the Strategy Edition, you get a much cleaner automation pipeline.
D. Repainting Protection (Alerts Edition)
The same protections as the Strategy Edition apply here:
Execution-critical logic (trailing stop, TP triggers, SL, RM state changes) uses previous bar OHLC:
open , high , low , close
No security() with lookahead or future-bar dependencies.
This means:
Alerts are designed to fire on states that would have been visible at bar close, not on hypothetical “future history.”
Important practical note:
Intrabar: While a bar is forming, internal conditions can oscillate.
Bar Close: With “Once Per Bar Close” alerts, the fired signal corresponds to the final state of the engine for that candle, matching your Strategy Edition expectations.
4. For Developers & Modders
You can treat this Alerts script as an ”RM + Alert Framework” and inject any signal logic you want.
Where to plug in:
Find the section:
// BASELINE & SIGNAL GENERATION
You’ll see how B1 and B2 are built from the RBR stack and then combined:
baseSig = B2
altSig = B1
finalSig = sigSwap ? baseSig : altSig
To use your own logic:
Replace or wrap the code that sets baseSig / altSig with your own conditions:
e.g., RSI, MACD, Heikin Ashi filters, candle patterns, volume filters, etc.
Make sure your final decision is still:
2 → Long / Buy signal
-2 → Short / Sell signal
0 → No trade
finalSig is then passed into the RM engine and eventually becomes Fin, which:
Drives the Long/Short Entry alerts
Interacts with the RM state machine to integrate properly with AATS, SL, TS, TP, etc.
Because this script already exposes alertconditions for key lifecycle events, you don’t need to re-wire alerts each time — just ensure your logic feeds into finalSig correctly.
This lets you use the Signal Lynx Risk Management Engine + Alerts wrapper as a drop-in chassis for your own strategies.
5. About Signal Lynx
Automation for the Night-Shift Nation 🌙
Signal Lynx builds tools and templates that help traders move from:
“I have an indicator” → “I have a structured, automatable strategy with real risk management.”
This Superior-Range Bound Renko – Alerts Edition is the automation-focused companion to the Strategy Edition. It’s designed for:
Traders who backtest with the Strategy version
Then deploy live signals with this Alerts version via webhooks or bots
While relying on the same non-repainting, RM-driven logic
We release this code under the Mozilla Public License 2.0 (MPL-2.0) to support the Pine community with:
Transparent, inspectable logic
A reusable Risk Management template
A reference implementation of advanced adaptive logic + alerts
If you are exploring full-stack automation (TradingView → Webhooks → Exchange / VPS), keep Signal Lynx in your search.
License: Mozilla Public License 2.0 (Open Source).
If you build improvements or helpful variants, please consider sharing them back with the community.

Superior-Range Bound Renko - Strategy - 11-29-25 - SignalLynxSuperior-Range Bound Renko Strategy with Advanced Risk Management Template
Signal Lynx | Free Scripts supporting Automation for the Night-Shift Nation 🌙
1. Overview
Welcome to Superior-Range Bound Renko (RBR) — a volatility-aware, structure-respecting swing-trading system built on top of a full Risk Management (RM) Template from Signal Lynx.
Instead of relying on static lookbacks (like “14-period RSI”) or plain MA crosses, Superior RBR:
Adapts its range definition to market volatility in real time
Emulates Renko Bricks on a standard, time-based chart (no Renko chart type required)
Uses a stack of Laguerre Filters to detect genuine impulse vs. noise
Adds an Adaptive SuperTrend powered by a small k-means-style clustering routine on volatility
Under the hood, this script also includes the full Signal Lynx Risk Management Engine:
A state machine that separates “Signal” from “Execution”
Layered exit tools: Stop Loss, Trailing Stop, Staged Take Profit, Advanced Adaptive Trailing Stop (AATS), and an RSI-style stop (RSIS)
Designed for non-repainting behavior on closed candles by basing execution-critical logic on previous-bar data
We are publishing this as an open-source template so traders and developers can leverage a professional-grade RM engine while integrating their own signal logic if they wish.
2. Quick Action Guide (TL;DR)
Best Timeframe:
4 Hours (H4) and above. This is a high-conviction swing-trading system, not a scalper.
Best Assets:
Volatile instruments that still respect market structure:
Bitcoin, Ethereum, Gold (XAUUSD), high-volatility Forex pairs (e.g., GBPJPY), indices with clean ranges.
Strategy Type:
Volatility-Adaptive Trend Following + Impulse Detection.
It hunts for genuine expansion out of ranges, not tiny mean-reversion nibbles.
Key Feature:
Renko Emulation on time-based candles.
We mathematically model Renko Bricks and overlay them on your standard chart to define:
“Equilibrium” zones (inside the brick structure)
“Breakout / impulse” zones (when price AND the impulse line depart from the bricks)
Repainting:
Designed to be non-repainting on closed candles.
All RM execution logic uses confirmed historical data (no future bars, no security() lookahead). Intrabar flicker during formation is allowed, but once a bar closes the engine’s decisions are stable.
Core Toggles & Filters:
Enable Longs and Shorts independently
Optional Weekend filter (block trades on Saturday/Sunday)
Per-module toggles: Stop Loss, Trailing Stop, Staged Take Profits, AATS, RSIS
3. Detailed Report: How It Works
A. The Strategy Logic: Superior RBR
Superior RBR builds its entry signal from multiple mathematical layers working together.
1) Adaptive Lookback (Volatility Normalization)
Instead of a fixed 100-bar or 200-bar range, the script:
Computes ATR-based volatility over a user-defined period.
Normalizes that volatility relative to its recent min/max.
Maps the normalized value into a dynamic lookback window between a minimum and maximum (e.g., 4 to 100 bars).
High Volatility:
The lookback shrinks, so the system reacts faster to explosive moves.
Low Volatility:
The lookback expands, so the system sees a “bigger picture” and filters out chop.
All the core “Range High/Low” and “Range Close High/Low” boundaries are built on top of this adaptive window.
2) Range Construction & Quick Ranges
The engine constructs several nested ranges:
Outer Range:
rangeHighFinal – dynamic highest high
rangeLowFinal – dynamic lowest low
Inner Close Range:
rangeCloseHighFinal – highest close
rangeCloseLowFinal – lowest close
Quick Ranges:
“Half-length” variants of those, used to detect more responsive changes in structure and volatility.
These ranges define:
The macro box price is trading inside
Shorter-term “pressure zones” where price is coiling before expansion
3) Renko Emulation (The Bricks)
Rather than using the Renko chart type (which discards time), this script emulates Renko behavior on your normal candles:
A “brick size” is defined either:
As a standard percentage move, or
As a volatility-driven (ATR) brick, optionally inhibited by a minimum standard size
The engine tracks a base value and derives:
brickUpper – top of the emulated brick
brickLower – bottom of the emulated brick
When price moves sufficiently beyond those levels, the brick “shifts”, and the directional memory (renkoDir) updates:
renkoDir = +2 when bricks are advancing upward
renkoDir = -2 when bricks are stepping downward
You can think of this as a synthetic Renko tape overlaid on time-based candles:
Inside the brick: equilibrium / consolidation
Breaking away from the brick: momentum / expansion
4) Impulse Tracking with Laguerre Filters
The script uses multiple Laguerre Filters to smooth price and brick-derived data without traditional lag.
Key filters include:
LagF_1 / LagF_W: Based on brick upper/lower baselines
LagF_Q: Based on HLCC4 (high + low + 2×close)/4
LagF_Y / LagF_P: Complex averages combining brick structures and range averages
LagF_V (Primary Impulse Line):
A smooth, high-level impulse line derived from a blend of the above plus the outer ranges
Conceptually:
When the impulse line pushes away from the brick structure and continues in one direction, an impulse move is underway.
When its direction flips and begins to roll over, the impulse is fading, hinting at mean reversion back into the range.
5) Fib-Based Structure & Swaps
The system also layers in Fib levels derived from the adaptive ranges:
Standard levels (12%, 23.6%, 38.2%, 50%, 61%, 76.8%, 88%) from the main range
A secondary “swap” set derived from close-range dynamics (fib12Swap, fib23Swap, etc.)
These Fibs are used to:
Bucket price into structural zones (below 12, between 23–38, etc.)
Detect breakouts when price and Laguerre move beyond key Fib thresholds
Drive zSwap logic (where a secondary Fib set becomes the active structure once certain conditions are met)
6) Adaptive SuperTrend with K-Means-Style Volatility Clustering
Under the hood, the script uses a small k-means-style clustering routine on ATR:
ATR is measured over a fixed period
The range of ATR values is split into Low, Medium, High volatility centroids
Current ATR is assigned to the nearest centroid (cluster)
From that, a SuperTrend variant (STK) is computed with dynamic sensitivity:
In quiet markets, SuperTrend can afford to be tighter
In wild markets, it widens appropriately to avoid constant whipsaw
This SuperTrend-based oscillator (LagF_K and its signals) is then combined with the brick and Laguerre stack to confirm valid trend regimes.
7) Final Baseline Signals (+2 / -2)
The “brain” of Superior RBR lives in the Baseline & Signal Generation block:
Two composite signals are built: B1 and B2:
They combine:
Fib breakouts
Renko direction (renkoDir)
Expansion direction (expansionQuickDir)
Multiple Laguerre alignments (LagF_Q, LagF_W, LagF_Y, LagF_Z, LagF_P, LagF_V)
They also factor in whether Fib structures are expanding or contracting.
A user toggle selects the “Baseline” signal:
finalSig = B2 (default) or B1 (alternate baseline)
finalSig is then filtered through the RM state machine and only when everything aligns, we emit:
+2 = Long / Buy signal
-2 = Short / Sell signal
0 = No new trade
Those +2 / -2 values are what feed the Risk Management Engine.
B. The Risk Management (RM) Engine
This script features the Signal Lynx Risk Management Engine, a proprietary state machine built to separate Signal from Execution.
Instead of firing orders directly on indicator conditions, we:
Convert the raw signal into a clean integer (Fin = +2 / -2 / 0)
Feed it into a Trade State Machine that understands:
Are we flat?
Are we in a long or short?
Are we in a closing sequence?
Should we permit re-entry now or wait?
Logic Injection / Template Concept:
The RM engine expects a simple integer:
+2 → Buy
-2 → Sell
Everything else (0) is “no new trade”
This makes the script a template:
You can remove the Superior RBR block
Drop in your own logic (RSI, MACD, price action, etc.)
As long as you output +2 or -2 into the same signal channel, the RM engine can drive all exits and state transitions.
Aggressive vs Conservative Modes:
The input AgressiveRM (Aggressive RM) governs how we interpret signals:
Conservative Mode (Aggressive RM = false):
Uses a more filtered internal signal (AF) to open trades
Effectively waits for a clean trend flip / confirmation before new entries
Minimizes whipsaw at the cost of fewer trades
Aggressive Mode (Aggressive RM = true):
Reacts directly to the fresh alert (AO) pulses
Allows faster re-entries in the same direction after RM-based exits
Still respects your pyramiding setting; this script ships with pyramiding = 0 by default, so it will not stack multiple positions unless you change that parameter in the strategy() call.
The state machine enforces discipline on top of your signal logic, reducing double-fires and signal spam.
C. Advanced Exit Protocols (Layered Defense)
The exit side is where this template really shines. Instead of a single “take profit or stop loss,” it uses multiple, cooperating layers.
1) Hard Stop Loss
A classic percentage-based Stop Loss (SL) relative to the entry price.
Acts as a final “catastrophic protection” layer for unexpected moves.
2) Standard Trailing Stop
A percentage-based Trailing Stop (TS) that:
Activates only after price has moved a certain percentage in your favor (tsActivation)
Then trails price by a configurable percentage (ts)
This is a straightforward, battle-tested trailing mechanism.
3) Staged Take Profits (Three Levels)
The script supports three staged Take Profit levels (TP1, TP2, TP3):
Each stage has:
Activation percentage (how far price must move in your favor)
Trailing amount for that stage
Position percentage to close
Example setup:
TP1:
Activate at +10%
Trailing 5%
Close 10% of the position
TP2:
Activate at +20%
Trailing 10%
Close another 10%
TP3:
Activate at +30%
Trailing 5%
Close the remaining 80% (“runner”)
You can tailor these quantities for partial scaling out vs. letting a core position ride.
4) Advanced Adaptive Trailing Stop (AATS)
AATS is a sophisticated volatility- and structure-aware stop:
Uses Hirashima Sugita style levels (HSRS) to model “floors” and “ceilings” of price:
Dungeon → Lower floors → Mid → Upper floors → Penthouse
These levels classify where current price sits within a long-term distribution.
Combines HSRS with Bollinger-style envelopes and EMAs to determine:
Is price extended far into the upper structure?
Is it compressed near the lower ranges?
From this, it computes an adaptive factor that controls how tight or loose the trailing level (aATS / bATS) should be:
High Volatility / Penthouse areas:
Stop loosens to avoid getting wicked out by inevitable spikes.
Low Volatility / compressed structure:
Stop tightens to lock in and protect profit.
AATS is designed to be the “smart last line” that responds to context instead of a single fixed percentage.
5) RSI-Style Stop (RSIS)
On top of AATS, the script includes a RSI-like regime filter:
A McGinley Dynamic mean of price plus ATR bands creates a dynamic channel.
Crosses above the top band and below the lower band change a directional state.
When enabled (UseRSIS):
RSIS can confirm or veto AATS closes:
For longs: A shift to bearish RSIS can force exits sooner.
For shorts: A shift to bullish RSIS can do the same.
This extra layer helps avoid over-reactive stops in strong trends while still respecting a regime change when it happens.
D. Repainting Protection
Many strategies look incredible in the Strategy Tester but fail in live trading because they rely on intrabar values or future-knowledge functions.
This template is built with closed-candle realism in mind:
The Risk Management logic explicitly uses previous bar data (open , high , low , close ) for the key decisions on:
Trailing stop updates
TP triggers
SL hits
RM state transitions
No security() lookahead or future-bar access is used.
This means:
Backtest behavior is designed to match what you can actually get with TradingView alerts and live automation.
Signals may “flicker” intrabar while the candle is forming (as with any strategy), but on closed candles, the RM decisions are stable and non-repainting.
4. For Developers & Modders
We strongly encourage you to mod this script.
To plug your own strategy into the RM engine:
Look for the section titled:
// BASELINE & SIGNAL GENERATION
You will see composite logic building B1 and B2, and then selecting:
baseSig = B2
altSig = B1
finalSig = sigSwap ? baseSig : altSig
You can replace the content used to generate baseSig / altSig with your own logic, for example:
RSI crosses
MACD histogram flips
Candle pattern detectors
External condition flags
Requirements are simple:
Your final logic must output:
2 → Buy signal
-2 → Sell signal
0 → No new trade
That output flows into the RM engine via finalSig → AlertOpen → state machine → Fin.
Once you wire your signals into finalSig, the entire Risk Management system (Stops, TPs, AATS, RSIS, re-entry logic, weekend filters, long/short toggles) becomes available for your custom strategy without re-inventing the wheel.
This makes Superior RBR not just a strategy, but a reference architecture for serious Pine dev work.
5. About Signal Lynx
Automation for the Night-Shift Nation 🌙
Signal Lynx focuses on helping traders and developers bridge the gap between indicator logic and real-world automation. The same RM engine you see here powers multiple internal systems and templates, including other public scripts like the Super-AO Strategy with Advanced Risk Management.
We provide this code open source under the Mozilla Public License 2.0 (MPL-2.0) to:
Demonstrate how Adaptive Logic and structured Risk Management can outperform static, one-layer indicators
Give Pine Script users a battle-tested RM backbone they can reuse, remix, and extend
If you are looking to automate your TradingView strategies, route signals to exchanges, or simply want safer, smarter strategy structures, please keep Signal Lynx in your search.
License: Mozilla Public License 2.0 (Open Source).
If you make beneficial modifications, please consider releasing them back to the community so everyone can benefit.

Weekly Open Range - TatoshiDisplays a weekly open range for both current and previous weeks. Gives users the flexibility to adjust the number of hours that the weekly open range is determined by. I personally use the first 3 hours, but play around with it.
A GOAT of a indicator, allows the user to easily set their bias for the week and extremely simple to build a strategy around.

A+ Model - Cave EducationHere is a comprehensive and detailed explanation of the "A+ Model - Cave Education" Pine Script code.
This script is a sophisticated technical analysis tool designed for TradingView. It assists traders in identifying specific institutional time windows, price ranges (sessions), and "Macro" volatility periods based on the ICT (Inner Circle Trader) or similar time-based trading concepts.
Below is the breakdown of how the code functions, organized by its logic sections.
1. General Overview
The script is an overlay indicator (it sits directly on the price chart). Its primary purpose is to:
Highlight a specific trading session (The "A+ Box") and mark its High/Low.
Mark key institutional times (07:00 NY and 09:30 NY Open).
Identify "Macro" windows (specific 20-minute periods where algorithms are active) and draw dynamic ranges around them based on volatility (ATR).
Project future times onto the chart to help the trader prepare for the next day.
2. Settings & Inputs (User Configuration)
The code begins by defining a vast array of user inputs, grouped for better usability:
General Time & Box: Allows the user to define the "A+ Session" time (default 20:00-00:00) and the Time Zone (UTC-5/New York). It also handles the visual style (colors) of the session box.
Visibility: A crucial performance and visual clutter setting. boxDays limits how far back the A+ boxes and time lines are drawn (default 14 days). Macros are strictly limited to the current week to prevent chart lagging.
Line & Text Controls: Every visual element (A+ lines, NY markers, Macros) has toggles (input.bool) to show/hide the lines or the text labels separately.
Macro Settings: Defines the time windows for three separate macros and an ATR Multiplier. The ATR multiplier determines how wide the channel lines are drawn around the macro price action.
3. Logic Breakdown by Section
Section 1: The "A+ Draw" Box (Session Range)
This is the core of the A+ Model.
Logic: The script checks if the current bar is within the user-defined sessionTime.
Box Creation:
When the session starts, it initializes a new Box (box.new).
Throughout the session, it continuously updates the Box's Top (Highest High) and Bottom (Lowest Low) to encompass the full range of that time period.
Extension Lines (Support/Resistance):
Once the session ends, the script draws two horizontal lines: one from the Session High and one from the Session Low.
Smart Break Logic: These lines are active (highActive, lowActive). They extend to the right until the price breaks them (High line is broken by a higher price, Low line by a lower price). This helps traders see if the session range is being respected or broken later in the day.
Section 2: Time Lines (NY Midnight & Open)
This section marks vertical reference points.
It checks for specific times: 07:00 and 09:30 (in the user's timezone).
If the current bar matches these times, it draws a vertical line (line.new) covering the High/Low of that bar and places a label (e.g., "NY." or "09:30") above it.
This helps the trader orient themselves regarding the New York session Open and the "Killzone" start.
Section 3: Macros (Volatility Windows)
This is the most complex calculation in the script.
Definition: Macros are specific time windows (e.g., 09:50–10:10) where price delivery is often accelerated.
Visibility Rule: To keep the script fast, this only runs if isCurrentWeek is true.
ATR Offset: The script calculates the Average True Range (ATR). It uses this to create a "channel" around the price.
Drawing Logic:
When a Macro time starts, the script tracks the Highest High and Lowest Low inside that specific 20-minute window.
It draws parallel horizontal lines above and below these prices.
The Twist: The lines are not drawn at the High/Low. They are offset by ATR * Multiplier. This creates a wider "zone" around the macro price action, visually indicating a volatility range.
Section 4: Future Projection (Tomorrow)
This feature is for planning ahead.
It runs only on the last bar of the chart (barstate.islast).
It calculates the timestamps for the next occurrence of the key times (07:00, 09:30, and all three Macros).
It draws vertical lines into the future (empty space on the right of the chart).
Benefit: The trader can see exactly where 09:30 or the next Macro will occur on the timeline before the candles even print.
4. Helper Functions
The code uses custom functions to keep the logic clean:
f_drawFuture(...): A standardized function to draw the future vertical lines and labels so the code doesn't have to repeat itself for every single time marker.
isStartTime(...) & isInTime(...): Shorthand functions to check if the current candle belongs to a specific session string (like "0950-1010").
Summary of Improvements in this Version
Compared to a standard indicator, this script is highly optimized:
Text Control: You can turn off text labels while keeping the lines (or vice versa).
Performance: It limits historical drawing (only 14 days back for boxes, only this week for macros) to prevent "Maximum Line Count" errors in Pine Script.
Visual Clarity: It uses different colors for different Macros (Blue, Red, Orange) to make them instantly distinguishable.

UK Asian Range (00:00-06:00) [TZ]UK Asian Range (00:00–06:00) is a session-range overlay indicator built for traders who use the Asian session range as a key liquidity reference for the Frankfurt and London opens. It automatically measures the highest high and lowest low formed during a user-defined “Asia session” window (default 00:00–06:00) and draws that range on the chart as a clean, persistent shaded area.
The goal is simple: make it easy to see where overnight liquidity formed, so you can judge whether price is:
Breaking cleanly out of the Asian range,
Sweeping above/below the range to grab liquidity and reversing,
Respecting the range boundaries as support/resistance as Europe comes online.
What it does
For each trading day, the script:
Detects the start of the selected Asia session window (default 00:00).
Tracks price throughout that window and continuously updates:
Asia High = highest price printed during the session
Asia Low = lowest price printed during the session
At the moment the session ends (default 06:00), it finalizes the range and draws:
A shaded Asia range area that remains on the chart,
An “Asian Range” label placed above the area,
A clean “session area” border style with no right-side edge (so it looks open and unobtrusive rather than like a fully closed box).
Repeats the process daily and keeps a configurable number of past ranges visible for context.
How it works (concept and calculation method)
The script uses session-time detection to determine whether each bar belongs to the Asia session. While the bar is inside the session window, the range is updated using simple, transparent logic:
AsiaHigh = max(AsiaHigh, bar high)
AsiaLow = min(AsiaLow, bar low)
Once the first bar outside the session appears, the session is considered complete and the script “prints” the finalized range objects. Each day’s completed range is stored and preserved so you can compare how later price action interacts with prior Asian ranges over time.
Why the Time zone input matters
Different instruments and brokers can display different “day” boundaries and session timestamps (especially when comparing indices, metals, and FX). This script includes an explicit Time zone input (default Europe/London) so your Asia range window means the same thing across symbols.
In practical terms, it reduces the common frustration where a session box aligns perfectly on one market (e.g., Gold or DAX) but appears shifted on another (e.g., GBPJPY). With the Time zone setting, 00:00–06:00 is always evaluated in the time zone you choose, rather than drifting based on symbol/exchange time settings.
How to use it
Add the indicator to your chart.
Set Time zone to your preferred reference time zone (commonly Europe/London for UK-based traders).
Keep the session at 00:00–06:00 or adjust it to your own Asia definition.
Use the Asia range as a structure tool:
Watch for sweeps above the Asia high or below the Asia low into Frankfurt/London.
Treat the boundaries as potential liquidity targets and support/resistance zones.
Compare current reactions to prior days’ ranges to build pattern recognition.
Inputs included
Time zone: the time zone used to interpret the session times.
Asia Session (HHMM–HHMM): session window (default 00:00–06:00).
Show range area (filled) and styling controls (fill and border width/colour).
Optional Mid line.
Keep last N days: how many historical Asia ranges to keep on screen.
Acknowledgment / Inspiration
This indicator was inspired by the widely used “Asian range box” session concept on Trading View, with a nod to nico948 for popularizing that workflow for many traders. This script is an original implementation built to solve a practical usability issue: adding an explicit time zone selector so the same 00:00–06:00 Asia range aligns consistently across different symbols (indices, metals, and FX) without the need to manually realign session timing.
Notes
This is a visual framework tool. It does not place trades or provide buy/sell signals by itself; it provides a consistent session reference so you can apply your own sweep, reversal, or breakout approach with clear context.

Sessions & ORB Pro | Bifrost InstituteSessions & ORB Pro | BI
Professional Session Analysis and Opening Range Breakout Tracker
This advanced indicator provides comprehensive session tracking and Opening Range Breakout (ORB) analysis across multiple global trading sessions. Designed for intraday traders, this tool helps identify key support and resistance levels, session volatility patterns, and potential breakout opportunities.
Overview
Session-based trading is crucial for understanding market behavior, as different global sessions (US, European, Asian) exhibit distinct characteristics in terms of volatility, volume, and price action. This indicator allows traders to:
Identify Session Highs and Lows: Track the boundaries of each trading session to spot key support/resistance levels
Monitor Opening Range Breakouts: Capture the first 5, 15, or 30 minutes of major exchange openings to identify early directional bias
Analyze Multi-Session Patterns: View up to 4 concurrent or sequential sessions with full historical data
Customize Visual Analysis: Tailor colors, styles, and overlays for each session independently
Key Features
Multi-Session Support
Configure up to 4 independent trading sessions (US, Europe, Asia, Custom)
Fully customizable session times with timezone support (UTC offset, Chart timezone, or Exchange timezone)
Daylight Savings Time adjustment for accurate session timing
Session range boxes with adjustable transparency and outline styles
Historical session tracking (1-20 previous sessions)
Opening Range Breakout (ORB)
Track Opening Range for major exchanges: NYSE, LSE, TSE, TSX, ASX, HKEX, SSE
Configurable ORB periods: 5-minute, 15-minute, or 30-minute ranges
Visual ORB boxes with customizable colors and outline styles
ORB High/Low lines with optional extension beyond session close
Individual color control for each session's ORB
Session Analytics
Session High/Low: Horizontal lines marking the session's price extremes
Trendline: Linear regression trendline showing session directional bias
Mean: Session average price for mean reversion analysis
VWAP: Volume-weighted average price for institutional level analysis
Range Boxes: Visual representation of each session's price range
Advanced Customization
Individual Color Pickers: Set unique colors for each overlay type per session
Line Styles: Choose between Solid, Dashed, or Dotted for all line types
Label Options: Customize labels to show Date (d/M), Day of Week (ddd), and/or Price
Extend Options: Extend Session H/L and ORB lines beyond current bar
Outline Styles: Independent control of Range and ORB outline appearance
Information Dashboard
Optional real-time dashboard displaying:
Session Status: Open/Closed indicator for each session
Trend: R² correlation coefficient showing directional strength
Volume: Cumulative session volume
σ (Sigma): Session standard deviation for volatility analysis
Range: Session High, Low, and Range in points
ORB: Opening Range High, Low, and Range in points
Dashboard is fully customizable with toggleable columns and adjustable size/position.
Flexible Configuration
Time Zone Management: Three modes for precise session timing
Historical Display: Show/hide previous sessions for cleaner charts
Label Customization: Independent label size and content options for Session H/L vs ORB
Range Settings: Adjustable transparency, outlines, and label positioning
Use Cases
Session Traders: Identify when specific markets are most active and volatile
ORB Traders: Capture early session momentum and breakout opportunities
Support/Resistance: Use session highs/lows as key price levels
VWAP Strategies: Track institutional activity through session VWAP
Multi-Market Analysis: Monitor overlap between global trading sessions
Default Configuration
The indicator comes pre-configured with US (NYSE), Europe (LSE), and Asia (TSE) sessions, making it immediately useful for forex, indices, and global equity traders. Session D is available for custom session requirements.
Perfect for day traders, scalpers, and swing traders who rely on session-based analysis and institutional order flow.

Liquidity ThermometerThis is a universal indicator that assesses market liquidity based on five key market parameters: volume, volatility, candlestick range, body size, and price momentum.
The indicator does not use open interest data and is suitable for all markets, including spot, futures, and Forex.
This indicator normalizes each metric historically and creates a composite index between 0 and 1, where higher values correspond to a stable and calm market environment, and lower values indicate periods of increased risk and potential liquidity stress.
LT generates an integral liquidity index in the range based on five normalized components:
-nVol — normalized volume, reflecting trading density and activity.
-nATR — the volatility component (ATR), inverted, as high volatility is typically associated with declining liquidity.
-nRange — the normalized candlestick range, also inverted to assess the structural narrowness of the price movement.
-nBody — the normalized candlestick body size (|close − open|), inverted to assess the balance of supply and demand.
-nMove — the normalized value of the price impulse movement (|Δclose|), reflecting short-term price spikes.
Each metric is linearly normalized over a sliding window (200 bars) using the formula:
norm(x) = (x − min) / (max − min),
where at max = min, the value is fixed at 0.5 to ensure stability.
The ALT index is calculated as a weighted combination:
ALT = 0.35 nVol + 0.20 (1 − nATR) + 0.20 (1 − nRange) + 0.15 (1 − nBody) + 0.10 (1 − nMove)
The result is further smoothed using EMA(3) to reduce micronoise.
Red Zone (MLI < 0.25) — Risk, Thin Liquidity
When the indicator falls into the red zone, it means the market is extremely volatile:
Characteristics:
Low volume — small trades have a strong impact on the price.
High volatility — candlesticks rise or fall sharply.
Wide candlestick range — the market is "breathing heavily," easily breaking price extremes.
Impulsive movements — small market shocks lead to sharp spikes.
Thin liquidity — few orders in the order book, large orders "eat up" the market.
What this means for a trader:
🔥 High risk of spikes and false breakouts.
⚠ Possible series of liquidations on leverage.
❌ It is not recommended to enter long or short positions without a filter or protection.
✅ Can be used for short scalping strategies if you know the entry point, but very carefully.
Green Zone (MLI > 0.75) — High Liquidity, Safe Zone
When the indicator rises into the green zone, it means the market is stable and balanced:
Characteristics:
High volume — the market is deep, orders are executed without a strong impact on the price.
Low volatility — candlesticks are stable, no sharp spikes.
Narrow candlestick range — price moves calmly.
Weak impulse movements — no sharp surges.
Sufficient liquidity — the market can handle large orders.
What this means for a trader:
✅ Safe zone for opening positions.
🔄 Easier to set stop-loss and take-profit orders.
💡 You can trade both up and down, the risk of sharp movements is minimal.
⚡ Under these conditions, there is a lower risk of spikes and accidental liquidations.
It does not predict price movements or guarantee results. It is an analytical tool intended for additional research into market structure.

Forex Session TrackerForex Session Tracker - Professional Trading Session Indicator
The Forex Session Tracker is a comprehensive and visually intuitive indicator designed specifically for forex traders who need precise tracking of major global trading sessions. This powerful tool helps traders identify active market sessions, monitor session-specific price ranges, and capitalize on volatility patterns unique to each trading period.
Understanding when major financial centers are active is crucial for forex trading success. This indicator provides real-time visualization of the Tokyo, London, New York, and Sydney trading sessions, allowing traders to align their strategies with peak liquidity periods and avoid low-volatility trading windows.
---
Key Features
📊 Four Major Global Trading Sessions
The indicator tracks all four primary forex trading sessions with precision:
- Tokyo Session (Asian Market) - Captures the Asian trading hours, ideal for JPY, AUD, and NZD pairs
- London Session (European Market) - Monitors the most liquid trading period, perfect for EUR, GBP pairs
- New York Session (American Market) - Tracks US market hours, essential for USD-based currency pairs
- Sydney Session (Pacific Market) - Identifies the opening of the trading week and AUD/NZD activity
Each session is fully customizable with individual color schemes, making it easy to distinguish between different market periods at a glance.
🎯 Session Range Visualization
For each active trading session, the indicator automatically:
- Draws rectangular boxes that highlight the session's time period
- Tracks and displays session HIGH and LOW price levels in real-time
- Creates horizontal lines at session extremes for easy reference
- Positions session labels at the center of each trading period
- Updates dynamically as new highs or lows are formed within the session
This visual approach helps traders quickly identify:
- Session breakout opportunities
- Support and resistance zones formed during specific sessions
- Range-bound vs. trending session behavior
- Key price levels that institutional traders are watching
📱 Live Information Dashboard
A sleek, professional information panel displays:
- Real-time session status - Instantly see which sessions are currently active
- Color-coded indicators - Green dots for active sessions, gray for closed sessions
- Timezone information - Confirms your current timezone settings
- Customizable positioning - Place the dashboard anywhere on your chart (Top Left, Top Right, Bottom Left, Bottom Right)
- Adjustable size - Choose from Tiny, Small, Normal, or Large text sizes for optimal visibility
The dashboard provides at-a-glance awareness of market conditions without cluttering your chart analysis.
⚙️ Extensive Customization Options
Every aspect of the indicator can be tailored to your trading preferences:
Session-Specific Controls:
- Enable/disable individual sessions
- Customize colors for each trading period
- Adjust session times to match your broker's server time
- Toggle background highlighting on/off
- Show/hide session high/low lines independently
General Settings:
- UTC Offset Control - Adjust timezone from UTC-12 to UTC+14
- Exchange Timezone Option - Automatically use your chart's exchange timezone
- Background Transparency - Fine-tune the opacity of session highlighting (0-100%)
- Session Labels - Show or hide session name labels
- Information Panel - Toggle the live status dashboard on/off
Style Settings:
- Turn session backgrounds ON/OFF directly from the Style tab
- Maintain clean charts while keeping all analytical features active
🔔 Built-in Alert System
Stay informed about session openings with customizable alerts:
- Tokyo Session Started
- London Session Started
- New York Session Started
- Sydney Session Started
Set up notifications to never miss important market opening periods, even when you're away from your charts.
---
How to Use This Indicator
For Day Traders:
1. Identify High-Volatility Periods - Focus your trading during London and New York session overlaps for maximum liquidity
2. Monitor Session Breakouts - Watch for price breaks above/below session highs and lows
3. Avoid Low-Volume Periods - Recognize when major sessions are closed to avoid false signals
For Swing Traders:
1. Mark Key Levels - Use session highs and lows as support/resistance zones
2. Track Multi-Session Patterns - Observe how price behaves across different trading sessions
3. Plan Entry/Exit Points - Time your trades around session openings for better execution
For Currency-Specific Traders:
1. JPY Pairs - Focus on Tokyo session movements
2. EUR/GBP Pairs - Monitor London session activity
3. USD Pairs - Track New York session volatility
4. AUD/NZD Pairs - Watch Sydney and Tokyo sessions
---
Technical Specifications
- Pine Script Version: 5
- Overlay Indicator: Yes (displays directly on price chart)
- Maximum Bars Back: 500
- Drawing Objects: Up to 500 lines, boxes, and labels
- Performance: Optimized for real-time data processing
- Compatibility: Works on all timeframes (recommended: 5m to 1H for session tracking)
---
Installation & Setup
1. Add to Chart - Click "Add to Chart" after copying the script to Pine Editor
2. Configure Timezone - Set your UTC offset or enable "Use Exchange Timezone"
3. Customize Colors - Choose your preferred color scheme for each session
4. Adjust Display - Enable/disable features based on your trading style
5. Set Alerts - Create alert notifications for session starts
---
Best Practices
✅ Combine with Price Action - Use session ranges alongside candlestick patterns for confirmation
✅ Watch Session Overlaps - The London-New York overlap (1300-1600 UTC) typically shows highest volatility
✅ Respect Session Highs/Lows - These levels often act as intraday support and resistance
✅ Adjust for Your Broker - Verify session times match your broker's server clock
✅ Use Multiple Timeframes - View sessions on both lower (15m) and higher (1H) timeframes for context
---
Why Choose Forex Session Tracker Pro?
✨ Professional Grade Tool - Built with clean, efficient code following TradingView best practices
✨ Beginner Friendly - Intuitive design with clear visual cues
✨ Highly Customizable - Adapt every feature to match your trading style
✨ Performance Optimized - Lightweight code that won't slow down your charts
✨ Actively Maintained - Regular updates and improvements
✨ No Repainting - All visual elements are fixed once the session completes
---
Support & Updates
This indicator is designed to provide reliable, accurate session tracking for forex traders of all experience levels. Whether you're a scalper looking for high-volatility windows or a position trader marking key institutional levels, the Forex Session Tracker Pro delivers the insights you need to make informed trading decisions.
Happy Trading! 📈
---
Disclaimer
This indicator is a tool for technical analysis and should be used as part of a comprehensive trading strategy. Past performance does not guarantee future results. Always practice proper risk management and never risk more than you can afford to lose. Trading forex carries a high level of risk and may not be suitable for all investors.

Weekly Zones +RSI ColorWeekly analysis of stocks, cryptos etc.
chart, you will see:
The Weekly levels (PWH, PWL, 4 quadrants).
The Weekly control zones (the red, green, or grey boxes).
The Weekly analysis in the table.
Your 1-Hour candles will be colored green (strong), red (weak), or grey (neutral) based on the 1-hour RSI.
This should give you a very effective trading system.

Range Oascilator + LessDivergences + MACD+StochRSIRange Oscillator + EMA Filter
Calculates a custom oscillator based on the highest high and lowest low over a chosen period.
Generates BUY signals when the oscillator crosses up from the oversold zone and price is above the EMA.
Generates SELL signals when the oscillator crosses down from the overbought zone and price is below the EMA.
MACD (3‑10‑16 EMA Settings)
Uses fast EMA = 3, slow EMA = 10, signal EMA = 16.
Detects bullish and bearish crossovers.
These crossovers only trigger a single unified buy/sell signal if they coincide with Stochastic RSI being in oversold (for buy) or overbought (for sell) zones.
Stochastic RSI
Standard calculation with %K and %D smoothing.
Defines oversold (<20) and overbought (>80) zones.
Used both for divergence detection and as a filter for MACD signals.
Divergence Detection
RSI Divergence: Price makes a lower low but RSI makes a higher low (bullish), or price makes a higher high but RSI makes a lower high (bearish).
MACD Histogram Divergence: Price makes a lower low but MACD histogram makes a higher low (bullish), or price makes a higher high but MACD histogram makes a lower high (bearish).
Stochastic RSI Divergence: Similar logic applied to %K line.
Divergences are flagged only once per pivot to avoid repetitive signals.
Visuals
EMA plotted on chart.
BUY/SELL signals shown as triangles above/below bars.
Divergences shown as labels (e.g., “RSI BullDiv”, “MACD BearDiv”).
Unified MACD+Stoch RSI signals shown in distinct colors (lime for buy, orange for sell).

Consolidation Value Zones (Recio)Consolidation Value Zones introduces an original algorithm to identify consolidation ranges and locate areas of importance within them. This new method "looks" at the chart and draws zones based on price with the goal of producing actionable zones which appear natural, as if they were found through a human analysis.
> Consider the following...
The chart image above displays Bitcoin, at no specific date, for no specific reason. What I have done here is simply glanced at the chart for about 5 seconds, and circled a few areas which stood out as "obvious" consolidation. It does not take a savant to look at a chart and circle ranging price. However, what we have just done defies many common systems for identifying consolidation. We have located ranges of various zone lengths, as small as roughly 25 bars to as large as roughly 100 bars. Regardless of this, we still determined these zones with our eyes and brain in a few seconds, for some it's practically instant. The issue with us humans doing this, is that we are subjective. We did not really use any concrete rules to determine these areas with our eyes. So the problem becomes "How do we identify these zones in a way which seems natural to us with a repeatable system?" Because of this, my approach is simply a logical attempt to reverse engineer our human intuition.
> Consolidation Value Zones
The name of this indicator is generic. To dissect it, we are identifying consolidation ranges, then using a volume profile to determine the value zone within that range. The specific method used to identify these consolidation zones is something I've personally been referring to as the "skewer" method. Another name that may fit better is "Linear Range Alignment/Overlap".
Ultimately, the goal is to locate a single price level or range that overlaps many adjacent bars.
This should, in theory, return areas of visually obvious consolidation.
> The Skewer Method (Identification Method & Bar Gap Allowances)
One consistent concept across the different identification methods for determining consolidation is time. How long do we chop around before calling it consolidation? This is the "Identification Threshold". Once we have located a consolidation zone "this" wide, we will then consider it as consolidation.
In the chart image above, we are considering a six-bar consolidation formation. The figure on the left shows an example of a perfect raw bar overlap, we can see that the six bars all overlap at one price range. This is a perfect example of what we are looking to identify as consolidation. Unfortunately, if this was all we looked at, we would have a very scarce identification method.
For that reason, we have the example on the right, which shows the additional allowances for the identification of these ranges. At most, the example on the right shows a gapless three-bar overlap. However, if we allow the identification to bridge across the gaps, we are able to draw a zone directly through the center and still be within our parameters. This allowance is the "Bar Gap Allowance" and will determine the leniency of the identification.
Between our identification threshold and bar gap allowance, we can start to piece together how the script is "looking" at our chart.
> Detecting Consolidation (Live Detection)
To aid in transparency and user understanding, the live detection calculation can be seen on the chart as a box, skewering the recent historical bars with a number next to it, indicating the number of bars found as potential consolidation.
As we can see in the chart image above, the script, by default, is looking for a 15-bar consolidation, with a 5-bar gap allowance. In the image, the specific gap count is labeled, we can see the script scan backwards as far as it can before counting five gaps in the data. Once that occurs, the detection stops.
Notice how the zone found is a range, consisting of all price levels which meet the parameters. The lower level of the range only had two gaps, but the upper level reached five.
> Consolidation Range and Value Zones (Volume Profiles)
Once the script has identified the consolidation formation, it calculates a volume profile across the identified consolidation range. From this it calculates and draws the Point of Control (POC) and Value Area in addition to the full consolidation range.
Once we have our zones drawn, and understand what they identify, we can go one step further and apply concepts from volume profile trading.
Range High/Low: Displays the current extent of the identified consolidation.
Value High/Low: Shows the specific area within the consolidation where buyers and sellers found the most value.
POC: The single point, where the most volume was transacted during consolidation.
In a balanced market, we would anticipate price to rotate around POC, oscillating from Value High (VAH) to Value Low (VAL). In contrast, a market in motion moves directionally, building volume at new price levels as value, naturally the POC shifts with it.
> Zone Extensions
Unlike many other scripts, there is no mitigation logic at play here, since crossing a zone simply tells us "buyers and sellers are not currently active here", but it does not guarantee that value cannot return or react from previous areas of value.
Obviously the current zone will always be most relevant, but historical zones can retain relevance depending on the context of the market.
Remember: Each area of consolidation is an area where buyers and sellers were once facing off, resulting in price's consolidation. Amidst this, the value zone was the area of greatest agreement between the participants at that time. When moving outside of a range, we would typically look at historical value areas and price's interaction with them for further context.
Due to the ever changing market, there is no fixed extension lookback that will cover every scenario. By default, the Extension Lookback is "1", meaning the script will extend the most recent zone forward until a new zone is detected.
Note: For clarity, zone extensions are colored differently from core zones.
The following chart image shows a few examples of these unique interactions.
As seen in the chart image, looking to previous areas of value as well as POC can provide context in the form of acceptance or rejection at these levels, providing further insight into the auction for us to respond to.
The zones do contain logic to maintain a clean display. By default, the zones extend conditionally when price returns to the previous consolidation range. If desired, the zones can be extended regardless of price action; this can be toggled with the option "Regardless Extension Mode", as seen below.
> Hollow Candles & Zone Merging
When consolidation is identified, a hollow candle is drawn; these can be used to see exactly when each zone is identified. It is important to understand that consolidation zones stemming from the same origin are merged into one zone. This is a frequent occurrence when the consolidation threshold is passed, but the consolidation continues. For this reason you will often see multiple hollow candles in the later areas of the zones.
Similarly, zones from different origin points that overlap are also merged into one consolidation zone. This ensures that no core zones overlap.
Additionally, every time a zone is merged, a new volume profile for the area is calculated.
> Bar Gap Allowance Type (Technical Explanation)
The specific bar gap allowance value can be altered, but so can the type of allowance being used. While some analyses may benefit from counting the total amount of bar gaps within the consolidation, others may benefit from detecting based on consecutive bar gaps.
The chart image above displays the gap counts for each gap allowance type.
The total bar gap allowance type will count until the gap amount is reached, then terminate detection once the allowed number of gaps has been exceeded.
The consecutive bar gap allowance type resets its count once it finds a valid bar within range, by doing so, it only counts the bars that separate each island of in-range bars.
Both methods have merit.
> Implementation
This identification method has proven effective to identify consolidation across market types. As a result, there cannot be one configuration of settings to fit every application. Adapting the detection type and method for each trader's specific market conditions is highly recommended.
When determining parameters, it is helpful to consider time, as it plays a major role in the identification method.
On a 1D chart, the default threshold of 15 corresponds to 15 days, or about 3 weeks depending on the ticker. To identify periods of one-week consolidation, a threshold of 5 would be suitable. To detect perfect gapless weeks, a bar gap allowance of 0 could be used, as seen in the chart image below.
Additional Example:
In the chart image above, we see a 15-second forex chart over the span of a few hours. The detection parameters are set up to detect 15-minute consolidation with a 2-minute max dead zone (consecutive bar gap).
> Detection Source
By default, the script detects consolidation ranges using the full extent of candle wicks. While this is traditional, detection can also be done using only the candle bodies. These identifications are much more nuanced, detecting only from confirmed candle price action; they do not trigger at the same frequency as wick detection.
Optionally, a "Wick/Body Average" can be chosen as the source for detection; as the name implies, this uses the average value between the candle body and its respective wick.
> Additional Settings
The settings mentioned thus far serve as core parameters for identifying consolidation. The following parameters are simply included for the benefit of the advanced user. It is not recommended to adjust these settings under normal circumstances.
- Value Area Percent: Default = 68.26, while traditionally 70 for volume profiles, 68.26 is accurate to the values of a standard bell-curve distribution. The differences are minimal in application.
- VP Rows: Default = 99, Sets the number of rows to be used when calculating the Volume Profiles (VP); note that higher values will lead to a slower calculation. Max value: 999
> Final Notes
If you have made it this far, thank you for reading.
I hope you find value in this new consolidation identification system and understand the logic behind it.
That's it.
Tập lệnh trả phí

Range breaking indicatorDescription
Bull/Bear Area Ratio (last N candles) helps identify potential end-of-range situations by analyzing the relative strength of bullish vs bearish candles over a rolling window of N bars.
Instead of simply counting up or down candles, this script measures the "area" of each candle — the absolute distance between open and close, optionally weighted by volume.
By summing these areas over the last N bars, it calculates the percentage of bullish and bearish energy within that period.
When both sides become balanced (near 50/50), it often signals range exhaustion or possible trend transition.
How it works
Calculates the bullish and bearish area of each candle (abs(close - open), optionally × volume).
Maintains rolling buffers of the last N bars to compute running totals.
Plots both Bullish % (green) and Bearish % (red).
Highlights possible range-ending zones when the bullish ratio nears 50% ± threshold.
Displays a label showing the current balance.
Includes an alert condition when equilibrium is detected.
Inputs
Number of candles (N) – Rolling window length.
Use volume weighting – Multiplies each candle’s area by its volume.
Balance threshold (%) – Sensitivity for detecting equilibrium (default: 10%).
Best use
Combine with volume or volatility indicators to confirm market compression or expansion.
Use on higher timeframes (H1, H4, D1) to detect early signs of accumulation or distribution.
Works across all asset types: crypto, forex, stocks, indices, etc.
Alerts
An alert is triggered when:
“The range of the last N candles is balanced (possible end of range).”

Range Percentage Analyzer This indicator is a tool for analyzing the market range and trend. It calculates the extent of price movement between a specified starting point and the current price, displaying it as a percentage.
The calculation can be based on a fixed lookback period (e.g., the last 30 candles) or from a fixed start date. It also provides a clear table that shows the general trend in "Trend" mode, and the relative strength of the base and quote currencies of forex pairs (e.g., EURUSD) in "Forex" mode.
User Guide
Calculation Method
This setting determines how the indicator defines the starting point for the calculation.
Lookback Period: In this mode, the indicator uses the last N candles (the number can be specified in the "Lookback Period (bars)" field, maximum 250).
The starting point is "floating," meaning it shifts with each new candle. For example, with a setting of 30, the 30th candle from the current one will always be the starting point.
Date Based: In this mode, the calculation starts from a fixed date and time you select.
This mode is ideal for measuring performance from a specific event (e.g., news, start of a week/month).
Note: If you select a date in "Date Based" mode for which no data is available on the current timeframe (e.g., switching to a very low timeframe), the indicator will automatically use the earliest available candle as the starting point.
Start Date & Time
This setting is only active in "Date Based" mode.
Here you can specify the fixed starting point for the calculation.
The specified time is in the Exchange timezone.
Important limitation: Due to TradingView platform limits, visual elements (box, line) are only drawn for a maximum of 250 candles back.
If the set date is older than this, the calculation still applies to the entire period (from the set date), but the drawing only covers the last 250 candles.
When switching to a higher timeframe, the range may restart from a slightly later bar due to TradingView's bar alignment. For best accuracy, set your timeframe first, then select the start date.
Table Mode
This setting controls what data the information table displays.
Trend: This is the default mode, which works on any symbol (stock, index, crypto, etc.). It displays information related to the trend.
Forex: This is a special mode used to measure the strength of currency pairs.
It only works on symbols with exactly 6 characters (e.g., "EURUSD", "BTCUSD"). It treats the first 3 characters as the base currency (e.g., EUR) and the last 3 as the quote currency (e.g., USD).
If the symbol does not have 6 characters, the table will automatically display in "Trend" mode.
Extremes Trend Row
If this is enabled, the table displays an additional row that determines the trend based on the formation order of the high and low within the analyzed range.
The logic is as follows:
Bullish: Indicated if the low was formed before the high.
(Or if they formed on the same candle, which was a bullish candle).
Bearish: Indicated if the high was formed before the low.
(Or if they formed on the same candle, which was a bearish candle).
Neutral: Indicated if the high and low formed on the same candle, and it was a "doji" candle (close = open).
Upper & Lower Threshold
These settings control the logic for the "Change Trend" and "Forex Display" rows at the top of the table.
They determine when the total percentage change for the entire period is considered "Bullish/Strong", "Bearish/Weak", or "Neutral".
Upper Threshold (%): The percentage value (default 0.1%) above which the indicator considers the change "Bullish/Strong".
Lower Threshold (%): The percentage value (default -0.1%) below which the indicator considers the change "Bearish/Weak".
If the change is between the two, the signal is Neutral.

R Dominant Range [CRT] by Sergi SernaR Dominant Range identifies the most influential R range located to the left of the current price action. It highlights the dominant zone that still impacts market behavior, helping traders understand which range is controlling the current structure.

ZenAlgo - BoxerThis indicator plots multi-period Volume-Weighted Average Price (VWAP) ranges and deviation bands across several timeframes — specifically weekly, monthly, quarterly, semi-annual, and yearly. It is designed to visualize how price evolves relative to statistically weighted value areas within each period, based on both traded price and volume distribution.
Each timeframe layer is drawn independently, using its own cumulative VWAP and standard deviation calculation, and displayed as horizontal ranges aligned precisely with calendar periods. This structure allows the chart to show where price currently trades relative to past value zones and how each higher-timeframe VWAP acts as a dynamic reference for mean reversion or continuation.
Calculation Logic
1. Source and Base Inputs
The indicator uses the average of high, low, and close as its price source.
Stocks reset daily at session open.
2. VWAP and Deviation Computation
For each active timeframe, it accumulates the product of price and volume and divides it by cumulative volume, forming a continuously updated VWAP within that period.
The dispersion of price around VWAP is measured through a volume-weighted variance, converted to standard deviation.
These values form symmetrical bands around the VWAP (±1σ, ±2σ, etc.), describing the statistically typical price spread.
3. Range Drawing and Persistence
When a new period begins (e.g., a new week or month), the script finalizes the previous VWAP and deviation values, fixes them to time coordinates representing the full duration of that completed period, and draws corresponding lines or boxes across the entire range.
The user can control how many historical periods remain visible, ensuring performance and clarity even on high-frequency charts.
Each band can be toggled independently (for example ±1, ±2, ±3 deviations), and colors are adjustable per timeframe.
4. Adaptive Time Anchors
The start of each timeframe is aligned with calendar boundaries.
For stocks, the start time aligns with 9:30 New York time to coincide with market open for NYSE.
Each new anchor triggers a reset of cumulative data and creation of a new VWAP range.
5. Visualization Structure
The weekly layer is drawn first and can optionally display live VWAP bands extending backward for a user-defined number of weeks.
Monthly, quarterly, semi-annual, and yearly layers use the same computation principle but with independent accumulation windows.
The central VWAP line is dashed, while outer deviation levels are drawn as dotted or solid lines depending on their multiplier.
Boxes are rendered for key deviation intervals (e.g., ±2σ) to highlight broader value zones.
Interpretation
The VWAP represents the mean price weighted by traded volume for the given period.
Deviation bands describe statistically typical distance from that mean; outer bands mark less frequent extremes.
When price remains within ±1σ or ±2σ, it suggests balance around fair value.
Repeated touches or breaks beyond outer deviations indicate expansion or compression of volatility relative to prior periods.
Overlaps of VWAPs from multiple timeframes reveal multi-period confluence zones, useful for observing where long-term and short-term value agree or diverge.
Recommended Timeframes by Range Type
Weekly Range
Recommended timeframe: 30m to 12h
Suggested options: 30m, 1h, 2h, 3h, 4h, 6h, 8h, 12h
Using lower timeframes (like 5m) is technically possible, but higher ones provide smoother visualization and better readability.
Monthly Range
Recommended timeframe: 1h to 1D
Suggested options: 1h, 2h, 3h, 4h, 6h, 8h, 12h, 1D
Lower timeframes such as 30m may not display the full monthly range due to TradingView’s bar limits, so use higher TFs for complete coverage.
Quarterly Range
Recommended timeframe: 4h to 1W
Suggested options: 4h, 6h, 8h, 12h, 1D, 1W
Quarterly ranges benefit from higher timeframes to ensure that enough historical data is visible without exceeding chart limits.
Semi-Annual Range
Recommended timeframe: 12h to 1M
Suggested options: 12h, 1D, 1W, 1M
Lower timeframes would require too many bars to load a full six-month range; higher TFs offer a clearer overview.
Yearly Range
Recommended timeframe: 1D to 1M or higher
Suggested options: 1D, 1W, 1M
Yearly ranges often cannot display correctly on low timeframes (e.g. 1h) because of TradingView’s maximum bar limits — for instance, five years of 1h data exceeds 40,000 bars. Use higher TFs for accurate rendering.
Added Value Compared to Common Free VWAP Indicators
Incorporates five independent timeframes simultaneously (week, month, quarter, half-year, year) with exact calendar anchoring and timezone handling.
Calculates volume-weighted deviation for each layer, maintaining consistent statistical scale across assets.
Provides historical box persistence , allowing comparison of completed VWAP structures instead of only current running lines.
Enables selective visibility, bandwidth control, and precise visual differentiation through adjustable colors and line weights.
Limitations and Notes
The indicator does not generate trading signals. It is purely analytical and descriptive.
On very low timeframes or illiquid assets, deviation values may fluctuate if volume data is inconsistent.
Historical boxes are approximate in length for months with fewer than 31 days; this simplification has negligible effect on interpretation.
High visual density may occur when enabling many deviations or timeframes at once; users should limit visible history for performance.
Best Usage Practices
Apply on intraday charts (5–240 min) to study how price interacts with weekly or higher-timeframe VWAP zones.
Observe convergence of VWAPs from multiple periods to locate significant equilibrium levels.
Use outer deviations to frame potential exhaustion or re-entry zones rather than directional predictions.
Combine with independent volume- or structure-based analysis for context.
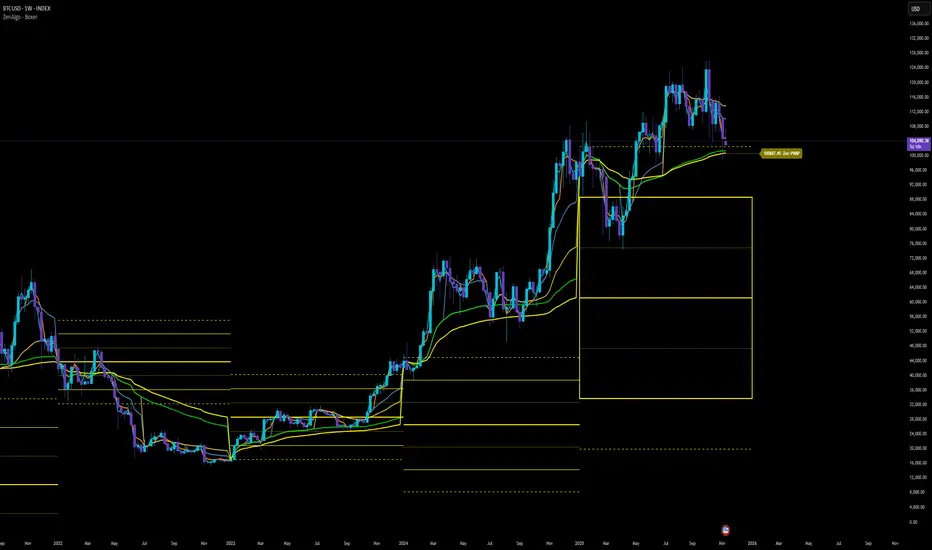
Killzone Session High/Low Levels [SmartFoxy]Killzone Session High/Low Levels
The Killzone Session High/Low Levels indicator by SmartFoxy provides a complete intraday framework for understanding session-based liquidity, market structure rotation, and breakout behavior across global trading sessions.
It automatically plots the High/Low ranges for each selected session, highlights session killzones, and tracks breakout events with optional alerts.
This tool is designed for traders who rely on session dynamics (Asia, Frankfurt, London, New York) to identify liquidity targets, sweep zones, key ranges, and continuation/reversal opportunities.
________________________________________
How It Works
The indicator detects the active trading sessions for each day and builds structural High/Low ranges for them:
• Asia Session Range (High/Low);
• Frankfurt Session Range;
• London Session Range;
• New York Session Range;
• Optional custom session (NY Open, or any killzone).
For each session, the script can display:
• Session box or column;
• High/Low levels;
• Labels for every range (H/L);
• True session boundaries using user-defined timezone;
• Auto-extended levels up to the latest candle;
• Break levels after a breakout;
• Conditional removal or recoloring after a level is breached.
This gives traders a clean visual map of session liquidity and how price interacts with it throughout the day.
________________________________________
Key Features
1. Multiple Global Sessions •➤ Asia, Frankfurt, London, New York, plus one custom session for advanced killzone mapping.
2. Session High/Low Liquidity Levels •➤ Automatic plotting of every session’s High and Low, with optional labels and price markers.
3. Session Boxes or Columns •➤ Two display modes allow traders to visualize the session either as a filled box or a clear vertical column.
4. Breakout Logic & Temporary Levels .
When price breaks a session High/Low:
• Levels can be extended for a selected number of bars
• Or removed instantly after a breakout
• Or recolored to highlight the sweep event
This enables clean identification of liquidity grabs, breakouts, and continuation setups.
5. Alerts for Session Breakouts .
Set alerts when price breaks:
• Any session level
• Only levels formed on the current day
Perfect for traders who want real-time notifications of sweeps or key structure breaks.
6. Full Customization
You can configure:
• Session times;
• Timezone;
• Colors;
• Labels;
• Line styles and widths;
• Breakout behavior;
• Killzone range handling.
Everything is adjustable to match any trading style.
________________________________________
How to Use
1. Enable the sessions you want to track •➤ Asia, Frankfurt, London, New York, or custom.
2. Choose display mode
Box mode for visual range blocks;
Column mode for clean vertical alignment.
3. Enable High/Low Levels .
These act as liquidity magnets and key rejection zones.
4. Turn on Breakout Levels (optional)
Useful for spotting sweeps and continuation setups.
5. Turn on Alerts if you want notifications when price breaks levels.
6. Use session levels as liquidity reference points .
They work exceptionally well with smart money concepts (SMC), ICT, and intraday structure analysis.
________________________________________
Why This Indicator Is Useful
Shows exactly where liquidity is placed each session;
Highlights market structure transitions as sessions hand over control;
Helps identify stop hunts, sweeps, reversals, and continuation patterns;
Provides real-time alerts for structural breaks;
Organizes the chart and reduces noise;
Works with any intraday timeframe and any market.
This makes it valuable for scalpers, day traders, and SMC/ICT-style analysts.
________________________________________
Summary
Killzone Session High/Low Levels delivers a complete, highly customizable intraday mapping system based on global trading sessions.
It clarifies the session structure, reveals liquidity targets, and empowers traders to make confident trading decisions using clean, objective market data.
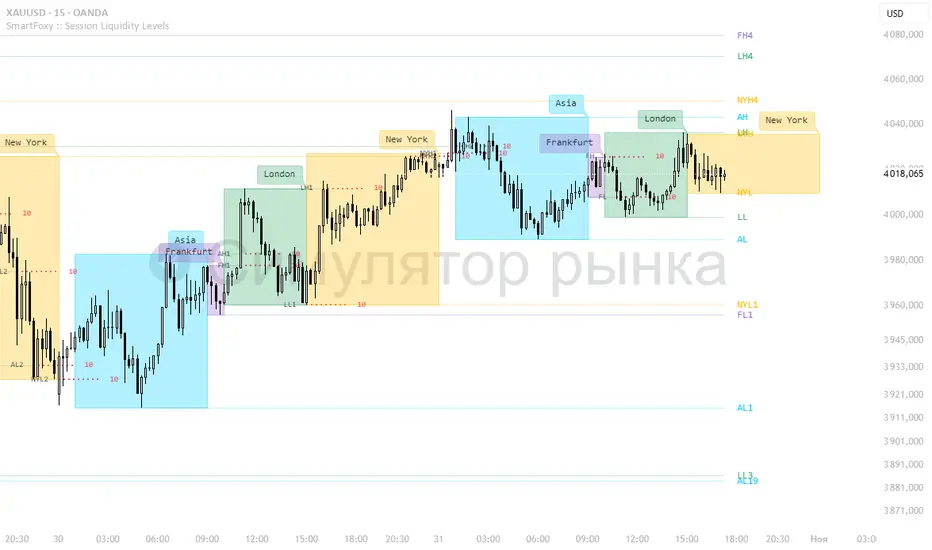
Session Streaks [LuxAlgo]The Session Streaks tool allows traders to identify whether a session is bullish or bearish on the chart. It also shows the current session streak, or the number of consecutive bullish or bearish sessions.
The tool features a dashboard with information about the session streaks of the underlying product on the chart.
🔶 USAGE
Analyzing session streaks is commonly used for market timing by studying the number of consecutive sessions over time and how long they last before the market changes direction.
We identify a bullish session as one in which the closing price is equal to or greater than the opening price, and a bearish session as one in which the closing price is below the opening price.
Each session is labeled according to its bias (bullish or bearish) and the number of consecutive sessions of the same type that conform the current streak.
🔹 Dashboard
The dashboard at the top shows information about the current session.
Under the "Streaks" header, historical information about session streaks is displayed, divided into bullish and bearish categories.
Number: Total number of streaks.
Median: The average duration of those streaks. We chose the median over the mean to avoid misrepresentation due to outliers.
Mode: The most common streak duration.
As the image shows, for this particular market, there are more bullish streaks than bearish ones. Bullish streaks have an average duration that is longer than that of bearish streaks, and both have the same most common streak duration.
If the current session is bullish and the median streak duration for bullish sessions is three, then we could consider scenarios in which the next two sessions are bullish.
🔶 DETAILS
🔹 Streaks On Larger Timeframes
On timeframes lower than or equal to Daily, the tool identifies each consecutive session, but this behavior changes on larger timeframes.
On timeframes larger than daily, the tool identifies the last session of each bar. Let's use the chart in the image as a reference.
At the top of the image, there is a daily chart where each session corresponds to each candle. One candle equals one day.
In the middle, we have a weekly chart where each session is the last session of each week, which is usually Friday for the Nasdaq 100 futures contract. The levels and labels displayed correspond to the last session within each candle, which is the last day of each week.
The levels and labels on the monthly chart correspond to the last session of each month, which is the last day of each month.
🔹 Gradient Style
Traders can choose between two different color gradients for the session background. Each gradient provides different information about price behavior within each session.
Horizontal: Green indicates prices at the top of the session range and red indicates prices at the bottom.
Vertical: Green indicates prices that are equal to or greater than the open price and red indicates prices that are below the open price of the session.
🔶 SETTINGS
🔹 Dashboard
Dashboard: Enable or disable the dashboard.
Position: Select the location of the dashboard.
Size: Select the dashboard size.
🔹 Style
Bullish: Select a color for bullish sessions.
Bearish: Select a color for bearish sessions.
Transparency: Select a transparency level from 100 to 0.
Gradient: Select a horizontal or vertical gradient.

VWAP Composites📊 VWAP Composite - Advanced Multi-Period Volume Weighted Average Price Indicator
═══════════════════════════════════════════════════════════════════
🎯 OVERVIEW
VWAP Composite is an advanced volume-weighted average price (VWAP) indicator that goes beyond traditional single-period VWAP calculations by offering composite multi-period analysis and unprecedented customization. This indicator solves a common problem traders face: traditional VWAP resets at arbitrary intervals (session start, day, week), but significant price action and volume accumulation often spans multiple periods. VWAP Composite allows you to anchor VWAP calculations to any timeframe—or combine multiple periods into a single composite VWAP—giving you a true representation of average price weighted by volume across the exact periods that matter to your analysis.
═══════════════════════════════════════════════════════════════════
⚙️ HOW IT WORKS - CALCULATION METHODOLOGY
📌 CORE VWAP CALCULATION
The indicator calculates VWAP using the standard volume-weighted formula:
• Typical Price = (High + Low + Close) / 3
• VWAP = Σ(Typical Price × Volume) / Σ(Volume)
This calculation is performed across user-defined time periods, ensuring each bar's contribution to the average is proportional to its trading volume.
📌 STANDARD DEVIATION BANDS
The indicator calculates volume-weighted standard deviation to measure price dispersion around the VWAP:
• Variance = Σ / Σ(Volume)
• Standard Deviation = √Variance
• Upper Band = VWAP + (StdDev × Multiplier)
• Lower Band = VWAP - (StdDev × Multiplier)
These bands help identify overbought/oversold conditions relative to the volume-weighted mean, with high-volume price excursions having greater impact on band width than low-volume moves.
📌 COMPOSITE PERIOD METHODOLOGY (Auto Mode)
Unlike traditional VWAP that resets at fixed intervals, Auto Mode creates composite VWAPs by combining the current period with N previous periods:
• Period Span = 1: Current period only (standard VWAP behavior)
• Period Span = 2: Current period + 1 previous period combined
• Period Span = 3: Current period + 2 previous periods combined
• And so on...
Example: A 3-period Weekly composite VWAP calculates from the start of 2 weeks ago through the current week's end, creating a single VWAP that represents 21 days of continuous price and volume data. This provides context about where price stands relative to the volume-weighted average over multiple weeks, not just the current week.
═══════════════════════════════════════════════════════════════════
🔧 KEY FEATURES & ORIGINALITY
✅ DUAL OPERATING MODES
1️⃣ MANUAL MODE (5 Independent VWAPs)
Define up to 5 separate VWAP calculations with custom start/end times:
• Perfect for anchoring VWAP to specific events (earnings, Fed announcements, major reversals)
• Each VWAP has independent color settings for lines and deviation band backgrounds
• Individual control over calculation extension and visual extension (explained below)
• Useful for tracking multiple institutional accumulation/distribution zones simultaneously
2️⃣ AUTO MODE (Composite Period VWAP)
Automatically calculates VWAP across combined time periods:
• Supported periods: Daily, Weekly, Monthly, Quarterly, Yearly
• Configurable period span (1-20 periods)
• Always up-to-date, recalculates on each new bar
• Ideal for systematic analysis across consistent timeframes
✅ DUAL EXTENSION SYSTEM (Manual Mode Innovation)
Most VWAP indicators only offer "on/off" for extending calculations. This indicator provides two distinct extension options:
🔹 EXTEND CALCULATION TO CURRENT BAR
When enabled, continues including new bars in the VWAP calculation after the defined end time. The VWAP value updates dynamically as new volume enters the market.
Use case: You anchored VWAP to a major low 3 weeks ago. You want the VWAP to continue evolving with new volume data to track ongoing institutional positioning.
🔹 EXTEND VISUAL LINE ONLY
When enabled (and calculation extension is disabled), projects the "frozen" VWAP value forward as a reference line. The VWAP value remains fixed at what it was at the end time, but the line and deviation bands visually extend to current price.
Use case: You want to see how price is behaving relative to the VWAP that existed at a specific point in time (e.g., "Where is price now vs. the 5-day VWAP that existed at last Friday's close?").
This dual system gives you unprecedented control over whether you're tracking a "living" VWAP that incorporates new data or using historical VWAP levels as static reference points.
✅ CUSTOMIZABLE STANDARD DEVIATION BANDS
• Adjustable multiplier (0.1 to 5.0)
• Independent background colors with opacity control for each VWAP
• Dashed band lines for easy visual distinction from main VWAP
• Bands extend when visual extension is enabled, maintaining zone visibility
✅ COMPREHENSIVE LABELING SYSTEM
Each VWAP displays:
• Current VWAP value
• Upper deviation band value (High)
• Lower deviation band value (Low)
• Extension status indicator (Calc Extended / Visual Extended)
• Color-coded for quick identification
═══════════════════════════════════════════════════════════════════
📖 HOW TO USE THIS INDICATOR
🎯 SCENARIO 1: EVENT-ANCHORED VWAP (Manual Mode)
Use case: A stock gaps down 15% on earnings and you want to track where institutions are positioning during the recovery.
Setup:
1. Switch to Manual Mode
2. Enable VWAP 1
3. Set Start Time to the earnings gap bar
4. Set End Time to current time (or leave far in future)
5. Enable "Extend Calculation to Current Bar"
6. Watch how price respects the VWAP as a dynamic support/resistance
Interpretation:
• Price above VWAP = buyers in control since the event
• Price testing VWAP from above = potential support
• Volume-weighted standard deviation bands show normal price range
• Price outside bands = potential exhaustion/mean reversion setup
🎯 SCENARIO 2: MULTI-WEEK INSTITUTIONAL ACCUMULATION ZONE (Auto Mode)
Use case: You trade swing setups and want to identify where institutions have been accumulating over the past 3 weeks.
Setup:
1. Switch to Auto Mode
2. Select "Weekly" period type
3. Set Period Span to 3
4. Enable standard deviation bands
Interpretation:
• 3-week composite VWAP shows the true average institutional entry
• Price bouncing off VWAP repeatedly = strong support (institutions defending their average)
• Price breaking below VWAP on high volume = potential distribution
• Deviation bands contracting = consolidation; expanding = volatility increase
🎯 SCENARIO 3: COMPARING MULTIPLE TIME HORIZONS (Manual Mode)
Use case: You want to see short-term vs medium-term vs long-term VWAP alignments.
Setup:
1. Switch to Manual Mode
2. VWAP 1: Last 5 trading days (blue)
3. VWAP 2: Last 10 trading days (orange)
4. VWAP 3: Last 20 trading days (purple)
5. Enable "Extend Calculation" for all
6. Set different background colors for visual separation
Interpretation:
• All VWAPs aligned upward = strong trend across all timeframes
• Price between VWAPs = finding equilibrium between different trader timeframes
• Short-term VWAP crossing long-term VWAP = momentum shift
• Price rejecting at higher-timeframe VWAP = that timeframe's traders defending their average
🎯 SCENARIO 4: HISTORICAL VWAP REFERENCE LEVELS (Manual Mode)
Use case: You want to see where the 1-month VWAP was at each month-end as static reference levels.
Setup:
1. Switch to Manual Mode
2. VWAP 1: Set to last month's start/end dates
3. VWAP 2: Set to 2 months ago start/end dates
4. VWAP 3: Set to 3 months ago start/end dates
5. Disable "Extend Calculation"
6. Enable "Extend Visual Line Only"
Interpretation:
• Each VWAP represents the volume-weighted average for that complete month
• These become static support/resistance levels
• Price returning to old monthly VWAPs = institutional memory/gap fill behavior
• Useful for identifying longer-term value areas
═══════════════════════════════════════════════════════════════════
🎨 CUSTOMIZATION OPTIONS
GENERAL SETTINGS
• Show/hide labels
• Line style: Solid, Dashed, or Dotted
• Standard deviation multiplier (impacts band width)
• Toggle standard deviation bands on/off
MANUAL MODE (Per VWAP)
• Custom start and end times
• Line color picker
• Background color picker (with transparency control)
• Extend calculation option
• Extend visual option
• Show/hide individual VWAPs
AUTO MODE
• Period type selection (Daily/Weekly/Monthly/Quarterly/Yearly)
• Period span (1-20 periods)
• Line color
• Background color (with transparency control)
═══════════════════════════════════════════════════════════════════
💡 TRADING APPLICATIONS
✓ Mean Reversion: Use deviation bands to identify stretched prices likely to return to VWAP
✓ Trend Confirmation: Price sustained above VWAP = bullish bias; below = bearish bias
✓ Support/Resistance: VWAP often acts as dynamic S/R, especially on higher volume periods
✓ Institutional Positioning: Multi-day/week VWAPs show where large players have established positions
✓ Entry Timing: Wait for pullbacks to VWAP in trending markets
✓ Stop Placement: Use VWAP ± standard deviation as volatility-adjusted stop levels
✓ Breakout Confirmation: Breakouts from consolidation with price reclaiming VWAP = stronger signal
✓ Multi-Timeframe Analysis: Compare short vs long-period VWAPs to gauge momentum alignment
═══════════════════════════════════════════════════════════════════
⚠️ IMPORTANT NOTES
• The indicator redraws on each bar to maintain accurate visual representation (uses `barstate.islast`)
• Maximum lookback is limited to 5000 bars for performance optimization
• Time range calculations work across all timeframes but are most effective on intraday to daily charts
• Standard deviation bands assume volume-weighted distribution; extreme events may violate assumptions
• Auto mode always calculates to current bar; use Manual mode for fixed historical periods
═══════════════════════════════════════════════════════════════════
This indicator is open-source. Feel free to examine the code, learn from it, and adapt it to your needs.

DTR & ATR with live zonesThis indicator is designed to help traders gauge the day's volatility in real-time. It compares the current Daily True Range (DTR)—the distance between the session's high and low—to the historical Average True Range (ATR).
The main purpose is to project potential price levels where the market might reach based on its average volatility. These levels (100% ATR, 150%, 200%, etc.) can be used as price targets. For instance, if you're in a long trade, you might consider taking partial or full profits as the price approaches these upper ATR extension levels. The indicator is highly customisable, allowing you to control the appearance of the ATR lines, zones, and labels to fit your charting preferences.
Core Concepts: ATR and DTR
To use this indicator effectively, it's important to understand its two main components:
Average True Range (ATR): This is a classic technical analysis indicator that measures market volatility. It calculates the average range of price movement over a specific period (e.g., 14 days). A higher ATR means the price is, on average, moving more, while a low ATR indicates less volatility. This script uses a higher timeframe ATR (e.g., Daily) to establish a stable volatility baseline for the current trading day.
Daily True Range (DTR): This is simply the difference between the current trading session's highest high and lowest low (session high - session low). It tells you how much the price has actually moved so far today.
The indicator's logic revolves around comparing the live, unfolding DTR to the historical, baseline ATR. An on-screen table conveniently shows this comparison as a percentage, to show how volatile the day has been.
How It Works: The Dynamic & Locked Mechanism
The most clever part of this indicator is how it draws the ATR levels. It operates in two distinct phases during the trading session:
Phase 1: Dynamic Expansion (Before DTR meets ATR)
At the start of the session, the DTR is small. The indicator calculates the remaining range needed to "complete" the 100% ATR level (difference = avg_atr - dtr). It then adds this remaining amount to the session high and subtracts it from the session low. This creates a "floating" 100% ATR range that expands dynamically as the session high or low is extended.
Phase 2: The Lock-in (After DTR meets or exceeds ATR)
Once the day's range (DTR) becomes equal to or greater than the avg_atr, the day has met its "expected" volatility. At this point, the levels lock in place. The indicator intelligently determines the anchor point for the locked range.
Once this primary 100% ATR range is established (either dynamically or locked), the script projects the other levels (150%, 200%, 250%, and 300%) by adding or subtracting multiples of the avg_atr from this base.
How to Use It for Trading
The primary use of this indicator is to set logical, volatility-based price targets.
Setting Profit Targets: If you enter a long position, the upper ATR levels (100%, 150%, 200%) serve as excellent areas to consider taking profits. A move to the 200% or 250% level often signifies an overextended or "exhaustion" move, making it a high-probability exit zone. For short positions, the lower ATR levels serve the same purpose.
Assessing Intraday Momentum: The on-screen table tells you how much of the expected daily range has been used. If it's early in the session and the DTR is only at 30% of the ATR, you can anticipate more significant price movement is likely to come. Conversely, if the DTR is already at 150% of ATR, the bulk of the day's move may already be complete.
Mean Reversion Signals: If the price pushes to an extreme level (e.g., 250% ATR) and shows signs of stalling (e.g., bearish divergence on an oscillator), it could signal a potential reversal or pullback, offering an opportunity for a counter-trend trade.
Key Settings
ATR Length & Smoothing Type: These settings control how the baseline ATR is calculated. The default 14 period and RMA smoothing are standard, but you can adjust them to your preference.
Session Settings: This is crucial. You must set the Market Session and Time Zone to match the primary trading hours of the asset you are analysing (e.g., "0930-1600" for the NYSE session).
Show Lines / Show Labels / Show Zones: The script gives you full control over the visual display. You can toggle each ATR level's lines, labels, and background zones individually to avoid a cluttered chart and focus only on the levels that matter to your strategy.
