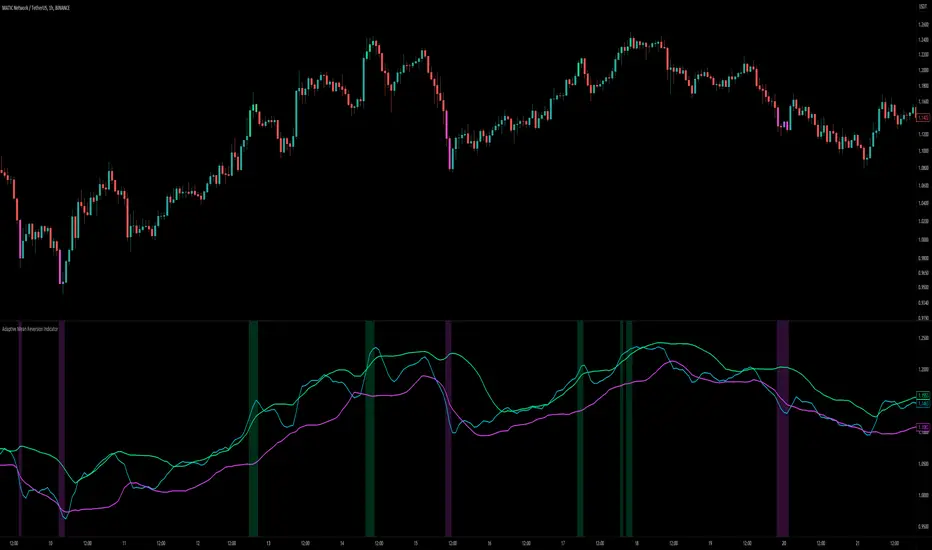
Adaptive Mean Reversion IndicatorThe Adaptive Mean Reversion Indicator is a tool for identifying mean reversion trading opportunities in the market. The indicator employs a dynamic approach by adapting its parameters based on the detected market regime, ensuring optimal performance in different market conditions.
To determine the market regime, the indicator utilizes a volatility threshold. By comparing the average true range (ATR) over a 14-period to the specified threshold, it determines whether the market is trending or ranging. This information is crucial as it sets the foundation for parameter optimization.
The parameter optimization process is an essential step in the indicator's calculation. It dynamically adjusts the lookback period and threshold level based on the identified market regime. In trending markets, a longer lookback period and higher threshold level are chosen to capture extended trends. In ranging markets, a shorter lookback period and lower threshold level are used to identify mean reversion opportunities within a narrower price range.
The mean reversion calculation lies at the core of this indicator. It starts with computing the mean value using the simple moving average (SMA) over the selected lookback period. This represents the average price level. The deviation is then determined by calculating the standard deviation of the closing prices over the same lookback period. The upper and lower bands are derived by adding and subtracting the threshold level multiplied by the deviation from the mean, respectively. These bands serve as dynamic levels that define potential overbought and oversold areas.
In real-time, the indicator's adaptability shines through. If the market is trending, the adaptive mean is set to the calculated mean value. The adaptive upper and lower bands are adjusted by scaling the threshold level with a factor of 0.75. This adjustment allows the indicator to be less sensitive to minor price fluctuations during trending periods, providing more robust mean reversion signals. In ranging market conditions, the regular mean, upper band, and lower band are used as they are more suited to capture mean reversion within a confined price range.
The signal generation component of the indicator identifies potential trading opportunities based on the relationship between the current close price and the adaptive upper and lower bands. If the close price is above the adaptive upper band, it suggests a potential short entry opportunity (-1). Conversely, if the close price is below the adaptive lower band, it indicates a potential long entry opportunity (1). When the close price is within the range defined by the adaptive upper and lower bands, no clear trading signal is generated (0).
To further strengthen the quality of signals, the indicator introduces a confluence condition based on the RSI. When the RSI exceeds the threshold levels of 70 or falls below the threshold level of 30, it indicates a strong momentum condition. By incorporating this confluence condition, the indicator ensures that mean reversion signals align with the prevailing market momentum. It reduces the likelihood of false signals and provides traders with added confidence when entering trades.
The indicator offers alert conditions to notify traders of potential trading opportunities. Alert conditions are set to trigger when a potential long entry signal (1) or a potential short entry signal (-1) aligns with the confluence condition. These alerts allow traders to stay informed about favorable mean reversion setups, even when they are not actively monitoring the charts. By leveraging alerts, traders can efficiently manage their time and take advantage of market opportunities.
To enhance visual interpretation, the indicator incorporates background coloration that provides valuable insights into the prevailing market conditions. When the indicator generates a potential short entry signal (-1) that aligns with the confluence condition, the background color is set to lime. This color suggests a bullish trend that is potentially reaching an exhaustion point and about to revert downwards. Similarly, when the indicator generates a potential long entry signal (1) that aligns with the confluence condition, the background color is set to fuchsia. This color represents a bearish trend that is potentially reaching an exhaustion point and about to revert upwards. By employing background coloration, the indicator enables traders to quickly identify market conditions that may offer mean reversion opportunities with a directional bias.
The indicator further enhances visual clarity by incorporating bar coloring that aligns with the prevailing market conditions and signals. When the indicator generates a potential short entry signal (-1) that aligns with the confluence condition, the bar color is set to lime. This color signifies a bullish trend that is potentially reaching an exhaustion point, indicating a high probability of a downward reversion. Conversely, when the indicator generates a potential long entry signal (1) that aligns with the confluence condition, the bar color is set to fuchsia. This color represents a bearish trend that is potentially reaching an exhaustion point, indicating a high probability of an upward reversion. By using distinct bar colors, the indicator provides traders with a clear visual distinction between bullish and bearish trends, facilitating easier identification of mean reversion opportunities within the context of the broader trend.
While the "Adaptive Mean Reversion Indicator" offers a robust framework for identifying mean reversion opportunities, it's important to remember that no indicator is foolproof. Traders should exercise caution and employ risk management strategies. Additionally, it is recommended to use this indicator in conjunction with other technical analysis tools and fundamental factors to make well-informed trading decisions. Regular backtesting and refinement of the indicator's parameters are crucial to ensure its effectiveness in different market conditions.
Chỉ số Sức mạnh Tương quan (RSI)
Comparison with BTC (RSI)显示当前品种与BTC汇率对的RSI值
以此判断强势或弱势品种以及超买超卖
——————————
Display the RSI value of the exchange rate between the current variety and BTC
Use this to determine strong or weak varieties, as well as overbought and oversold

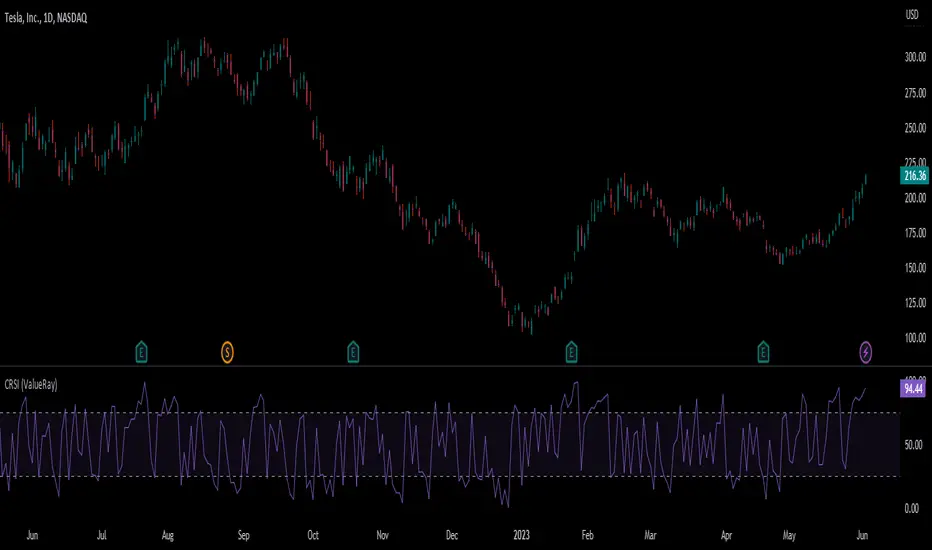
Connors RSI (ValueRay)In compare to Tradingview Connors RSI, in this one you can choose which of the parts of the CRSI you want see:
RSI
Connors RSI
Up/Down RSI
Percent Rank
The Connors RSI is a technical indicator developed by Larry Connors. It combines three different elements - price momentum, relative strength, and mean reversion - to identify potential buy and sell signals. The indicator measures the level of overbought or oversold conditions in a security, aiming to generate signals for short-term trading opportunities. It is widely used by traders to assess the strength and direction of price movements and to identify potential entry and exit points in the market.
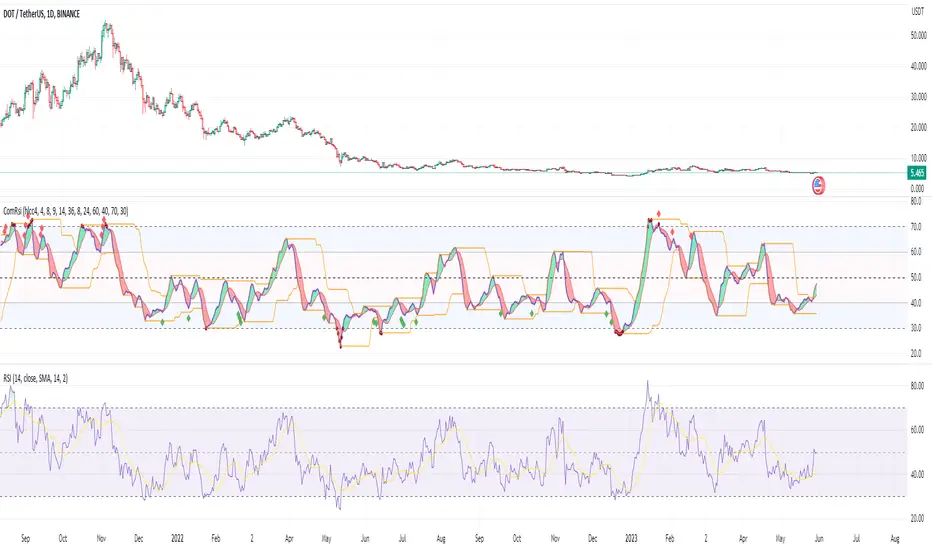
Composite RSIOne issue with the famouse RSI indicator is that it is too sensitive in some cases and thus, might give false signals if we are eager to use those signals.
If we increase the length of the RSI, it might give too few signals which is not ideal as well.
This Composite RSI indicator was created to utilize the RSI strength, using 3 RSIs (with different length) in combination to give less signal than the original one.
You can use it like a normal RSI indicator:
- Try to find the entry when the RSI is in the overbought (RSI >= 70) and oversold (RSI <= 30) areas
- Use bullish divergence and bearish divergence on the RSI itself to signal your trade
In the example chart, I included a built-in RSI as well so you that you can compare the original one and the Composite RSI indicator.
Some extra features:
- Simple bullish and bearish divergences detection.
- Mark the RSI with green circle(s) when it is extremely overbought (over 80) and oversold (under 20)
RSI of Zero Lag MA (ValueRay)The RSI of a Zero Lag Moving Average a powerful tool for for reliable exit signals.
The Relative Strength Index (RSI) is a widely recognized momentum oscillator that measures the speed and change of price movements. It provides valuable insights into overbought and oversold conditions, enabling traders to identify potential reversal points and take advantage of market inefficiencies.
The RSI of a Zero Lag Indicator takes this concept a step further by incorporating the Zero Lag Moving Average. The Zero Lag Moving Average is a cutting-edge indicator that minimizes lag and provides a smoother representation of price action, allowing for quicker and more precise responses to market movements.
By combining the RSI with the Zero Lag Moving Average, this indicator offers traders a superior exit strategy. When the RSI reaches extreme levels of overbought or oversold conditions, it indicates a potential reversal in the market. The Zero Lag Moving Average further enhances this signal by reducing delays and providing timely exit points.
Moreover, the RSI of a Zero Lag Indicator is not limited to mean reversion strategies. While it excels in identifying mean reversion opportunities, it can also be used in conjunction with other trading approaches. Traders can take advantage of its objective signals to exit trades profitably, regardless of their chosen strategy.
With its ability to accurately pinpoint overbought and oversold conditions, the RSI of a Zero Lag Indicator offers traders a competitive edge in the market. By providing timely exit signals and minimizing lag, it helps traders optimize their trading decisions and increase their chances of success.

Multi-Divergence Buy/Sell IndicatorThe "Multi-Divergence Buy/Sell Indicator" is a technical analysis tool that combines multiple divergence signals from different indicators to identify potential buy and sell opportunities in the market. Here's a breakdown of how the indicator works and how to use it:
Input Parameters:
RSI Length: Specifies the length of the RSI (Relative Strength Index) calculation.
MACD Short Length: Specifies the short-term length for the MACD (Moving Average Convergence Divergence) calculation.
MACD Long Length: Specifies the long-term length for the MACD calculation.
MACD Signal Smoothing: Specifies the smoothing length for the MACD signal line calculation.
Stochastic Length: Specifies the length of the Stochastic oscillator calculation.
Stochastic Overbought Level: Defines the overbought level for the Stochastic oscillator.
Stochastic Oversold Level: Defines the oversold level for the Stochastic oscillator.
Calculation of Indicators:
RSI: Calculates the RSI based on the specified RSI Length.
MACD: Calculates the MACD line, signal line, and histogram based on the specified MACD parameters.
Stochastic: Calculates the Stochastic oscillator based on the specified Stochastic parameters.
Divergence Detection:
RSI Divergence: Identifies a bullish divergence when the RSI crosses above its 14-period simple moving average (SMA).
MACD Divergence: Identifies a bullish divergence when the MACD line crosses above the signal line.
Stochastic Divergence: Identifies a bullish divergence when the Stochastic crosses above its 14-period SMA.
Buy and Sell Conditions:
Buy Condition: Triggers a buy signal when all three divergences (RSI, MACD, and Stochastic) occur simultaneously.
Sell Condition: Triggers a sell signal when both RSI and MACD divergences occur, but Stochastic divergence does not occur.
Plotting Buy/Sell Signals:
The indicator plots green "Buy" labels below the price bars when the buy condition is met.
It plots red "Sell" labels above the price bars when the sell condition is met.
Usage:
The indicator can be used on any timeframe and for any trading instrument.
Look for areas where all three divergences (RSI, MACD, and Stochastic) align to generate stronger buy and sell signals.
Consider additional technical analysis and risk management strategies to validate the signals and manage your trades effectively.
Remember, no indicator guarantees profitable trades, so it's essential to use this indicator in conjunction with other tools and perform thorough analysis before making trading decisions.
Feel free to ask any questions

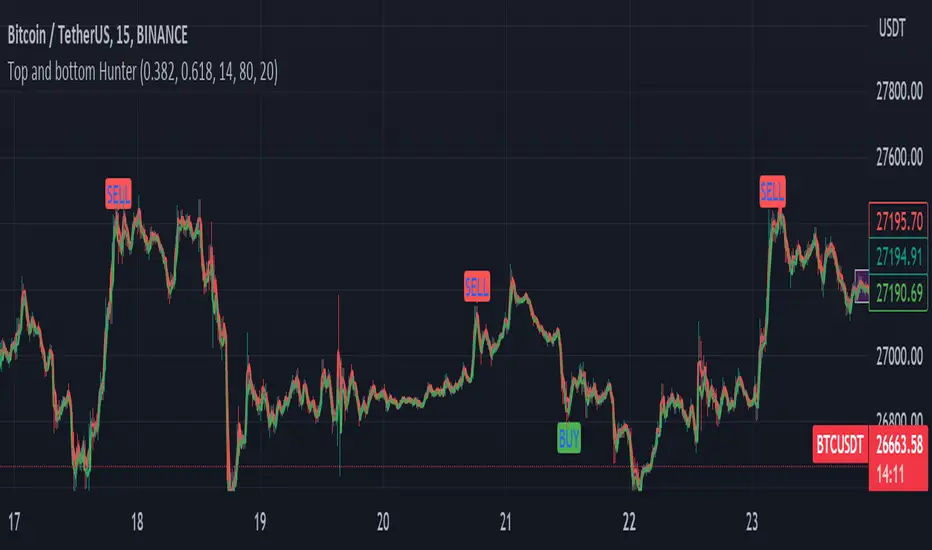
Fib top and bottom Hunter - No Repaint "Top and bottom Hunter" indicator combines two popular technical analysis tools, Fibonacci retracement levels and the Relative Strength Index (RSI), to identify potential trading opportunities in the market.
Fibonacci retracement levels are based on the Fibonacci sequence, a mathematical series where each number is the sum of the two preceding ones. In trading, Fibonacci retracement levels are used to identify potential support and resistance levels based on the recent price action. The indicator uses two Fibonacci levels, fib_0 and fib_1, which are typically set to 0.382 and 0.618, respectively. These levels represent common retracement ratios.
To calculate the Fibonacci levels, the indicator considers the highest and lowest prices within a specified range, typically the highest and lowest of the last two bars. It calculates the fib_range, which is the difference between the highest and lowest prices. Then, fib_level_0 and fib_level_1 are determined by subtracting the Fibonacci ratios from the highest price.
The RSI is a momentum oscillator that measures the speed and change of price movements. It helps identify overbought and oversold conditions in the market. The RSI parameters used in this indicator are rsi_length (length of the RSI calculation), rsi_overbought (upper threshold indicating overbought conditions), and rsi_oversold (lower threshold indicating oversold conditions). The RSI value is calculated based on the closing prices.
The indicator generates buy and sell signals based on specific conditions:
Buy Condition: A buy signal is triggered when the RSI crosses above the oversold level (rsi_oversold) and the closing price is higher than fib_level_1. This indicates a potential reversal or bounce from the Fibonacci support level.
Sell Condition: A sell signal is triggered when the RSI crosses below the overbought level (rsi_overbought) and the closing price is lower than fib_level_0. This suggests a potential reversal or pullback from the Fibonacci resistance level.
In summary, this indicator combines the power of Fibonacci retracement levels and the RSI to identify potential trading opportunities. It helps traders find confluence between the Fibonacci support or resistance levels and the RSI readings, indicating potential trend reversals or bounces. Traders can use this information to make informed decisions about entering or exiting positions in the market.
Feel free to change the settings for what works best for you and use this with other confluences. I personally use RSI overbought and oversold values as 80 and 20
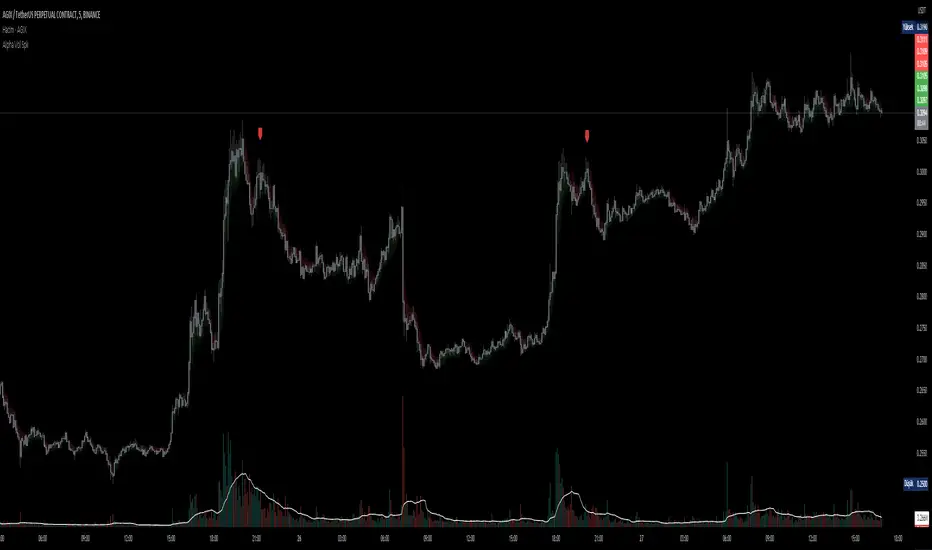
D-BoT Alpha Volume SpikeHello traders, Let me explain the code and provide an example of how to trade using this indicator.
The code you provided is a Pine Script indicator that combines multiple technical indicators, such as Supertrend, ADX, RSI, and MFI, to generate buy and sell signals. Here's a breakdown of the code:
User Settings:
The user can adjust parameters like overbought_limit, oversold_limit, volume_multiplier, volume_ma_length, volume_spike_multiple, lookback_period, and use_extremities_confirmation according to their preference.
Calculate Supertrend:
The Supertrend indicator is calculated using three different ATR lengths (supertrend_atr_period1, supertrend_atr_period2, supertrend_atr_period3) and corresponding factors (supertrend_factor1, supertrend_factor2, supertrend_factor3).
The supertrend_value1, supertrend_value2, and supertrend_value3 represent the Supertrend values, while trend_direction1, trend_direction2, and trend_direction3 indicate the trend direction (negative for downtrend, positive for uptrend).
Candle calculations:
The high and low values are checked to identify bullish and bearish candles based on specific conditions.
Volume Spikes:
Volume spikes are detected by comparing the current volume with a median volume over a specified lookback period.
If the volume exceeds a certain multiple of the median volume and the DI+ value is greater than the DI- value, an "up" signal is generated. Similarly, if the DI- value is greater than the DI+ value, a "down" signal is generated.
Additional Filters (RSI and MFI):
Relative Strength Index (RSI) and Money Flow Index (MFI) are used as additional filters.
The RSI and MFI parameters can be adjusted according to the user's preference.
The signals generated by the volume spikes are filtered based on RSI and MFI conditions.
Plotting:
The indicator plots shapes (triangles) to represent buy and sell signals.
The Supertrend lines are plotted using different colors and transparency levels based on the distance from the current price.
The "bodyMiddle" plot is used for filling the area between the Supertrend lines.
Example Trade Scenario:
Let's consider an example trade scenario using this indicator:
When the indicator generates an "up" signal (trendBuy = true), indicating a potential bullish trend, and all the confirmation conditions (RSI, MFI, Supertrend) are met, you can consider opening a long position.
Conversely, when the indicator generates a "down" signal (trendSell = true), indicating a potential bearish trend, and all the confirmation conditions are met, you can consider opening a short position.
Remember, this is just an example, and it's crucial to perform thorough analysis and consider other factors before making trading decisions. It's recommended to backtest the strategy, assess risk management, and apply appropriate position sizing techniques.
Please note that the code provided is a simplified version, and there might be additional factors and considerations specific to your trading strategy that are not included in this code. *******"I have also reviewed the following indicators, and the volume calculation approaches of my friends have been very helpful in creating this indicator: "Volume Spikes " © tradeforopp and "Volume Spikes & Growing Volume Signals With Alerts & Scanner" © FriendOfTheTrend."*******
TTP NVT StudioNVT Studio is an indicator that aims to find areas of reversal of the Bitcoin price based on the extreme areas of Network Value Transaction.
Instructions:
- We recommend using it on INDEX:BTCUSD
- Use the daily or weekly timeframe
The indicator works as an oscillator and offers to visualisation modes.
1) Showing the short term oscillations of NVT showing signals in potential areas of reversal.
2) The actual value of NVT displayed. When in green is an area of value and in red when its overextended.
This indicator can be used based on the signals or based on breakouts of trend lines drawn in the oscillator mode.
Red/green dots: signal type 1 - extremes with confirmation, these might trigger late
Yellow/Orange: signal type 2 - extremes without confirmation, might trigger too soon

Hobbiecode - RSI + Close previous dayThis is a simple strategy that is working well on SPY but also well performing on Mini Futures SP500. The strategy is composed by the followin rules:
1. If RSI(2) is less than 15, then enter at the close.
2. Exit on close if today’s close is higher than yesterday’s high.
If you backtest it on Mini Futures SP500 you will be able to track data from 1993. It is important to select D1 as timeframe.
Please share any comment or idea below.
Have a good trading,
Ramón.

Hobbiecode - Five Day Low RSI StrategyThis is a simple strategy that is working well on SPY but also well performing on Mini Futures SP500. The strategy is composed by the followin rules:
1. If today’s close is below yesterday’s five-day low, go long at the close.
2. Sell at the close when the two-day RSI closes above 50.
3. There is a time stop of five days if the sell criterium is not triggered.
If you backtest it on Mini Futures SP500 you will be able to track data from 1993. It is important to select D1 as timeframe.
Please share any comment or idea below.
Have a good trading,
Ramón.

Volume-Weighted RSI with Adaptive SmoothingThis indicator is designed to provide traders with insights into the relative strength of a security by incorporating volume-weighted elements, effectively combining the concepts of Relative Strength Index (RSI) and volume-weighted averages to generate meaningful trading signals.
The indicator calculates the traditional RSI, which measures the speed and change of price movements, as well as the volume-weighted RSI, which considers the influence of trading volume on price action. It then applies adaptive smoothing to the volume-weighted RSI, allowing for customization of the smoothing process. The resulting smoothed volume-weighted RSI is plotted alongside the original RSI, providing traders with a comprehensive view of the price strength dynamics.
The line coloration in this indicator is designed to provide visual cues about the relationship between the RSI and the volume-weighted RSI. When the RSI line is above or equal to the volume-weighted RSI line, it suggests a potentially bullish condition with positive market momentum. In such cases, the line is colored lime. Conversely, when the RSI line (fuchsia) is below the volume-weighted RSI line, it indicates a potentially bearish condition with negative market momentum. The line color is set to fuchsia. By observing the line color, traders can quickly assess the relative strength between the RSI and the volume-weighted RSI, aiding their decision-making process.
The bar color and background color further enhance the visual interpretation of the indicator. The bar color reflects the RSI's relationship with the volume-weighted RSI and the predefined thresholds. If the RSI line is above both the volume-weighted RSI line and the overbought threshold (70), the bar color is set to lime, indicating a potentially overbought condition. Conversely, if the RSI line is below both the volume-weighted RSI line and the oversold threshold (30), the bar color is set to fuchsia, suggesting a potentially oversold condition. When the RSI line is between these two thresholds, the bar color is set to yellow, indicating a neutral or intermediate state. The background color, displayed with a semi-transparent shade, provides additional context by reflecting the prevailing market conditions. It turns lime if the volume-weighted RSI is above the overbought threshold, fuchsia if below the oversold threshold, and yellow if it falls between these two thresholds. This coloration scheme aids traders in quickly assessing market conditions and potential trading opportunities.
Calculations:
-- RSI Calculation : The traditional RSI is calculated based on the price movements of the asset. The up and down movements are determined, and exponential moving averages are used to smooth the values. The RSI value ranges from 0 to 100, with levels above 70 indicating overbought conditions and levels below 30 indicating oversold conditions.
-- Volume-Weighted RSI Calculation : The volume-weighted RSI incorporates the trading volume of the asset into the calculations. The closing price is multiplied by the corresponding volume, and the average is taken over a specific length. The up and down movements are smoothed using exponential moving averages to generate the volume-weighted RSI value.
-- Adaptive Smoothing : The indicator offers an adaptive smoothing option, allowing traders to customize the smoothing process of the volume-weighted RSI. By adjusting the smoothing length, traders can fine-tune the responsiveness of the indicator to changes in market conditions. Smoothing helps reduce noise and enhances the clarity of the signals.
Interpretation:
The indicator provides two main components for interpretation:
-- RSI : The traditional RSI reflects the price momentum and potential overbought or oversold conditions. Traders can look for RSI values above 70 as potential overbought signals, suggesting a possible price reversal or correction. Conversely, RSI values below 30 indicate potential oversold signals, indicating a potential price rebound or rally.
-- Volume-Weighted RSI : The volume-weighted RSI incorporates trading volume, which provides insights into the strength of price movements. When the volume-weighted RSI is above the traditional RSI, it suggests that the buying pressure supported by higher volume is stronger, potentially indicating a more reliable trend. Conversely, when the volume-weighted RSI is below the traditional RSI, it suggests that the selling pressure supported by higher volume is stronger, potentially indicating a more significant price reversal.
Potential Strategies:
-- Overbought and Oversold Signals : Traders can utilize the RSI component of the indicator to identify overbought and oversold conditions. A potential strategy is to consider taking short positions when the RSI is above 70 and long positions when the RSI is below 30. These levels can act as dynamic support and resistance areas, indicating possible price reversals.
-- Confirmation with Volume : Traders can use the volume-weighted RSI as a confirmation tool to validate price movements. When the volume-weighted RSI is above the traditional RSI, it may provide additional confirmation for long positions, suggesting stronger buying pressure. Conversely, when the volume-weighted RSI is below the traditional RSI, it may provide confirmation for short positions, indicating stronger selling pressure.
-- Trend Reversal Strategy : Watch for the volume-weighted RSI to reach extreme levels above 70 (overbought) or below 30 (oversold). Look for a reversal signal where the RSI line (green or fuchsia) crosses below or above the volume-weighted RSI line. Enter a trade when the reversal signal occurs, and the RSI line changes color. Exit the trade when the RSI line crosses back in the opposite direction or reaches the opposite extreme level.
-- Divergence Strategy : Compare the direction of the RSI line (green or fuchsia) with the volume-weighted RSI line. A bullish divergence occurs when the RSI line makes higher lows while the volume-weighted RSI line makes lower lows. A bearish divergence occurs when the RSI line makes lower highs while the volume-weighted RSI line makes higher highs. Once a divergence is identified, wait for the RSI line to cross above or below the volume-weighted RSI line as confirmation of a potential trend reversal. Consider using additional indicators or price action analysis to time the entry more accurately. Use stop-loss orders and profit targets to manage risk and secure profits.
-- Trend Continuation Strategy : Assess the overall trend direction by observing the RSI line's position relative to the volume-weighted RSI line. When the RSI line consistently stays above the volume-weighted RSI line, it indicates a bullish trend, while the opposite suggests a bearish trend. Look for temporary pullbacks within the ongoing trend where the RSI line (green or fuchsia) touches or crosses the volume-weighted RSI line. Enter trades in the direction of the dominant trend when the RSI line crosses back in the trend direction. Exit the trade when the RSI line starts to deviate significantly from the volume-weighted RSI line or when the trend shows signs of weakening through other technical or fundamental factors.
Limitations:
-- False Signals : Like any indicator, the "Volume-Weighted RSI with Adaptive Smoothing" may produce false signals, especially during periods of low liquidity or choppy market conditions. Traders should exercise caution and consider using additional confirmation indicators or tools to validate the signals generated by this indicator.
-- Lagging Nature : The indicator relies on historical price data and volume to calculate the RSI and volume-weighted RSI. As a result, the signals provided may have a certain degree of lag compared to real-time price action. Traders should be aware of this inherent lag and consider combining the indicator with other timely indicators to enhance the accuracy of their trading decisions.
-- Parameter Sensitivity : The indicator's effectiveness can be influenced by the choice of parameters, such as the length of the RSI, smoothing length, and adaptive smoothing option. Different market conditions may require adjustments to these parameters to optimize performance. Traders are encouraged to conduct thorough testing and analysis to determine the most suitable parameter values for their specific trading strategies and preferences.
-- Market Conditions : The indicator's performance may vary depending on the prevailing market conditions. It is essential to understand that no indicator can guarantee accurate predictions or consistently profitable trades. Traders should consider the broader market context, fundamental factors, and other technical indicators to complement the insights provided by the "Volume-Weighted RSI with Adaptive Smoothing" indicator.
-- Subjectivity : Interpretation of the indicator's signals involves subjective judgment. Traders may have varying interpretations of overbought and oversold levels, as well as the significance of the volume-weighted RSI in relation to the traditional RSI. It is crucial to combine the indicator with personal analysis and trading experience to make informed trading decisions.
Remember, no single indicator can provide foolproof trading signals. The "Volume-Weighted RSI with Adaptive Smoothing" indicator serves as a valuable tool for analyzing price strength and volume dynamics. It can assist traders in identifying potential entry and exit points, validating trends, and managing risk. However, it should be used as part of a comprehensive trading strategy that considers multiple factors and indicators to increase the likelihood of successful trades.

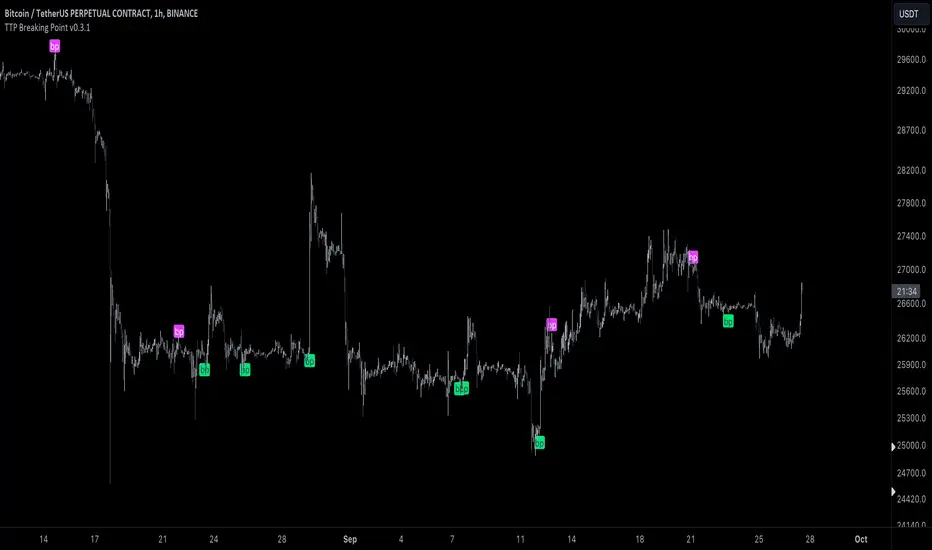
TTP Breaking PointThis signal uses information from BITFINEX:BTCUSDLONGS and BITFINEX:BTCUSDSHORTS to forecast tops and bottoms.
The idea behind is very simple.
We calculate the RSI of the ratio of longs vs shorts and find areas where both the SMA of this RSI and the RSI itself are overextended.
You might notice that the win rate is not high but most of the wins provide a decent move that, if combined with proper risk management, can be used to build profitable strategies.
The signal offers a backtesting stream: 1 for buy and 2 for sell.
Shortly I'll be adding new features including: alerts, support for other symbols, filters, etc.
AlphaTrend - ScreenerScreener version of AlphaTrend indicator:
BUY / LONG when AlphaTrend line crosses above its 2 bars offsetted line, and there would be a green filling between them
SELL / SHORT when AlphaTrend line crosses below its 2 bars offsetted line, and filling would be red then.
Default values:
Coefficient: 1, which is the factor of the trailing ATR value
Common Period: 14, which is the length of ATR MFI and RSI
AlphaTrend default uses MFI in the calculation, and MFI (Money Flow Index) needs the volume data of the chart.
If your chart doesn't have the volume data, please select the "Change Calculation" option to use RSI instead of MFI.
Screener Panel:
You can explore 20 different and user-defined tickers, which can be changed from the SETTINGS (shares, crypto, commodities...) on this screener version.
The screener panel shows up right after the bars on the right side of the chart.
Tickers seen in green are the ones that are in an uptrend, according to AlphaTrend.
The ones that appear in red are those in the SELL signal, in a downtrend.
The numbers in front of each Ticker indicate how many bars passed after the last BUY or SELL signal of AlphaTrend.
For example, according to the indicator, when BTCUSDT appears in (3) and in GREEN, Bitcoin switched to BUY signal 3 bars ago.

Multi-indicator by TonyMontanovThe indicator was made at the request of the subscriber of the "The trader sometimes answers"
The indicator displays:
1. Anomalous spikes in volume (i.e. the value of the volume is greater than the moving average of the volume plus a few standard deviations
2. Crossing moving averages
3. Crossing the MRSI zero line
The user can change the settings:
1. Types of moving average
2. Length sliding average
3. Number of volume standard deviations
4. Display mode
5. Index ticker
Step RSI [Loxx]Enhanced Moving Average Calculation with Stepped Moving Average and the Advantages over Regular RSI
Technical analysis plays a crucial role in understanding and predicting market trends. One popular indicator used by traders and analysts is the Relative Strength Index (RSI). However, an enhanced approach called Stepped Moving Average, in combination with the Slow RSI function, offers several advantages over regular RSI calculations.
Stepped Moving Average and Moving Averages:
The Stepped Moving Average function serves as a crucial component in the calculation of moving averages. Moving averages smooth out price data over a specific period to identify trends and potential trading signals. By employing the Stepped Moving Average function, traders can enhance the accuracy of moving averages and make more informed decisions.
Stepped Moving Average takes two parameters: the current RSI value and a size parameter. It computes the next step in the moving average calculation by determining the upper and lower bounds of the moving average range. It accomplishes this by adjusting the values of smax and smin based on the given RSI and size.
Furthermore, Stepped Moving Average introduces the concept of a trend variable. By comparing the previous trend value with the current RSI and the previous upper and lower bounds, it updates the trend accordingly. This feature enables traders to identify potential shifts in market sentiment and make timely adjustments to their trading strategies.
Advantages over Regular RSI:
Enhanced Range Boundaries:
The inclusion of size parameters in Stepped Moving Average allows for more precise determination of the upper and lower bounds of the moving average range. This feature provides traders with a clearer understanding of the potential price levels that can influence market behavior. Consequently, it aids in setting more effective entry and exit points for trades.
Improved Trend Identification:
The trend variable in Stepped Moving Average helps traders identify changes in market trends more accurately. By considering the previous trend value and comparing it to the current RSI and previous bounds, Stepped Moving Average captures trend reversals with greater precision. This capability empowers traders to respond swiftly to market shifts and potentially capture more profitable trading opportunities.
Smoother Moving Averages:
Stepped Moving Average's ability to adjust the moving average range bounds based on trend changes and size parameters results in smoother moving averages. Regular RSI calculations may produce jagged or erratic results due to abrupt market movements. Stepped Moving Average mitigates this issue by dynamically adapting the range boundaries, thereby providing traders with more reliable and consistent moving average signals.
Complementary Functionality with Slow RSI:
Stepped Moving Average and Slow RSI function in harmony to provide a comprehensive trading analysis toolkit. While Stepped Moving Average refines the moving average calculation process, Slow RSI offers a more accurate representation of market strength. The combination of these two functions facilitates a deeper understanding of market dynamics and assists traders in making better-informed decisions.
Extras
-Alerts
-Signals

RSI Divergences on price chart - Open Source CodeHello Traders,
I have some exciting news to share with you all! Recently, I came across an incredible RSI divergences indicator developed by Socrate_FR. This indicator, in my opinion has an exceptional accuracy in detecting RSI divergences. However, during my exploration of other indicators in the TradingView library that display signals on the price chart, I found that many of them were often unreliable and missed out on important divergences.One such example is the Prices / RSI Divergences Detector by vtllr. Although vtllr did an amazing job with the indicator, I noticed that it didn't capture several relevant divergences accurately.
This observation inspired me to enhance the most accurate RSI divergences indicator available by showcasing the signals directly on the price chart. By doing so, I aimed to address the issue of unreliable and missed divergences in other price chart indicators. With this enhanced version, you can now effortlessly identify and track RSI regular divergences on the price chart itself:
-Regular bullish divergence occurs when the price forms lower lows while the RSI indicator forms higher lows. It suggests a potential bullish reversal (green line plot)
-Regular bearish divergence occurs when the price forms higher highs while the RSI indicator forms lower highs. It suggests a potential bearish reversal (red line plot)
Another key mofication:
This Indicator introduces a simpler approach compared to the original Socrate indicator. While Socrate differentiated divergences into eight types for both bullish and bearish scenarios, our enhanced version focuses on two distinct categories: small and big divergences. This decision was made to provide a clearer and more user-friendly experience. By condensing the divergence types into two groups, traders can easily identify and analyze the significance of the divergences without getting overwhelmed by excessive variations. The small divergences represent relatively minor divergences, while the big divergences indicate stronger and more significant signals.
-Small divergences represent relatively minor divergences (plotshape small circle)
-Big divergences indicate stronger signals (plotshape big circle)
I firmly believe that this enhanced RSI Divergences Indicator will be an invaluable tool for traders who rely on RSI analysis in their trading strategies. It combines the accuracy of Socrate_FR's original indicator with the enhanced visibility of signals on the price chart, ensuring you never miss any important divergences.
If you're interested in trying out this enhanced version of the indicator, please feel free to access the open-source code. If you want to visit and try the original version of the code visit Socrate_FR profile.
www.tradingview.com
Keep attention!
It is important to note that no trading indicator or strategy is foolproof, and there is always a risk of losses in trading. While this indicator may provide useful information for making conclusions, it should not be used as the sole basis for making trading decisions. Traders should always use proper risk management techniques and consider multiple factors when making trading decisions.
Support us:)
If you find this new indicator helpful in your trading analysis, I would greatly appreciate your support! Please consider to follow, giving it a like, leaving feedback, or sharing it with your trading network. Your engagement will not only help me improve this tool but will also help other traders discover it and benefit from its features. Thank you for your support!

Market Cycle IndicatorThe Market Cycle Indicator is a tool that integrates the elements of RSI, Stochastic RSI, and Donchian Channels. It is designed to detect market cycles, enabling traders to enter and exit the market at the most opportune times.
This indicator provides a unique perspective on the market, combining multiple strategies into one unified and weighted approach. By factoring in the inputs from each of these popular technical analysis methods, it offers a more holistic view of the market trends and cycles.
Parameter Details:
Donchian Channels (DCO):
- donchianPeriod: Sets the period for the Donchian Channel calculation. Default is set to 14.
- donchianSmoothing: Sets the smoothing factor for the Donchian Channel calculation. Default is set to 3.
- donchianPrice: Selects the price type to be used in the Donchian Channel calculation. Default is set to the closing price.
Relative Strength Index (RSI):
- rsiPeriod: Sets the period for the RSI calculation. Default is set to 14.
- rsiSmoothing: Sets the smoothing factor for the RSI calculation. Default is set to 3.
- rsiPrice: Selects the price type to be used in the RSI calculation. Default is set to the closing price.
Stochastic RSI (StochRSI):
- srsiPeriod: Sets the period for the Stochastic RSI calculation. Default is set to 20.
- srsiSmoothing: Sets the smoothing factor for the Stochastic RSI calculation. Default is set to 3.
- srsiK: Sets the period for the %K line in the Stochastic RSI calculation. Default is set to 5.
- srsiD: Sets the period for the %D line in the Stochastic RSI calculation. Default is set to 5.
- srsiPrice: Selects the price type to be used in the Stochastic RSI calculation. Default is set to the closing price.
Weights:
- rsiWeight: Sets the weight for the RSI in the final aggregate calculation. Default is set to 1.
- srsiWeight: Sets the weight for the Stochastic RSI in the final aggregate calculation. Default is set to 1.
- dcoWeight: Sets the weight for the Donchian Channel in the final aggregate calculation. Default is set to 1.
Limits:
- limitHigh: Sets the upper limit for the indicator. Default is set to 80.
- limitLow: Sets the lower limit for the indicator. Default is set to 20.
By customizing these parameters, users can tweak the indicator to align with their own trading strategies and risk tolerance levels. Whether you're a novice or an experienced trader, the Comprehensive Market Cycle Indicator provides valuable insights into the market's behavior.
Uses library HelperTA

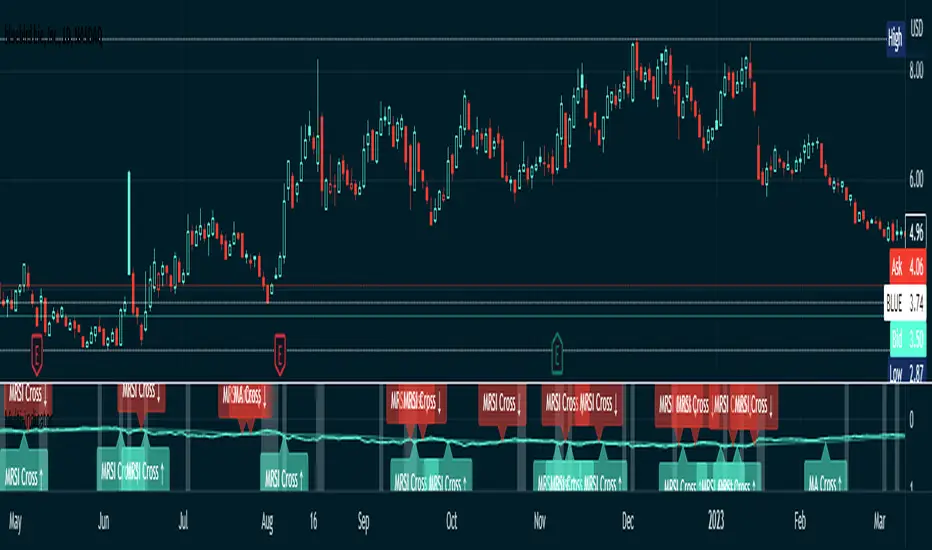
RSI, SRSI, MACD and DMI cross - Open source codeHello,
I'm a passionate trader who has spent years studying technical analysis and exploring different trading strategies. Through my research, I've come to realize that certain indicators are essential tools for conducting accurate market analysis and identifying profitable trading opportunities. In particular, I've found that the RSI, SRSI, MACD cross, and Di cross indicators are crucial for my trading success.
Detailed explanation:
The RSI is a momentum indicator that measures the strength of price movements. It is calculated by comparing the average of gains and losses over a certain period of time. In this indicator, the RSI is calculated based on the close price with a length of 14 periods.
The Stochastic RSI is a combination of the Stochastic Oscillator and the RSI. It is used to identify overbought and oversold conditions of the market. In this indicator, the Stochastic RSI is calculated based on the RSI with a length of 14 periods.
The MACD is a trend-following momentum indicator that shows the relationship between two moving averages of prices. It consists of two lines, the MACD line and the signal line, which are used to generate buy and sell signals. In this indicator, the MACD is calculated based on the close price with fast and slow lengths of 12 and 26 periods, respectively, and a signal length of 9 periods.
The DMI is a trend-following indicator that measures the strength of directional movement in the market. It consists of three lines, the Positive Directional Indicator (+DI), the Negative Directional Indicator (-DI), and the Average Directional Index (ADX), which are used to generate buy and sell signals. In this indicator, the DMI is calculated with a length of 14 periods and an ADX smoothing of 14 periods.
The indicator generates buy signals when certain conditions are met for each of these indicators.
1) For the RSI, a buy signal is generated when the RSI is below or equal to 35 and the Stochastic RSI %K is below or equal to 15, or when the RSI is below or equal to 28 the Stochastic RSI %K is below or equal to 15 or when the RSI is below or equal to 25 and the Stochastic RSI %K is below or equal to 10 or when the RSI is below or equal to 28.
2) For the MACD, a buy signal is generated when the MACD line is below 0, there is a change in the histogram from negative to positive, the MACD line and histogram are negative in the previous period, and the current histogram value is greater than 0.
3) For the DMI, a buy signal is generated when the Positive Directional Indicator (+DI) crosses above the Negative Directional Indicator (-DI), and the -DI is less than the +DI.
The indicator generates sell signals when certain conditions are met for each of these indicators:
1) For the RSI, a sell signal is generated when the RSI is above or equal to 75 and the Stochastic RSI %K is above or equal to 85, or when the RSI is above or equal to 80 and the Stochastic RSI %K is above or equal to 85, or when the RSI is above or equal to 85 and the Stochastic RSI %K is above or equal to 90 or when the RSI is above or equal to 82.
2)For the MACD, a sell signal is generated when the MACD line is above 0, there is a change in the histogram from positive to negative, the MACD line and histogram are positive in the previous period, and the current histogram value is less than the previous histogram value. On the other hand, a buy signal is generated when the MACD line is below 0, there is a change in the histogram from negative to positive, the MACD line and histogram are negative in the previous period, and the current histogram value is greater than the previous histogram value.
3)For the DMI a bearish signal is generated when plusDI crosses above minusDI, indicating that bulls are losing strength and bears are taking control.
The indicator uses a combination of these four indicators to generate potential buy and sell signals. The buy signals are generated when RSI and SRSI values are in oversold conditions, while sell signals are generated when RSI and SRSI values are in overbought conditions. The indicator also uses MACD crossovers and DMI crossovers to generate additional buy and sell signals.
When a signal is strong?
The use of multiple signals within a specific timeframe can increase the accuracy and reliability of the signals generated by this indicator. It is recommended to look for at least two signals within a range of 5-8 candles in order to increase the probability of a successful trade.
Why it's original?
1) There is no indicator in the library that combine all of these indicators and give you a 360 view
2)The combination of the RSI, Stochastic RSI, MACD, and DMI indicators in a single script it's unique and not available in the libray.
3)The specific parameters and conditions used to calculate the signals may be unique and not found in other scripts or libraries.
4)The use of plotshape() to plot the signals as shapes on the chart may be unique compared to other scripts that simply plot lines or bars to indicate signals.
5)The use of alertcondition() to trigger alerts based on the signals may be unique compared to other scripts that do not have custom alert functionality.
Keep attention!
It is important to note that no trading indicator or strategy is foolproof, and there is always a risk of losses in trading. While this indicator may provide useful information for making conclusions, it should not be used as the sole basis for making trading decisions. Traders should always use proper risk management techniques and consider multiple factors when making trading decisions.
Support me:)
If you find this new indicator helpful in your trading analysis, I would greatly appreciate your support! Please consider giving it a like, leaving feedback, or sharing it with your trading network. Your engagement will not only help me improve this tool but will also help other traders discover it and benefit from its features. Thank you for your support!

Rainbow Drift BetaRainbow Drift Beta is an indicator that detects the triggers of long and short positions at any TF.
It's based on two different type of approaches to the EMAs periods:
- Classic EMAs periods: 10 and 50
- Cycle EMAs perdios: 16, 64 and 256
The 256 period EMA (Annual Cycle) detects the trend: if the EMA 64 (Three-Weekly Cycle) is above, it shows an uptrend; while the EMA 64 is below, it means that the price action is in downtrend.
10 and 16 periods EMAs are working together as well as the 50 and the 64. The first couple reacts faster than the second one and as soon as the 10 is above the 16, the band shows the first attempt of the price action to go in the uptrend direction. The same concept is applied to the second couple (50, 64): when EMA 50 > EMA 64 it's a confirmation of the faster EMAs long direction. Viceverca happens for the downtrend but with the same concept.
As the EMA periods taken in consideration are quite often a sensitive level of reaction of the price, the indicator detects when there is trigger of a long or a short set up and plots a label on the chart. It's possibile to set up an alert as well.
Quite important, the indicator is looking for sideways patterns as the breakout of them shows a clear direction of the price.
Moreover, in order to privide the first and the best entry possibile, the indicator has a function that is triggering only one time as the trend reverted: for example, a long entry on the EMA 10-16 happens only one time since they crossover the EMA 64.
As included in the name, this is a beta version and new improvements will be added in the near future like suggested price entry, SL and TP, and the focus of the development is to avoid as much as possibile the false triggers.
Of course the best way to improve the code is to receive the users' feedbacks, so please feel free to post your comments and questions.

RSI MTF DashboardThis is an RSI dashboard, which allows you to see the current RSI value for five timeframes across up to 8 tickers of your choice. This is a useful tool to gauge momentum across multiple timeframes, where you would look to enter a buy with high RSI values across the timeframes (and vice versa for sell positions).
Conversely, some traders use RSI to identify potential areas for reversals, so you would look to buy with low RSI values (and vice versa for sell positions).
In the settings, please select which 5 timeframes you require. Then select which tickers you wish to see, and you will find a dashboard on your chart to show the RSI values. The dashboard can be highlighted when the RSI value shows bearish momentum (a value under 50, of your choice) and bullish momentum (a value over 50, again of your choice). These colours and values are fully customisable.
In the settings you can also select the location of the dashboard, as well as some colour and transparency settings to enable the best possible view on screen.

RSI TrueLevel StrategyThis strategy is a momentum-based strategy that uses the Relative Strength Index (RSI) indicator and a TrueLevel envelope to generate trade signals.
The strategy uses user-defined input parameters to calculate TrueLevel envelopes for 14 different lengths. The TrueLevel envelope is a volatility-based technical indicator that consists of upper and lower bands. The upper band is calculated by adding a multiple of the standard deviation to a linear regression line of the price data, while the lower band is calculated by subtracting a multiple of the standard deviation from the same regression line.
The strategy generates long signals when the RSI crosses above the oversold level or when the price crosses above the selected lower band of the TrueLevel envelope. It generates short signals when the RSI crosses below the overbought level or when the price crosses below the selected upper band of the TrueLevel envelope.
The strategy allows for long and short trades and sets the trade size as a percentage of the account equity. The colors of the bands and fills are also customizable through user-defined input parameters.
In this strategy, the 12th TrueLevel band was chosen due to its ability to capture significant price movements while still providing a reasonable level of noise reduction. The strategy utilizes a total of 14 TrueLevel bands, each with varying lengths. The 12th band, with a length of 2646, strikes a balance between sensitivity to market changes and reducing false signals, making it a suitable choice for this strategy.
RSI Parameters:
In this strategy, the RSI overbought and oversold levels are set at 65 and 40, respectively. These values were chosen to filter out more noise in the market and focus on stronger trends. Traditional RSI overbought and oversold levels are set at 70 and 30, respectively. By raising the oversold level and lowering the overbought level, the strategy aims to identify more significant trend reversals and potential trade opportunities.
Of course, the parameters can be adjusted to suit individual preferences.

KDJ-RSI Buy/Sell Signal ver. 1It is an indicator combining the RSI indicator and KDJ indicator.
Buy signal will triggers when:
RSI signal positioning below 25
J value crosses below 0
Sell signal will triggers when:
RSI signal positioning above 85
J value crosses above 100
***********
Please take note that this indicator may be not accurate for every chart in the crypto market, but it is most appropriate to use it in BTC/USDT charts, mainly for 1h, 4h, and 1d candles. Not recommended to use it for 1m or 15m leverage trades, this indicator might be altered by FOMO sentiment.
