RSI Z-score | Lemniscuss🧠 Introducing RSI Z-Score (RSI-Z) by Lemniscuss
🛠️ Overview
RSI Z-Score (RSI-Z) is a momentum-based market condition detector that transforms the classic Relative Strength Index (RSI) into a standardized volatility framework.
By applying Z-Score normalization to the RSI, this tool allows traders to identify statistically significant deviations in momentum — cutting through noise and highlighting high-probability turning points.
RSI-Z is optimized for trend inflection detection and overextension spotting, providing both visual clarity and actionable trade signals with dynamic labeling and optional bar coloring.
🔍 How It Works
1️⃣ RSI Foundation
The system starts with a standard RSI calculation on a user-defined source and length (default: 45).
2️⃣ Z-Score Normalization
The RSI values are standardized by subtracting their mean and dividing by the standard deviation over the same lookback.
This converts RSI into a statistical measure — revealing how many standard deviations current momentum is from its mean.
3️⃣ Threshold Logic
Two customizable thresholds define actionable zones:
• Long Threshold → Signals bullish momentum shifts when crossed upward
• Short Threshold → Signals bearish momentum shifts when crossed downward
4️⃣ Signal State Tracking
A state variable locks in a bias (Long / Short / Neutral) until an opposing trigger appears, ensuring clear and consistent market bias mapping.
✨ Key Features
🔹 Statistically Driven Momentum Detection — Moves beyond fixed RSI overbought/oversold levels by using standard deviations for adaptive accuracy.
🔹 Customizable Thresholds — Fine-tune long/short triggers for different volatility environments.
🔹 Clear Visual Feedback — Candle coloring and signal labels make trade setups instantly recognizable.
🔹 Overlay-Friendly — Works directly on your main chart or in a separate pane.
⚙️ Custom Settings
• Source: Price stream for RSI calculation (default: close)
• RSI Length: Lookback period for RSI & Z-Score (default: 45)
• Long Threshold: Z-score value for bullish signal (default: 1)
• Short Threshold: Z-score value for bearish signal (default: -1.9)
• Long/Cash Signal Labels: Toggle for "Long"/"Short" markers
• Bar Coloring: Toggle for trend-based candle coloring
📌 Trading Applications
✅ Trend Reversals → Spot statistically significant shifts in momentum before traditional RSI signals trigger
✅ Overextension Monitoring → Identify when momentum has deviated too far from the mean
✅ Mean Reversion Setups → Use extreme Z-score values as potential reversion points
✅ Bias Confirmation → Combine with trend tools for higher conviction entries/exits
📌 Conclusion
RSI-Z by Lemniscuss offers a clean, statistics-backed upgrade to the classic RSI.
By framing momentum in standard deviation terms, it empowers traders to separate normal fluctuations from truly significant market moves — making it a valuable tool for both trend traders and mean reversion specialists.
🔹 Summary Highlights
1️⃣ Statistical upgrade to RSI for higher-quality signals
2️⃣ Threshold-based, customizable long/short triggers
3️⃣ Visual candle coloring & signal labels for clarity
4️⃣ Adaptable to trend, swing, or intraday strategies
📌 Disclaimer: Past performance is not indicative of future results. No indicator guarantees profitability — always test and manage risk appropriately.
Chỉ số Sức mạnh Tương quan (RSI)

Minimalist RSI - Nasdaq (14) with Volume Filter and AlertsDescription:
This indicator shows the standard RSI (period 14) adapted for Nasdaq, with a clean and minimalist design. It adds visual levels for overbought (75) and oversold (25), plus an optional centerline 50 to better interpret momentum.
It incorporates a high volume visual filter to confirm signals and avoid false entries in low-interest conditions. Buy and sell signals are based on RSI crosses in extreme zones, optionally filtered by volume to improve reliability.
You can enable automatic alerts to receive notifications when important signals occur.
How to use:
Watch the RSI and its position relative to overbought/oversold zones and the 50 line.
Wait for high volume confirmation for greater reliability (you can disable this filter if preferred).
Use buy and sell signals alongside your price action and overall context analysis to make decisions.
Set alerts to not miss opportunities.
Important Notice:
This indicator is a support tool, not a complete strategy. Trading involves risks and no guarantees. Always use risk management and test the indicator on a demo before using it live.
Personal note:
This is my first script and I would love to receive constructive feedback to improve and offer better tools to the community. Thanks for trying it!
Motivational phrase:
“No risk, no reward.”
RSI Momentum Divergence Zones [ChartPrime]⯁ OVERVIEW
RSI Momentum Divergence Zones is a hybrid oscillator and chart overlay tool that detects RSI-based momentum divergences and projects them as key zones on the chart. By combining RSI divergence logic with horizontal level plotting, this indicator reveals high-probability support and resistance areas where price has historically reacted to hidden or classic divergences.
⯁ KEY FEATURES
Momentum-Based RSI Source:
Instead of the classic RSI input, this tool uses the momentum of price as the RSI source:
rsiSrc = ta.mom(close, 10)
This emphasizes acceleration and deceleration of price moves, sharpening divergence signals and making them more responsive to early shifts in momentum.
Automatic Divergence Detection (Optional):
When enabled, the indicator continuously scans for:
— Bullish Divergence : Price makes a Lower Low while RSI forms a Higher Low
— Bearish Divergence : Price makes a Higher High while RSI forms a Lower High
It ensures divergence is valid by checking the spacing between pivots (min 5, max 50 bars).
Divergence Labels & Markers (RSI Pane + Chart):
When a valid divergence is detected:
— On RSI pane:
Labels appear at HL/LH points (“Bull” / “Bear”)
Colored lines show pivot structures
— On price chart:
Labels (“▲ Bull” / “Bear ▼”) mark price pivot that triggered the divergence
Lines highlight the exact price level at the divergence origin
Divergence Zones / Levels (Toggleable):
The indicator projects horizontal zones across the chart based on confirmed divergence points.
These levels dynamically extend as long as price respects them, and auto-expire once broken.
They act as S/R levels created by market imbalance caused by divergence reactions.
Dynamic Zone Extension Logic:
Once plotted, divergence levels will extend to the right:
— If price respects the level, the zone keeps growing
— If broken in the opposite direction, the level stops extending and turns dashed (visually showing break)
Zone Layering and Limit Control:
You can limit the number of simultaneous zones shown on the chart (e.g., 10 most recent).
Old zones automatically expire and are removed to keep the chart clean and focused.
Color Customization and Intensity:
Different colors for bullish and bearish zones let you easily distinguish trend direction.
Background fill, line width, and transparency are all adjustable.
Clean Zone Management with Arrays:
Behind the scenes, the script uses custom divLevel type arrays to manage plotted levels, ensuring they stay up-to-date, extend correctly, and delete once invalidated.
⯁ USAGE
Use bullish divergence zones as potential demand areas and bearish ones as supply zones.
Combine RSI pane labels with price-level zones to confirm strength of reversal.
Watch for price approaching a divergence level to anticipate reactions or breakouts.
Use divergence levels as trade triggers, stop-loss guides, or take-profit markers.
Limit signal count using the “Qty Divergence Zones” setting to reduce chart clutter.
Enable divergence detection only when you want to focus on key structural zones — ideal for swing or positional setups.
⯁ CONCLUSION
RSI Momentum Divergence Zones blends oscillator divergence logic with price action structure to uncover hidden strength or weakness in the market. With flexible zone plotting and clean visual signals, this tool empowers traders to identify where momentum turns into structure — turning hidden signals into tradable edges.

Multi-Timeframe RSIRSI Divergence (Time-Based Engine)
This script is a powerful and highly customizable tool designed to automatically detect and display RSI divergences from up to three independent, user-defined timeframes directly on your chart. It eliminates the need to manually switch between timeframes to find these critical trading signals, allowing you to see long-term and short-term divergences all in one place.
The engine is built to be flexible, supporting both regular (reversal) divergences and hidden (trend-continuation) divergences. It's designed for traders who rely on divergence analysis as a core part of their strategy.
Key Features
Multi-Timeframe (MTF) Analysis: Configure and display divergences from up to three different timeframes simultaneously (e.g., show 4-Hour, Daily, and Weekly divergences on your 1-Hour chart). Each timeframe operates independently with its own settings.
Regular & Hidden Divergence: The script can detect both standard regular divergences that signal potential reversals and hidden divergences that suggest a trend may continue.
Configurable Pivot Strength: You have full control over the sensitivity of pivot detection. The 'Left Strength' and 'Right Strength' settings allow you to define what qualifies as a significant price pivot, filtering out market noise.
Bar Count Filter: Refine your signals by setting the minimum and maximum number of bars allowed between two pivots. This ensures you only see divergences that fit your specific strategic timeframe.
Dedicated Alerts: Each of the three timeframes has its own "Enable Alerts" toggle. When a new divergence line is drawn on the chart for a specific timeframe, a corresponding alert can be triggered, ensuring you never miss a potential setup.
Full Visual Customization: Tailor the look and feel of the indicator to your preference. Each timeframe has unique color settings for its bullish and bearish lines, allowing for easy visual identification. You can also toggle the visibility of various chart markers to keep your view clean.
How to Use
1. Add the indicator to your chart.
2. Open the Settings panel.
3. For each timeframe you wish to use (1, 2, or 3), check the "Enable Timeframe" box.
4. Select the desired Timeframe, RSI Length, and Pivot Strength for each active engine.
5. Adjust the Min/Max Bars filter to match your trading style.
6. If you want to receive notifications, check the "Enable Alerts" box for the desired timeframe(s). Then, create an alert using TradingView's alert manager, selecting the indicator and choosing the "Any alert() function call" option.

Clean Multi-Indicator Alignment System
Overview
A sophisticated multi-indicator alignment system designed for 24/7 trading across all markets, with pure signal-based exits and no time restrictions. Perfect for futures, forex, and crypto markets that operate around the clock.
Key Features
🎯 Multi-Indicator Confluence System
EMA Cross Strategy: Fast EMA (5) and Slow EMA (10) for precise trend direction
VWAP Integration: Institution-level price positioning analysis
RSI Momentum: 7-period RSI for momentum confirmation and reversal detection
MACD Signals: Optimized 8/17/5 configuration for scalping responsiveness
Volume Confirmation: Customizable volume multiplier (default 1.6x) for signal validation
🚀 Advanced Entry Logic
Initial Full Alignment: Requires all 5 indicators + volume confirmation
Smart Continuation Entries: EMA9 pullback entries when trend momentum remains intact
Flexible Time Controls: Optional session filtering or 24/7 operation
🎪 Pure Signal-Based Exits
No Forced Closes: Positions exit only on technical signal reversals
Dual Exit Conditions: EMA9 breakdown + RSI flip OR MACD cross + EMA20 breakdown
Trend Following: Allows profitable trends to run their full course
Perfect for Swing Scalping: Ideal for multi-session position holding
📊 Visual Interface
Real-Time Status Dashboard: Live alignment monitoring for all indicators
Color-Coded Candles: Instant visual confirmation of entry/exit signals
Clean Chart Display: Toggle-able EMAs and VWAP with professional styling
Signal Differentiation: Clear labels for entries, X-crosses for exits
🔔 Alert System
Entry Notifications: Separate alerts for buy/sell signals
Exit Warnings: Technical breakdown alerts for position management
Mobile Ready: Push notifications to TradingView mobile app
Market Applications
Perfect For:
Gold Futures (GC): 24-hour precious metals trading
NASDAQ Futures (NQ): High-volatility index scalping
Forex Markets: Currency pairs with continuous operation
Crypto Trading: 24/7 cryptocurrency momentum plays
Energy Futures: Oil, gas, and commodity swing trades
Optimal Timeframes:
1-5 Minutes: Ultra-fast scalping during high volatility
5-15 Minutes: Balanced approach for most markets
15-30 Minutes: Swing scalping for trend following
🧠 Smart Position Management
Tracks implied position direction
Prevents conflicting signals
Allows trend continuation entries
State-aware exit logic
⚡ Scalping Optimized
Fast-reacting indicators with shorter periods
Volume-based confirmation reduces false signals
Clean entry/exit visualization
Minimal lag for time-sensitive trades
Configuration Options
All parameters fully customizable:
EMA Lengths: Adjustable from 1-30 periods
RSI Period: 1-14 range for different market conditions
MACD Settings: Fast (1-15), Slow (1-30), Signal (1-10)
Volume Confirmation: 0.5-5.0x multiplier range
Visual Preferences: Colors, displays, and table options
Risk Management Features
Clear visual exit signals prevent emotion-based decisions
Volume confirmation reduces false breakouts
Multi-indicator confluence improves signal quality
Optional time filtering for session-specific strategies
Best Use Cases
Futures Scalping: NQ, ES, GC during active sessions
Forex Swing Trading: Major pairs during overlap periods
Crypto Momentum: Bitcoin, Ethereum trend following
24/7 Automated Systems: Algorithmic trading implementation
Multi-Market Scanning: Portfolio-wide signal monitoring

Market Regime Matrix [Alpha Extract]A sophisticated market regime classification system that combines multiple technical analysis components into an intelligent scoring framework to identify and track dominant market conditions. Utilizing advanced ADX-based trend detection, EMA directional analysis, volatility assessment, and crash protection protocols, the Market Regime Matrix delivers institutional-grade regime classification with BULL, BEAR, and CHOP states. The system features intelligent scoring with smoothing algorithms, duration filters for stability, and structure-based conviction adjustments to provide traders with clear, actionable market context.
🔶 Multi-Component Regime Engine Integrates five core analytical components: ADX trend strength detection, EMA-200 directional bias, ROC momentum analysis, Bollinger Band volatility measurement, and zig-zag structure verification. Each component contributes to a sophisticated scoring system that evaluates market conditions across multiple dimensions, ensuring comprehensive regime assessment with institutional precision.
// Gate Keeper: ADX determines market type
is_trending = adx_value > adx_trend_threshold
is_ranging = adx_value <= adx_trend_threshold
is_maximum_chop = adx_value <= adx_chop_threshold
// BULL CONDITIONS with Structure Veto
if price_above_ema and di_bullish
if use_structure_filter and isBullStructure
raw_bullScore := 5.0 // MAXIMUM CONVICTION: Strong signals + Bull structure
else if use_structure_filter and not isBullStructure
raw_bullScore := 3.0 // REDUCED: Strong signals but broken structure
🔶 Intelligent Scoring System Employs a dynamic 0-5 scale scoring mechanism for each regime type (BULL/BEAR/CHOP) with adaptive conviction levels. The system automatically adjusts scores based on signal alignment, market structure confirmation, and volatility conditions. Features decision margin requirements to prevent false regime changes and includes maximum conviction thresholds for high-probability setups.
🔶 Advanced Structure Filter Implements zig-zag based market structure analysis using configurable deviation thresholds to identify significant pivot points. The system tracks Higher Highs/Higher Lows (HH/HL) for bullish structure and Lower Lows/Lower Highs (LL/LH) for bearish structure, applying structure veto logic that reduces conviction when price action contradicts the underlying trend framework.
// Define Market Structure (Bull = HH/HL, Bear = LL/LH)
isBullStructure = not na(last_significant_high) and not na(prev_significant_high) and
not na(last_significant_low) and not na(prev_significant_low) and
last_significant_high > prev_significant_high and last_significant_low > prev_significant_low
isBearStructure = not na(last_significant_high) and not na(prev_significant_high) and
not na(last_significant_low) and not na(prev_significant_low) and
last_significant_low < prev_significant_low and last_significant_high < prev_significant_high
🔶 Superior Engine Components Features dual-layer regime stabilization through score smoothing and duration filtering. The score smoothing component reduces noise by averaging raw scores over configurable periods, while the duration filter requires minimum regime persistence before confirming changes. This eliminates whipsaws and ensures regime transitions represent genuine market shifts rather than temporary fluctuations.
🔶 Crash Detection & Active Penalties Incorporates sophisticated crash detection using Rate of Change (ROC) analysis with severity classification. When crash conditions are detected, the system applies active penalties (-5.0) to BULL and CHOP scores while boosting BEAR conviction based on crash severity. This ensures immediate regime response to major market dislocations and drawdown events.
// === CRASH OVERRIDE (Active Penalties) ===
is_crash = roc_value < crash_threshold
if is_crash
// Calculate crash severity
crash_severity = math.abs(roc_value / crash_threshold)
crash_bonus = 4.0 + (crash_severity - 1.0) * 2.0
// ACTIVE PENALTIES: Force bear dominance
raw_bearScore := math.max(raw_bearScore, crash_bonus)
raw_bullScore := -5.0 // ACTIVE PENALTY
raw_chopScore := -5.0 // ACTIVE PENALTY
❓How It Works
🔶 ADX-Based Market Classification The Market Regime Matrix uses ADX (Average Directional Index) as the primary gatekeeper to distinguish between trending and ranging market conditions. When ADX exceeds the trend threshold, the system activates BULL/BEAR regime logic using DI+/DI- crossovers and EMA positioning. When ADX falls below the ranging threshold, CHOP regime logic takes precedence, with maximum conviction assigned during ultra-low ADX periods.
🔶 Dynamic Conviction Scaling Each regime receives conviction ratings from UNCERTAIN to MAXIMUM based on signal alignment and score magnitude. MAXIMUM conviction (5.0 score) requires perfect signal alignment plus favorable market structure. The system progressively reduces conviction when signals conflict or structure breaks, ensuring traders understand the reliability of each regime classification.
🔶 Regime Transition Management Implements decision margin requirements where new regimes must exceed existing regimes by configurable thresholds before transitions occur. Combined with duration filtering, this prevents premature regime changes and maintains stability during consolidation periods. The system tracks both raw regime signals and final regime output for complete transparency.
🔶 Visual Regime Mapping Provides comprehensive visual feedback through colored candle overlays, background regime highlighting, and real-time information tables. The system displays regime history, conviction levels, structure status, and key metrics in an organized dashboard format. Regime changes trigger immediate visual alerts with detailed transition information.
🔶 Performance Optimization Features efficient array management for zig-zag calculations, smart variable updating to prevent recomputation, and configurable debug modes for strategy development. The system maintains optimal performance across all timeframes while providing institutional-grade analytical depth.
Why Choose Market Regime Matrix ?
The Market Regime Matrix represents the evolution of market regime analysis, combining traditional technical indicators with modern algorithmic decision-making frameworks. By integrating multiple analytical dimensions with intelligent scoring, structure verification, and crash protection, it provides traders with institutional-quality market context that adapts to changing conditions. The sophisticated filtering system eliminates noise while preserving responsiveness, making it an essential tool for traders seeking to align their strategies with dominant market regimes and avoid adverse market environments.

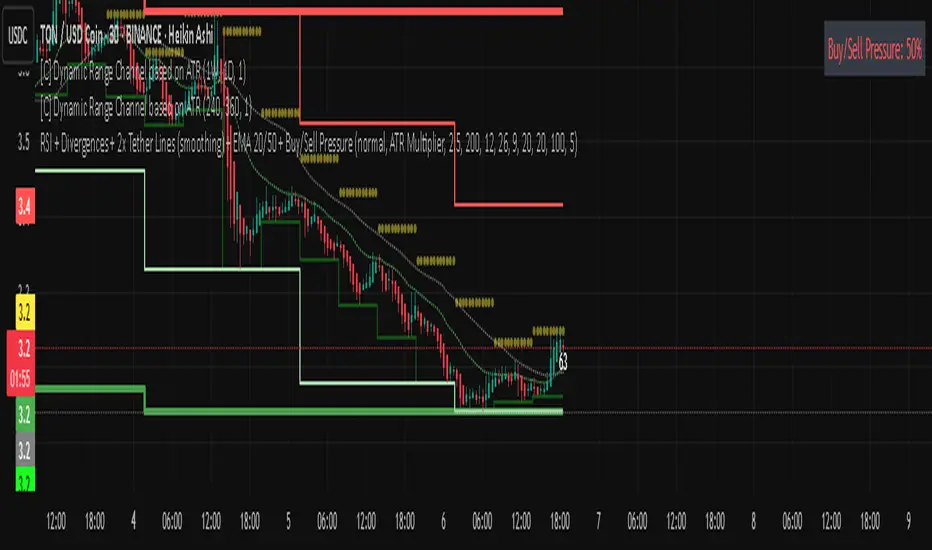
Rsi bar, divergences, tether line, ema 20,50 -Ema 20,50
-Tether Line dominance
-Buy/sell pressure
-Rsi last candle
-byu sell signal
-rsi divergence
-macd divergence
-Coloured candles 25,30 rsi and 70 rsi
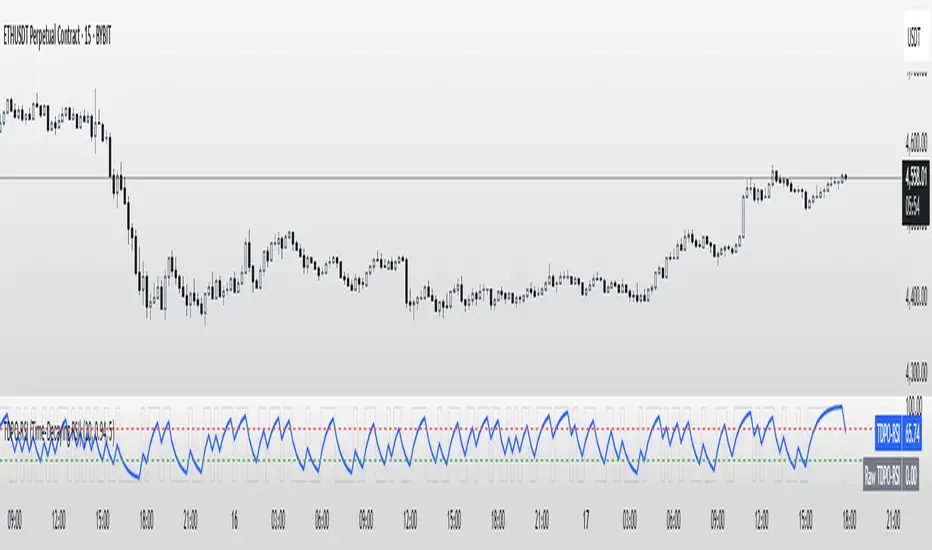
TDPO-RSI (Time-Decaying Percentile RSI)TDPO-RSI (Time-Decaying Percentile RSI)
TDPO-RSI is a modern, statistically-enhanced momentum indicator that improves on traditional RSI by using percentile-based analysis with exponential time decay. Instead of averaging gains and losses equally, this indicator ranks them by size and weights recent data more heavily—resulting in a more responsive and noise-resistant signal.
How it works:
Calculates percentile rank of gains and losses over a lookback window
Applies a decay factor (lambda) to give more weight to recent price action
Outputs a percentile-based RSI value between 0 and 100
Optional smoothing via EMA for clearer crossover signals
Key Uses:
Identify overbought/oversold zones (default: 70/30)
Use raw vs. smoothed RSI crossovers for entries
Detect momentum shifts earlier than traditional RSI
Suitable for scalping, trend continuation, and reversal setups
Inputs:
Lookback Length: Number of bars used for percentile calculation
Decay Factor (lambda): How quickly older data fades in influence (0.80–0.99)
Smoothing EMA: Smooths the final output to reduce noise
Tip: Combine with price structure and volume for best results. Higher timeframes can be used for trend context, while lower timeframes help with precise entries.
This tool is ideal for traders who want adaptive momentum analysis rooted in statistical behavior.

RSI-CCI Momentum ScreenerRSI-CCI Momentum Screener;
How to Use:
Apply this script to 1H or 4H timeframe
Works well for NSE stocks, crypto, or forex
Look for a green label “BUY” that shows when the screener conditions are met

BERLIN-MAX 1V.5BERLIN-MAX 1V.5 is a comprehensive trading indicator designed for TradingView that combines multiple advanced strategies and tools. It integrates EMA crossover signals, UT Bot logic with ATR-based trailing stops, customizable stop-loss and target multipliers per timeframe, Hull Moving Averages with color-coded trends, linear regression channels for support and resistance, and a multi-timeframe RSI and volume signal table. This script aims to provide clear entry and exit signals for scalping and swing trading, enhancing decision-making across different market conditions.

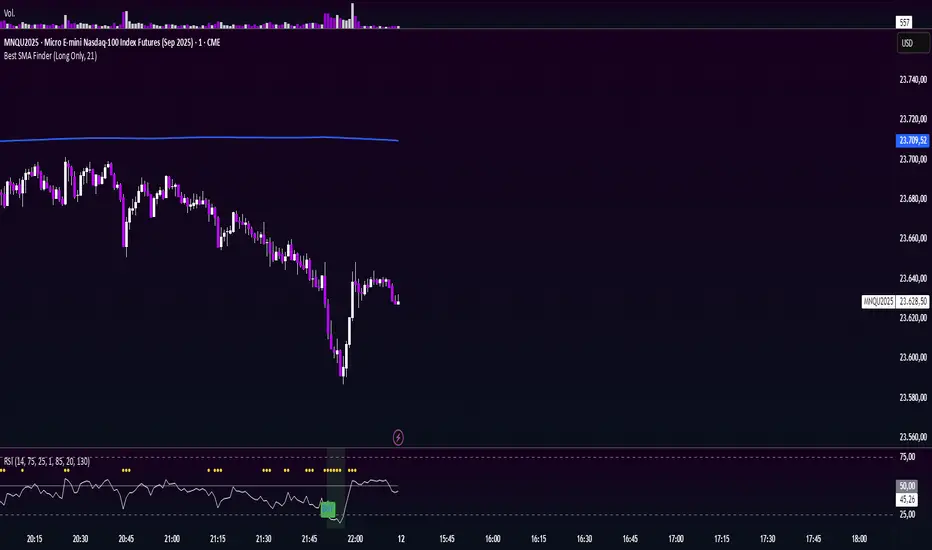
VIX Filter/RSI/EMA Bias/Cum-TICK w/ Exhaustion Zone DashboardThis all-in-one dashboard gives intraday traders a real-time visual read of market conditions, combining volatility regime, trend bias, momentum exhaustion, and internal strength — all in a fully customizable overlay that won’t clutter your chart.
📉 VIX Market Regime Detector
Identifies "Weak", "Normal", "Volatile", or "Danger" market states based on customizable VIX ranges and symbol (e.g., VXN or VIX).
📊 RSI Momentum Readout
Displays real-time RSI from any selected timeframe or symbol, with adjustable length, OB/OS thresholds, and color-coded exhaustion alerts.
📈 EMA Trend Bias Scanner
Compares fast and slow EMAs to define bullish or bearish bias, using your preferred timeframe, symbol, and EMA lengths — ideal for multi-timeframe setups.
🧠 Cumulative TICK Pressure & Exhaustion Engine
Analyzes internal market strength using cumulative TICK data to classify conditions as:
-Strong / Mild Bullish or Bearish Pressure
-Choppy / No Edge
-⚠️ Exhaustion Zones — when raw TICK values hit extreme highs/lows, a separate highlight box appears in the dashboard, warning of potential turning points
All logic is customizable, including TICK symbol, timeframes, thresholds, and lookback periods.
Scalpers and day traders who want fast, visual insight into market internals, exhaustion, and trend bias.

ZigZag Based RSIDescription
ZigZag Trend RSI (ZZ-RSI) is an advanced momentum indicator that combines ZigZag-based trend detection with a trend-adjusted RSI to deliver smarter overbought and oversold signals. Unlike traditional RSI that reacts purely to price movement, this indicator adapts its sensitivity based on the prevailing trend structure identified via the ZigZag pattern.
By dynamically adjusting RSI thresholds according to market direction, ZZ-RSI helps filter out false signals and aligns RSI readings with broader trend context—crucial for trend-following strategies, counter-trend entries, and volatility-based timing.
Core Components
ZigZag Pattern Recognition:
Identifies significant swing highs and lows based on price deviation (%) and pivot sensitivity (length). The most recent pivot determines the prevailing trend direction:
🟢 Bullish: last swing is a higher high
🔴 Bearish: last swing is a lower low
⚪ Neutral: no recent significant movement
Trend-Weighted RSI:
Modifies traditional RSI input by emphasizing price changes in the direction of the trend:
In bull trends, upside moves are magnified.
In bear trends, downside moves are emphasized.
Dynamic RSI Zones:
Overbought and Oversold thresholds adapt to the trend:
In uptrends: higher OB and slightly raised OS → tolerate stronger rallies
In downtrends: lower OS and slightly reduced OB → accommodate stronger sell-offs
In neutral: default OB/OS values apply
How to Use
✅ Entries (Reversal or Mean Reversion Traders):
Look for oversold signals (green triangle) in downtrends or neutrals to catch potential reversals.
Look for overbought signals (red triangle) in uptrends or neutrals to fade momentum.
Confirm with price action or volume for higher conviction.
📈 Trend Continuation (Momentum or Trend-Followers):
Use the trend direction label (Bullish / Bearish / Neutral) to align your trades with the broader move.
Combine with moving averages or price structure for entry timing.
Avoid counter-trend signals unless confirmed by divergence or exhaustion.
🧠 Signal Interpretation Table (top right of chart):
Trend: Indicates the current market direction.
RSI: Real-time trend-adjusted RSI value.
Signal: OB/OS/Neutral classification.
Customization Options
ZigZag Length / Deviation %:
Adjust pivot sensitivity and filter out minor noise.
RSI Length:
Controls how fast RSI responds to trend-adjusted price.
Color Settings:
Personalize visual cues for trend direction and OB/OS backgrounds.
Alerts Included
📢 Overbought/oversold conditions
🔄 Trend reversals (bullish or bearish shift)
These alerts are ideal for automated strategies, mobile notifications, or algorithmic workflows.
Ideal For
Traders seeking smarter RSI signals filtered by market structure
Trend-followers and swing traders looking for reliable reversals
Those frustrated with false OB/OS signals in volatile or trending markets
Best Practices
Use in confluence with price structure, trendlines, or S/R levels.
For intraday: consider lowering ZigZag Length and RSI Length.
For higher timeframes: use higher deviation % and smoother RSI to reduce noise.

RSI and MACD Divergence IndicatorThe RSI and MACD Divergence Indicator is a custom Pine Script v6 indicator designed for TradingView that identifies and visualizes divergences between price movements and two technical indicators: the Relative Strength Index (RSI) and the Moving Average Convergence Divergence (MACD). Here's a brief explanation of its functionality:
Divergence Detection: The indicator detects both regular and hidden divergences for RSI, MACD (MACD Line), and Histogram. Regular bullish divergences occur when price makes a lower low but the indicator makes a higher low (suggesting a potential reversal upward), while regular bearish divergences occur when price makes a higher high but the indicator makes a lower high (suggesting a potential reversal downward). Hidden divergences indicate continuation patterns (e.g., higher low in price with a lower low in the indicator for bullish continuation).
Customizable Inputs:
Pivot Bars: Sets the number of bars used to confirm pivot highs and lows (default: 5).
RSI and MACD Parameters: Allows adjustment of RSI length (default: 14) and MACD settings (fast: 12, slow: 26, signal: 9).
Toggle Options: Enables/disables detection of regular and hidden divergences for RSI, MACD, and Histogram individually.
Confirmation: Option to wait for pivot confirmation (default: true), delaying divergence display until the pivot is fully formed.
Show Only Last Divergence: Toggles between showing only the most recent divergence (default: true) or all detected divergences (false), with previous lines and labels cleared when true.
Minimum Divergences: Sets the minimum number of divergence types required at a pivot to display (default: 1, max: 6).
Maximum Pivot Points: Limits the number of historical pivot points to check (default: 10).
Maximum Bars to Check: Restricts analysis to the last specified number of bars (default: 500).
Visualization:
Draws lines connecting the price pivot points where divergences are detected, with customizable colors, widths, and styles (solid, dashed, dotted) for RSI and MACD.
Displays a single label per pivot with vertically stacked text listing all detected divergence types (e.g., "RSI Bull Div MACD Bull Div"), using semi-transparent backgrounds (green for bullish, red for bearish) and white text.

Advanced Trend Panel v3.1This is a comprehensive dashboard indicator designed to give traders a multi-faceted view of the market at a single glance. It combines key indicators across multiple timeframes, calculates trend duration, and presents all information in a clean, color-coded table. This tool is perfect for confirming trade ideas, identifying trend alignment, and understanding the underlying market dynamics.
#### Key Features:
* **All-in-One Dashboard:** A convenient on-chart table summarizes the state of multiple key indicators, saving you screen space and time.
* **Multi-Timeframe (MTF) Forecast:** Analyzes the long-term trend on a higher timeframe (e.g., Daily) to provide context for the current chart's trend.
* **Trend Analysis:** Uses dual sets of EMAs (long-term and short-term) to define the primary and immediate trend directions.
* **Trend Duration:** A unique feature that calculates how long the current short-term and long-term trends have been active, helping you gauge trend maturity.
* **Core Indicators Included:**
* **ADX:** Measures trend strength to differentiate between strong trends and weak or sideways markets.
* **RSI:** Identifies overbought and oversold conditions.
* **Point of Control (POC):** Shows the price level with the highest traded volume over a lookback period, acting as a key level of support/resistance.
* **Volume:** Compares current volume to its moving average to spot unusual activity.
* **Customizable Alerts:** Set up alerts for trend changes (long-term or short-term), RSI crossing into overbought/oversold zones, or shifts in ADX trend strength.
#### How to Use:
1. Apply the indicator to your chart.
2. In the settings, configure the timeframes, indicator lengths, and display options to match your trading style.
3. Use the table to quickly assess if the long-term trend, short-term trend, and momentum are aligned.
4. Enable alerts to be notified of key changes in market conditions without having to watch the chart constantly.
**Disclaimer:** This script is for educational purposes only and should not be considered financial advice. All trading involves risk. Past performance is not indicative of future results. Please backtest and use this tool as part of a comprehensive trading plan with proper risk management.
Feedback is always welcome! If you find this indicator useful, please leave a like.

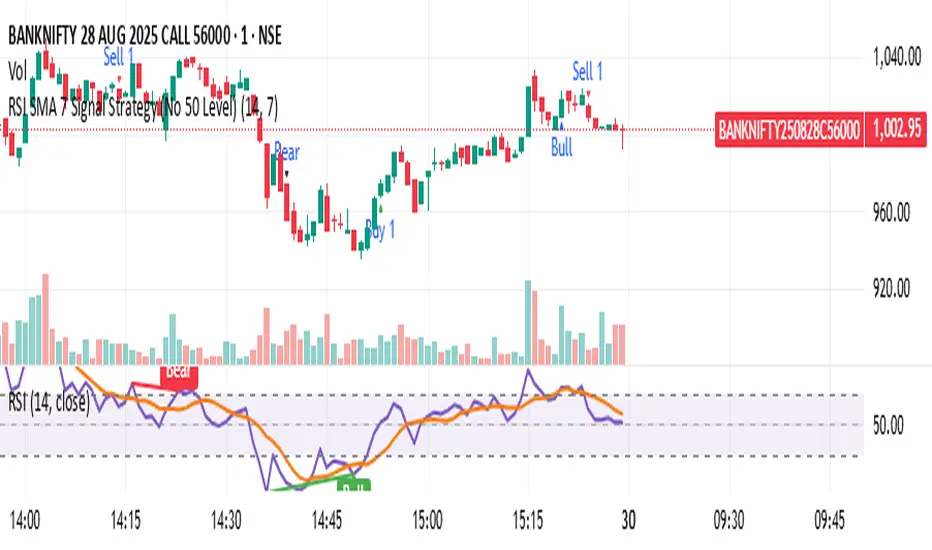
RSI SMA 7 Signal Strategy (No 50 Level)Script uses SMA 7 Perio and 14 Period RSI
If SMA crosses 40 RSI level from below consider it a buy zone or buy signal, if SMA crosses from below 60 RSI level, then super bullish, IF SMA crosses 60 RSI level from above its a profit taking time and Sell zone, if SMA crosses 40 level from above then super bearish sell signal.
RSI Zones - Directional Entry Strict RSI Zones – Directional Entry Tool (Modified RSI)
This is a simple modification of the standard RSI indicator. I’ve added two custom horizontal lines at the 60–65 and 35–40 zones to help spot momentum shifts and potential reversal points.
60–65 zone: When RSI returns here from above 65, it often signals weakening bullish momentum — useful for spotting short opportunities.
35–40 zone: When RSI returns here from below 35, it can indicate momentum loss on the downside — good for potential long setups.
This version helps traders filter out weak signals and avoid chasing extreme moves.
It works best when combined with price action, structure, or divergence.
Only 2 lines were added to the default RSI for better zone awareness. Everything else remains unchanged.

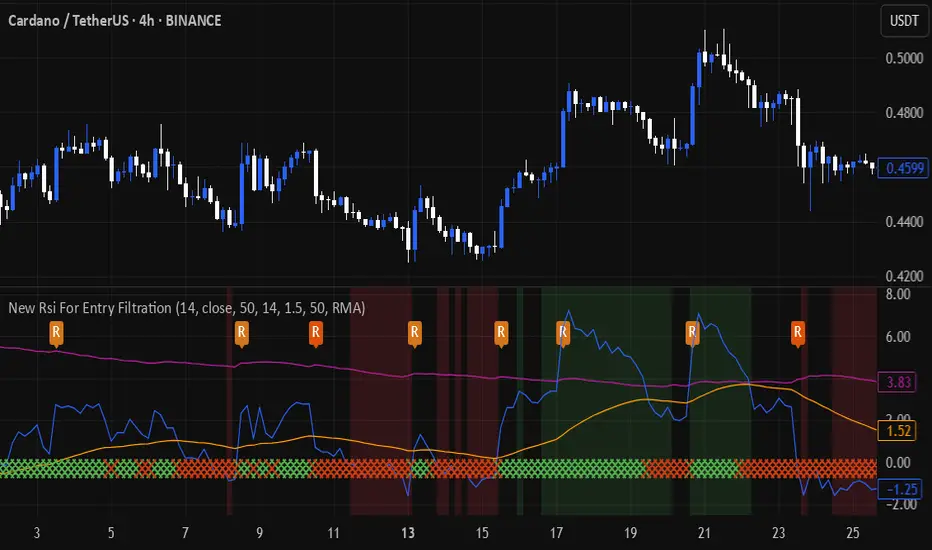
New Rsi For Entry FiltrationThis indicator, which is based on the RSI indicator, is written to prevent you from entering the wrong trade. Its operation is very simple. Enter a long trade when both the main area and the lower ribbon are green. Also, for a short trade, both the main area and the lower ribbon are red. The purple line also shows the stop loss level based on ATR. It is not advisable to enter the trade at the points indicated by R because the candlestick length is long.
RSI+BOLLINGER (LONG & SHORT)This indicator combines two of the most popular tools in technical analysis, the Relative Strength Index (RSI) and Bollinger Bands (BB), to generate both long (BUY) and short (SELL) trading signals.
Strategy:
Entries (Buy/Short): Entry signals are based on the RSI.
A BUY is suggested when the RSI crosses above an oversold level (default: 29), indicating a possible upward reversal.
A SHORT is suggested when the RSI crosses below an overbought level (default: 71), indicating a possible downward reversal.
Exits (Position Closure): Exit signals are based on Bollinger Bands.
A long position is closed when the price crosses below the upper Bollinger Band.
A short position is closed when the price crosses above the lower Bollinger Band.
Key Features:
Cascade Filter: Includes a smart filter that prevents opening new consecutive trades if the price hasn't moved significantly in favor of a new entry, optimizing signal quality.
Automation Alerts: Generates detailed alerts in JSON format for each event (buy, sell, close), designed for easy integration with trading bots and automated systems via webhooks.
Fully Configurable: All parameters of the RSI, Bollinger Bands, and strategy filters can be adjusted from the indicator’s settings menu.

RSI Shift Zone [ChartPrime]OVERVIEW
RSI Shift Zone is a sentiment-shift detection tool that bridges momentum and price action. It plots dynamic channel zones directly on the price chart whenever the RSI crosses above or below critical thresholds (default: 70 for overbought, 30 for oversold). These plotted zones reveal where market sentiment likely flipped, helping traders pinpoint powerful support/resistance clusters and breakout opportunities in real time.
⯁ HOW IT WORKS
When the RSI crosses either the upper or lower level:
A new Shift Zone channel is instantly formed.
The channel’s boundaries anchor to the high and low of the candle at the moment of crossing.
A mid-line (average of high and low) is plotted for easy visual reference.
The channel remains visible on the chart for at least a user-defined minimum number of bars (default: 15) to ensure only meaningful shifts are highlighted.
The channel is color-coded to reflect bullish or bearish sentiment, adapting dynamically based on whether the RSI breached the upper or lower level. Labels with actual RSI values can also be shown inside the zone for added context.
⯁ KEY TECHNICAL DETAILS
Uses a standard RSI calculation (default length: 14).
Detects crossovers above the upper level (trend strength) and crossunders below the lower level (oversold exhaustion).
Applies the channel visually on the main chart , rather than only in the indicator pane — giving traders a precise map of where sentiment shifts have historically triggered price reactions.
Auto-clears the zone when the minimum bar length is satisfied and a new shift is detected.
⯁ USAGE
Traders can use these RSI Shift Zones as powerful tactical levels:
Treat the channel’s high/low boundaries as dynamic breakout lines — watch for candles closing beyond them to confirm fresh trend continuation.
Use the midline as an equilibrium reference for pullbacks within the zone.
Visual RSI value labels offer quick checks on whether the zone formed due to extreme overbought or oversold conditions.
CONCLUSION
RSI Shift Zone transforms a simple RSI threshold crossing into a meaningful structural tool by projecting sentiment flips directly onto the price chart. This empowers traders to see where momentum-based turning points occur and leverage those levels for breakout plays, reversals, or high-confidence support/resistance zones — all in one glance.

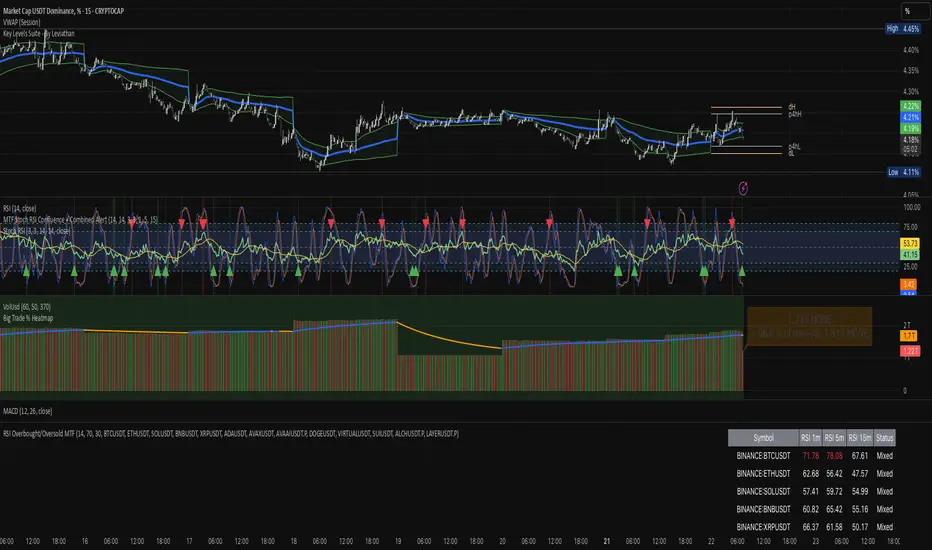
RSI Overbought/Oversold MTFRSI Overbought / Oversold MTF — Dashboard & Alerts
What it does
This script scans up to 13 symbols at once and shows their RSI readings on three lower‑time‑frames (1 min, 5 min, 15 min).
If all three RSIs for a symbol are simultaneously above the overbought threshold or below the oversold threshold, the script:
Prints the condition (“Overbought” / “Oversold”) in a color‑coded dashboard table.
Fires a one‑per‑bar alert so you never miss the move.
Key features
Feature Details
Multi‑symbol Default list includes BTC, ETH, SOL, BNB, XRP, ADA, AVAX, AVAAI, DOGE, VIRTUAL, SUI, ALCH, LAYER (all Binance pairs). Replace or reorder in the inputs.
Triple‑time‑frame check RSI is calculated on 1 m, 5 m, 15 m for each symbol.
Customizable thresholds Set your own RSI Period, Overbought and Oversold levels. Defaults: 14 / 70 / 30.
Color‑coded dashboard Top‑right table shows:
• Symbol name
• RSI 1 m / 5 m / 15 m (red = overbought, green = oversold, white = neutral)
• Overall Status column (“Overbought”, “Oversold”, “Mixed”).
Alerts built in Triggers once per bar whenever a symbol is overbought or oversold on all three time‑frames simultaneously.
Typical use cases
Scalp alignment — Enter when all short TFs agree on overbought/oversold extremes.
Mean‑reversion spotting — Identify stretched conditions across multiple coins without switching charts.
Quick sentiment scan — Glance at the dashboard to see where momentum is heating up or cooling down.
How to use
Add to chart (overlay = false; it sits in its own pane).
Adjust symbols & thresholds in the Settings panel.
Create alerts → choose “RSI Overbought/Oversold MTF” → “Any Alert() Function Call” to receive push, email, or webhook notifications.
Note: The script queries many symbols each bar; use on lower time‑frames only if your data limits allow.
For educational purposes only — not financial advice. Always test on paper before trading live.
EMA Curl Strength+EMA Curl Strength+
Description:
This indicator provides a statistically normalized view of EMA slope momentum using Z-score transformation. By evaluating the rate of change of an EMA and comparing it against its historical behavior, the script highlights momentum shifts in a dynamic, adaptive way.
⸻
How It Works:
• Calculates the slope (percentage change) of a chosen EMA.
• Normalizes the slope using Z-score over a custom lookback period.
• Smooths the resulting signal and computes two signal lines for comparison.
• Assigns dynamic colors based on user-defined Z-score thresholds for mild, moderate, and strong momentum in both directions.
⸻
Visual Features:
• Gradient fill between the Z Curl Line and Signal 1 to highlight slope acceleration.
• Histogram showing the difference between the Z Curl Line and its signal.
• Optional signal crossover shapes between configurable pairs (e.g., Z Curl vs. Signal).
• Background highlights when the Z Curl Line exceeds ±2, indicating strong trending behavior.
⸻
Customization:
• Adjustable EMA length, smoothing lengths, signal lengths, histogram smoothing, and Z-score lookback.
• Separate color controls for:
• Z-score strength bands (mild/moderate/strong up/down)
• Histogram bars
• Signal lines
• Background highlight zones
• Crossover shapes
⸻
Use Cases:
• Momentum Confirmation: Confirm strength when Z Curl exceeds ±2 with matching background highlights.
• Trend Entry Timing: Look for trades when Z Curl crosses above or below the 0-line.
• Scalping: Capture quick directional moves when momentum accelerates.
• Trend Following: Use strong Z Curl values to confirm trade direction and filter sideways action.
• Divergence Detection: Spot divergences between price and Z Curl movement to anticipate reversals.

RSI with 2-Pole FilterA momentum indicator that tells you if a stock is overbought or oversold.
RSI goes between 0 and 100.
70 = overbought (might fall)
<30 = oversold (might rise)
It often looks jagged or choppy on volatile days.
Think of this filter like a momentum smoother:
It still follows RSI closely,
But it doesn’t react to every little jiggle in price,
Which helps avoid false signals.
it keeps track of:
The current RSI,
The last 2 RSI values (inputs), and
The last 2 outputs (filtered RSIs).
It uses feedback to shape the output based on previous values, making it smoother than a simple moving average.
