Support Resistance base Volume RSIThe indicator displays support and resistance levels based on volume and the Relative Strength Index (RSI).
Variable and Input Assignment:
lookback: Determines the period for data lookback.
RsiVisible, RsilabelSize, OversoldForRsi, OverboughtForRsi: Various inputs to adjust RSI indicator parameters.
Indicator Calculation:
highestVol: Finds the highest volume within a certain period.
Rsi: Calculates the RSI value with a period of 14.
roc: Calculates the Rate of Change.
Support and Resistance Level Determination:
Uses a comparison between price change (roc) and RSI value to determine whether the price is rising or falling.
If the price is rising and the current volume is greater than the previous highest volume, a new resistance level is established.
If the price is falling and the current volume is greater than the previous highest volume, a new support level is established.
Support and Resistance Lines:
Creates lines indicating the latest support and resistance levels.
These lines are updated whenever there is a change in support or resistance levels.
RSI Labels:
Displays the RSI value above or below the price chart depending on whether the RSI is above or below the overbought or oversold levels.
If the RSI value is above the overbought level, the label is displayed above the price.
If the RSI value is below the oversold level, the label is displayed below the price.
Labels are removed if the corresponding conditions are not met.
Additional RSI Label:
Adds an additional label displaying the RSI value next to the price chart on the last bar.
The main purpose of this script is to assist traders in identifying support and resistance levels based on price movement, volume, and the RSI indicator. Thus, traders can use this information to make better trading decisions.
Chỉ số Sức mạnh Tương quan (RSI)

Uptrick: RSI MA Buying/Selling signalsIndicator Purpose:
This indicator, titled "Uptrick: RSI MA Buying/Selling signals" or "UpRSIMA," aims to provide buying and selling signals based on the Moving Average (MA) of the Relative Strength Index (RSI).
It plots the RSI MA line and highlights whether the RSI MA value is above or below 50, indicating potential bullish or bearish signals, respectively.
RSI Calculation:
The script calculates the RSI using a user-defined length parameter (default is 14) and a specified source (typically the closing price).
It then computes the MA of the RSI using the Recursive Moving Average (RMA) function applied to the RSI values.
Color Representation:
The color of the RSI MA line is determined based on whether it's above or below the neutral level of 50.
If the RSI MA is above 50, indicating potential bullish signals, the color is set to green; otherwise, it's set to red for potential bearish signals.
Plotting:
The RSI MA line is plotted on the chart with the specified color based on its value relative to 50.
Additionally, a horizontal line is drawn at y = 50 to visually represent the neutral level.
Histogram bars are also added to visually represent the difference between the RSI MA and the neutral level, with green bars indicating bullish signals and red bars indicating bearish signals.
User Interface:
The indicator is designed to be used as an overlay on price charts, allowing traders to easily visualize potential buying and selling signals based on RSI MA crossovers and levels relative to 50.
Overall, the "Uptrick: RSI MA Buying/Selling signals" indicator offers traders insights into potential trend reversals or continuations based on the moving average of the Relative Strength Index, aiding them in making informed trading decisions.

RSI and MACD Composite ScoreComponents of the Indicator
RSI Settings:
The RSI is set with a length parameter, which can be adjusted by the user but defaults to 14. This measures the speed and change of price movements.
MACD Settings:
The MACD is composed of two lines: the MACD line and the signal line, which are calculated from exponential moving averages (EMAs) of different lengths (fast and slow). The default settings are 9 for the fast length, 26 for the slow length, and 3 for the signal length.
The MACD histogram, which is the difference between the MACD line and the signal line, is also calculated.
Normalization and Combination
RSI Normalization : The RSI values are normalized around 0 by subtracting 50 from the RSI and then dividing by 50. This scaling adjusts the RSI to fluctuate around 0, where positive values indicate strength and negative values indicate weakness relative to the median RSI value of 50.
MACD Normalization : The MACD histogram is normalized by dividing it by the highest absolute value of the histogram over the slow length period. This adjustment scales the MACD histogram to fall between -1 and 1, making it comparable in magnitude to the normalized RSI.
Composite Score Calculation
The composite score is simply the sum of the normalized RSI and the normalized MACD histogram. This results in a combined score that reflects both momentum (from RSI) and trend (from MACD), providing a multifaceted view of market dynamics.
Visualization
The composite score is plotted as an oscillator, with a horizontal zero line that helps identify when the score shifts from positive to negative or vice versa.
The background color changes based on the trend: green if the composite score is above zero (bullish trend) and red if below zero (bearish trend).

RSI, STOCHASTIC RSI AND MFI COMBOCombining the Relative Strength Index (RSI), Stochastic RSI (StochRSI), and Money Flow Index (MFI) can provide traders with a comprehensive approach to analyze market momentum, overbought/oversold conditions, and money flow. Each indicator offers unique insights, and their combination can help confirm trading signals and filter out false signals. Let's delve into each indicator and then discuss how they can be used together:
Relative Strength Index (RSI) 14: DA BLUE LINE
The RSI is a momentum oscillator that measures the speed and change of price movements. It oscillates between 0 and 100 and is typically used to identify overbought (>70) and oversold (<30) conditions. A reading above 70 may indicate that an asset is overbought and could be due for a pullback, while a reading below 30 may suggest that an asset is oversold and could be due for a bounce.
Stochastic RSI (StochRSI) 14: DA RED LINE
The StochRSI is an oscillator that combines the features of both the Stochastic Oscillator and RSI. It measures the relative position of the RSI within its range over a specific period (e.g., 14 periods). Like the RSI, the StochRSI oscillates between 0 and 100 and is used to identify overbought and oversold conditions. Typically:
A StochRSI above 0.8 may suggest overbought conditions.
A StochRSI below 0.2 may indicate oversold conditions.
Money Flow Index (MFI) 14: DA PURPLE LINE
The MFI is a momentum oscillator that measures the inflow and outflow of money into an asset over a specific period (e.g., 14 periods). It oscillates between 0 and 100 and is used to identify overbought and oversold conditions based on both price and volume. Generally:
An MFI above 80 may indicate overbought conditions.
An MFI below 20 may suggest oversold conditions.
Combining RSI, StochRSI, and MFI:
When combining RSI, StochRSI, and MFI, traders can use the following approach to analyze the market:
Identify Overbought/Oversold Conditions:
Look for confluence between RSI, StochRSI, and MFI readings to identify overbought and oversold conditions.
For example, if RSI > 70, StochRSI > 0.8, and MFI > 80, it may suggest a strong overbought condition, potentially indicating a reversal or pullback.
Confirm Trend Strength:
Use the RSI, StochRSI, and MFI to confirm the strength of a trend.
A rising trend with RSI, StochRSI, and MFI above 50 may suggest strong bullish momentum, while a falling trend with readings below 50 may indicate strong bearish momentum.
Divergence Analysis:
Look for divergences between price and RSI, StochRSI, or MFI to identify potential trend reversals.
For example, if the price makes a higher high, but RSI, StochRSI, or MFI makes a lower high (bearish divergence), it may suggest weakening bullish momentum and potential downside.
Combining RSI, StochRSI, and MFI can offer traders a more holistic view of market momentum, overbought/oversold conditions, and money flow. Backtest it let me know your success.

Market Structure RSIDescription:
The Market Structure RSI is an innovative indicator that combines the power of the Relative Strength Index (RSI) with market structure analysis to provide a unique perspective on the market. This indicator helps traders identify potential trend reversals and trading opportunities by analyzing the underlying market structure and generating overbought and oversold signals.
Key Features:
RSI Calculation: The indicator calculates a custom RSI based on the market structure, taking into account the formation of higher highs and lower lows. This unique approach to RSI calculation provides a more accurate representation of the market's strength and weakness.
Overbought and Oversold Levels: Users can customize the overbought and oversold levels according to their preferences. When the Market Structure RSI crosses above the oversold level, it generates a bullish signal, suggesting a potential long entry. Conversely, when the RSI crosses below the overbought level, it generates a bearish signal, indicating a potential short entry.
Moving Average: The indicator includes an optional moving average of the Market Structure RSI, which can be used to smooth out the RSI line and provide additional confirmation of trend reversals. Users can choose between EMA, SMA, and WMA and adjust the length of the moving average.
Customizable Close Type: The indicator allows users to define whether the market structure is deemed broken based on the candle close or the candle high/low. This flexibility enables traders to adapt the indicator to their preferred trading style and market conditions.
Visual Enhancements: The Market Structure RSI features gradient fills between the RSI line and the overbought/oversold levels, providing a clear visual representation of the market's strength. Additionally, the indicator plots bullish and bearish signals as circles on the RSI line, making it easy to identify potential entry points.
How to Use:
Add the Market Structure RSI to your chart and customize the settings according to your preferences, such as the RSI length, overbought and oversold levels, and moving average type and length.
Monitor the Market Structure RSI for crossovers above the oversold level or below the overbought level. A bullish signal occurs when the RSI crosses above the oversold level, while a bearish signal occurs when the RSI crosses below the overbought level.
Use the signals generated by the Market Structure RSI in conjunction with other technical analysis tools and price action patterns to confirm potential trade entries. The indicator works well as a complementary tool to support your existing trading strategy.
Consider the overall trend and market context when interpreting the signals generated by the Market Structure RSI. The indicator is most effective in trending markets and may produce less reliable signals in choppy or ranging market conditions.
Utilize sound risk management principles, such as setting appropriate stop-loss and take-profit levels, when trading based on the Market Structure RSI signals.
The Market Structure RSI offers a fresh perspective on the classic RSI indicator by incorporating market structure analysis. By combining the power of RSI with the identification of higher highs and lower lows, this indicator provides traders with a valuable tool for identifying potential trend reversals and trading opportunities. Whether you are a seasoned trader or just starting out, the Market Structure RSI can be a valuable addition to your technical analysis toolkit.

RSI Multi Strategies With Overlay SignalsHello everyone,
In this indicator, you will find 6 different entry and exit signals based on the RSI :
Entry into overbought and oversold zones
Exit from overbought and oversold zones
Crossing the 50 level
RSI cross RSI MA below or above the 50 level
RSI cross RSI MA in the overbought or oversold zones
RSI Divergence
With the signals identified, you can create your own strategy . (If you have any suggestions, please mention them in the comments).
Beyond these signals, you can set SL (Stop Loss) and TP (Take Profit) levels to better manage your positions.
SL Methods:
Percentage: The stop loss is determined by the percentage you specify.
ATR : The stop level is determined based on the Average True Range (ATR).
TP Methods:
Percentage: The take profit is determined by the percentage you specify.
RR ( Risk Reward ): The take profit level is determined based on the distance from the stop level.
You can mix and match these options as you like.
What makes the indicator unique and effective is its ability to display the RSI in the bottom chart and the signals, SL (Stop Loss), and TP (Take Profit) levels in the overlay chart simultaneously. This feature allows you to manage your trading quickly and easily without the need for using two separate indicators.
Let's try out a few strategies together.
My entry signal: RSI Entered OS (Oversold) Zone
My exit signal: RSI Entered OB (Overbought) Zone
I'm not using a stoploss for this strategy ("Fortune favors the brave").
Let's keep ourselves safe by adding a stop loss.
I'm adding an ATR-based stop loss.
I think it's better now.
If you have any questions or suggestions about the indicator, you can contact me.
Cheers

RSI Confirm Trend with Williams (W%R)RSI Confirm Trend with Williams (W%R)
This is the "RSI Confirm Trend with Williams (W%R)" indicator
This is a modification of the "RSI Trends" indicator by zzzcrypto123.
What Is the Relative Strength Index (RSI)?
The relative strength index (RSI) is a momentum indicator used in technical analysis. RSI measures the speed and magnitude of a security's recent price changes to evaluate overvalued or undervalued conditions in the price of that security.
What is Williams %R?
Williams %R, also known as the Williams Percent Range, is a type of momentum indicator that moves between 0 and -100 and measures overbought and oversold levels. The Williams %R may be used to find entry and exit points in the market. The indicator is very similar to the Stochastic oscillator and is used in the same way. It was developed by Larry Williams and it compares a stock’s closing price to the high-low range over a specific period, typically 14 days or periods.
How Does "RSI Confirm Trend with Williams (W%R)" work?
This indicator combines the momentum of both RSI and Williams %R by adding upper and lower thresholds. When the thresholds are broken, this indicator changes color from gray to either green or red.
What Are The Thresholds?
The default RSI thresholds are 55 and 45. These values are configurable.
The default Williams %R thresholds are 80 and 20. These values are configurable and made positive so it can be plotted against the RSI line.
How To Use?
When the RSI exceeded the upper/lower thresholds, the RSI line color will change from gray to lighter green/red color.
When the Williams %R exceeded the upper/lower thresholds, the RSI color will change to darker green/red color signifying a strong momentum in that direction.
When the RSI color is gray, this means the RSI and Williams %R thresholds are not broken which can also signify as no trend or consolidation.
The Williams %R line is not displayed by default but can be enabled using the checkbox provided in the Style tab.
This "RSI Confirm Trend with Williams (W%R)" indicator can be combined with other technical indicators to verify the idea behind this theory.
-----------------
Disclaimer
The information contained in this indicator does not constitute any financial advice or a solicitation to buy or sell any securities of any type.
My scripts/indicators/ideas are for educational purposes only!

RSI AcceleratorThe Relative Strength Index (RSI) is like a fitness tracker for the underlying time series. It measures how overbought or oversold an asset is, which is kinda like saying how tired or energized it is.
When the RSI goes too high, it suggests the asset might be tired and due for a rest, so it could be a sign it's gonna drop. On the flip side, when the RSI goes too low, it's like the asset is pumped up and ready to go, so it might be a sign it's gonna bounce back up. Basically, it helps traders figure out if a stock is worn out or revved up, which can be handy for making decisions about buying or selling.
The RSI Accelerator takes the difference between a short-term RSI(5) and a longer-term RSI(14) to detect short-term movements. When the short-term RSI rises more than the long-term RSI, it typically refers to a short-term upside acceleration.
The conditions of the signals through the RSI Accelerator are as follows:
* A bullish signal is generated whenever the Accelerator surpasses -20 after having been below it.
* A bearish signal is generated whenever the Accelerator breaks 20 after having been above it.

Volume RSIRelative strength index based on volume data.
Indicate volume momentum, and help you define divergences on volume.
The goal is to have an idea and represent in another form volumes and kept eyes on volume momentum on a certain period.
RSI is an indicator about the strength, I keep the oversold/overbought thresholds. I think it still makes sense to interpret.
the calculations is simple, we use the average volume up (avg_vol_up) and average volume down (avg_vol_down) over the period.
then calculate the relatives strength : ( avg_vol_up / ( avg_vol_up + avg_vol_down ) ) * 100
The period is 14 by default. The period is used for calculating mean.
I also add MA it helps to have a global look on the indicator.
In my code I used the idea of @Padronhosnai in his code "positve/negative volume" to get volumes in the right form.
For pictures I also use his indicator it's the one above.

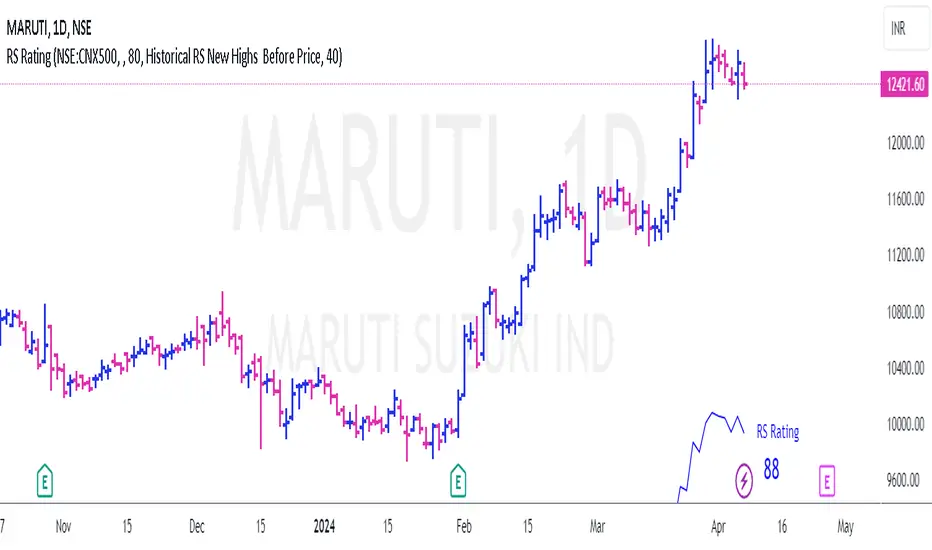
RS Rating for Indian MarketRS Rating for Trading View
This Trading View script calculates the Relative Price Strength (RS) Rating for a given stock. It's a measure of a stock's price performance over the last twelve months, compared to all stocks in a selected Index. The rating scale ranges from 1 (lowest) to 99 (highest).
Features
- Adaptation for Indian Market
- Option to choose the index to compare to (NSE:NIFTY, NSE:CNX500, NSE:NIFTYSMLCAP250, NSE:CNXSMALLCAP)
- Option to compare to a different index
- Option to hide the RS rating
- Option to plot RS new highs
- Option to adjust the offset of the line for display purposes
- Option to change the color of the RS Line & Rating
- Option to change the color of the dots for RS new highs
- Option to choose which new high to plot (RS New Highs, RS New Highs Before Price, Historical RS New Highs, Historical RS New Highs Before Price)
- Option to adjust the recent high look-back count
Please note that the script is designed to work best in the daily timeframe. Results may not be accurate in other timeframes.
This script uses three methods to calculate the RS Rating:
1. A method that calculates how the stock behaves vs SMA.
2. A classic performance method that calculates the performance of the stock's closing price vs the closing price 3 months back.
3. A method that measures how the stock performs against the comparative Symbol.
The final RS Rating is a combination of the results from these three methods. The script also includes some adjustments based on observations to improve the accuracy of the rating.
RSI Overbought/Oversold [Overlay Highlighter]Indicator to show when the RSI is in oversold(Below 30) or overbought (Above 70) conditions. The background color of the chart changes colors in the areas where the above conditions are met.
Price can often reverse in these areas. However, this depends on the strength of the trend and price may continue higher or lower in the direction of the overall trend.
Divergence has been added to aid the user in timing reversals. Divergences are plotted by circles above or below the candles. Divergence is confirmed so there is a delay of one candle before the signal is given on the previous candle. Again, everything depends on the strength of the trend so use proper risk management.
Once the RSI has entered into oversold/overbought conditions, it is recommended to wait for divergence before entering into the trade near areas of support or resistance. It is recommended to utilize this strategy on the H4 timeframe, however, this particular strategy works on all timeframes.
This indicator is a modified version of seoco's RSI Overbought/Oversold + Divergence Indicator . The user interface has been refined, is now overlayed on the chart, and my own divergence code has been inserted.

UT Bot Stochastic RSIUT Bot Stochastic RSI is a powerful trading tool designed to help traders identify potential buy and sell signals in the market. This indicator combines the Stochastic and RSI (Relative Strength Index) oscillators, two of the most popular and effective technical analysis tools, to provide a comprehensive view of market conditions.
The Stochastic oscillator is a momentum indicator that compares a security's closing price to its price range over a given time period. The RSI, on the other hand, is a momentum oscillator that measures the speed and change of price movements. By combining these two indicators, the UT Bot Stochastic RSI can help traders identify overbought and oversold conditions, as well as potential trend reversals.
The UT Bot Stochastic RSI also includes an ATR (Average True Range) trailing stop, which can be used to set stop-loss levels and manage risk. This feature is particularly useful in volatile markets, where price movements can be large and unpredictable.
In addition to its powerful technical analysis tools, the UT Bot Stochastic RSI also includes a backtesting feature, allowing traders to test their strategies on historical data. This can help traders identify the most effective settings for the indicator and improve their trading performance.
Overall, the UT Bot Stochastic RSI is a versatile and effective tool for traders of all levels, providing valuable insights into market conditions and helping to improve trading decisions

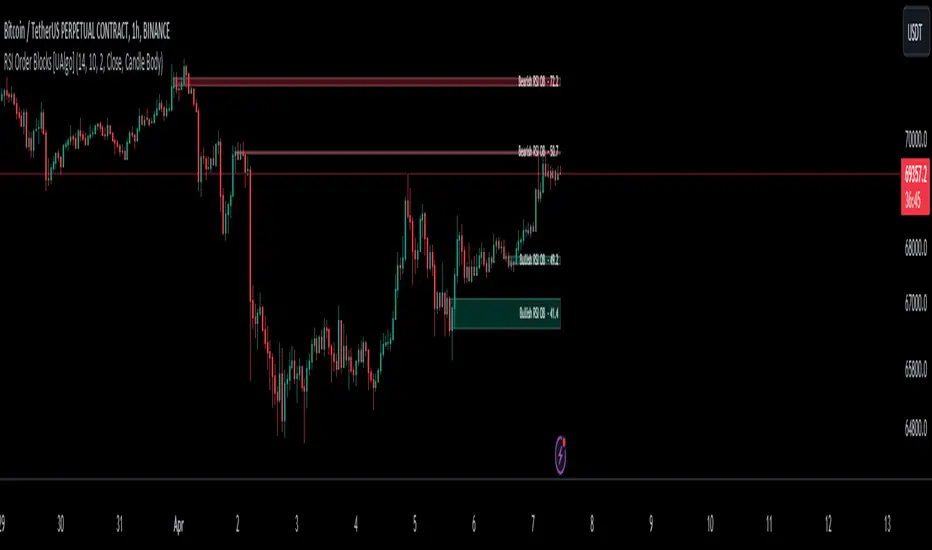
RSI Order Blocks [UAlgo]The "RSI Order Blocks " identifies and visualizes potential order blocks based on the Relative Strength Index (RSI) indicator. These zones may indicating potential support or resistance levels.
🔶 Key Features :
RSI-based Order Block Identification: The script utilizes the RSI indicator to identify potential order blocks. It detects pivot highs and lows in the RSI, which are indicative of potential reversal points, and marks these areas as potential order blocks.
Order Block Visualization: Identified order blocks are visually represented on the chart, making it easy for traders to recognize and interpret these significant price zones. Both bullish and bearish order blocks are differentiated by color, enhancing clarity and ease of analysis. Additionally, within each order block, the RSI value of that block is also shown.
RSI Overbought/Oversold Filter: Optionally, users can apply a filter based on RSI levels to refine the detection of order blocks. This filter prevents the creation of order blocks when the RSI is within specified overbought or oversold conditions (default between 30 and 70), helping traders focus on areas of potentially significant price action.
An Example with the OB/OS Filter Feature Turned Off:
An Example with the OB/OS Filter Feature Turned On:
Mitigation of Broken Order Blocks: Provides flexibility in selecting the mitigation method (based on close or wick) for determining order block breaches.
Customizable Parameters: The script offers a range of customizable parameters to tailor the detection and visualization of order blocks to suit individual trading preferences. Users can adjust parameters such as RSI Length, Order Block Detection Sensitivity, Mitigation Method, and order block style to fine-tune the analysis according to their trading strategy.
🔶 Disclaimer :
Not Financial Advice: This indicator is intended for educational and informational purposes only. It does not constitute financial advice or recommendations to buy, sell, or hold any financial instruments.
Use at Own Risk: Trading involves substantial risk of loss and is not suitable for all investors. Users of this indicator should exercise caution and conduct their own research and analysis before making any trading decisions.
Performance Not Guaranteed: Past performance is not indicative of future results. While the indicator aims to assist traders in analyzing market trends, there is no guarantee of accuracy or success in trading operations.
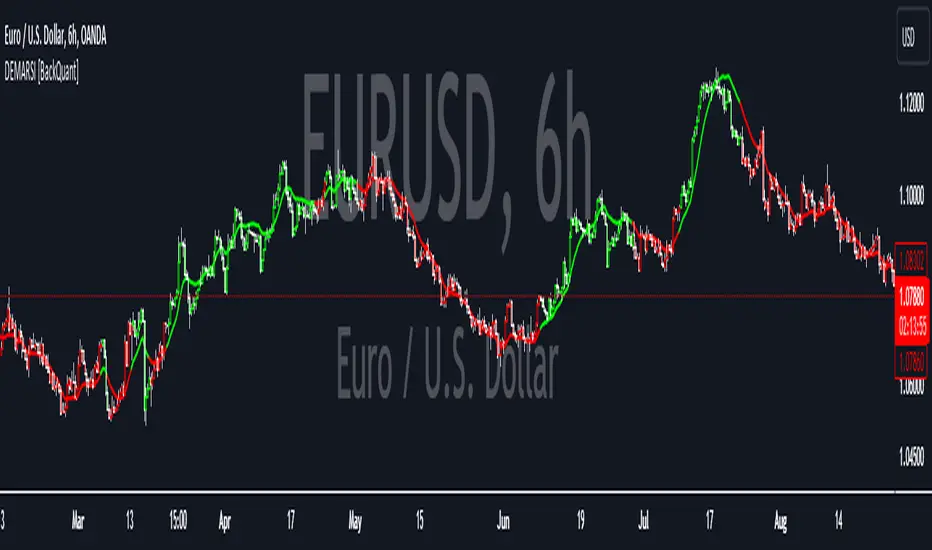
DEMA RSI Overlay [BackQuant]DEMA RSI Overlay
PLEASE Read the following, knowing what an indicator does at its core before adding it into a system is pivotal. The core concepts can allow you to include it in a logical and sound manner.
Anyways,
BackQuant's new trading indicator that blends the Double Exponential Moving Average (DEMA) with the Relative Strength Index (RSI) to create a unique overlay on the trading chart. This combination is not arbitrary; both the DEMA and RSI are revered for their distinct advantages in trading strategy development. Let's delve into the core components of this script, the rationale behind choosing DEMA and RSI, the logic of long and short signals, and its practical trading applications.
Understanding DEMA
DEMA is an enhanced version of the conventional exponential moving average that aims to reduce the lag inherent in traditional averages. It does this by applying more weight to recent prices. The reduction in lag makes DEMA an excellent tool for tracking price trends more closely. In the context of this script, DEMA serves as the foundation for the RSI calculation, offering a smoother and more responsive signal line that can provide clearer trend indications.
Why DEMA?
DEMA is chosen for its responsiveness to price changes. This characteristic is particularly beneficial in fast-moving markets where entering and exiting positions quickly is crucial. By using DEMA as the price source, the script ensures that the signals generated are timely and reflective of the current market conditions, reducing the risk of entering or exiting a trade based on outdated information.
Integrating RSI
The RSI, a momentum oscillator, measures the speed and change of price movements. It oscillates between zero and 100 and is typically used to identify overbought or oversold conditions. In this script, the RSI is calculated based on DEMA, which means it inherits the responsiveness of DEMA, allowing traders to spot potential reversals or continuation signals sooner.
Why RSI?
Incorporating RSI offers a measure of price momentum and market conditions relative to past performance. By setting thresholds for long (buy) and short (sell) signals, the script uses RSI to identify potential turning points in the market, providing traders with strategic entry and exit points.
Calculating Long and Short Signals
Long Signals : These are generated when the RSI of the DEMA crosses above the longThreshold (set at 70 by default) and the closing price is not above the upper volatility band. This suggests that the asset is gaining upward momentum while not being excessively overbought, presenting a potentially favorable buying opportunity.
Short Signals : Generated when the RSI of the DEMA falls below the shortThreshold (set at 55 by default). This indicates that the asset may be losing momentum or entering a downtrend, signaling a possible selling or shorting opportunity.
Logical Soundness
The logic of combining DEMA with RSI for generating trade signals is sound for several reasons:
Timeliness : The use of DEMA ensures that the price source for RSI calculation is up-to-date, making the momentum signals more relevant.
Balance : By setting distinct thresholds for long and short signals, the script balances sensitivity and specificity, aiming to minimize false signals while capturing genuine market movements.
Adaptability : The inclusion of user inputs for periods and thresholds allows traders to customize the indicator to fit various trading styles and timeframes.
Trading Use-Cases
This DEMA RSI Overlay indicator is versatile and can be applied across different markets and timeframes. Its primary use-cases include:
Trend Following: Traders can use it to identify the start of a new trend or the continuation of an existing trend.
Swing Trading: The indicator's sensitivity to price changes makes it ideal for swing traders looking to capitalize on short to medium-term price movements.
Risk Management: By providing clear long and short signals, it helps traders manage their positions more effectively, potentially reducing the risk of significant losses.
Final Note
We have also decided to add in the option of standard deviation bands, calculated on the DEMA, this can be used as a point of confluence rendering trading ranges. Expanding when volatility is high and compressing when it is low.
For example:
This provides the user with a 1, 2, 3 standard deviation band of the DEMA.
Thus following all of the key points here are some sample backtests on the 1D Chart
Disclaimer: Backtests are based off past results, and are not indicative of the future.
INDEX:BTCUSD
INDEX:ETHUSD
BINANCE:SOLUSD
Multi-Timeframe Momentum Indicator [Ox_kali]The Multi-Timeframe Momentum Indicator is a trend analysis tool designed to examine market momentum across various timeframes on a single chart. Utilizing the Relative Strength Index (RSI) to assess the market’s strength and direction, this indicator offers a multidimensional perspective on current trends, enriching technical analysis with a deeper understanding of price movements. Other oscillators, such as the MACD and StochRSI, will be integrated in future updates.
Regarding the operation with the RSI: when its value is below 50 for a given period, the trend is considered bearish. Conversely, a value above 50 indicates a bullish trend. The indicator goes beyond the isolated analysis of each period by calculating an average of the displayed trends, based on user preferences. This average, ranging from “Strong Down” to “Strong Up,” reflects the percentage of periods indicating a bullish or bearish trend, thus providing a precise overview of the overall market condition.
Key Features:
Multi-Timeframe Analysis : Allows RSI analysis across multiple timeframes, offering an overview of market dynamics.
Advanced Customization : Includes options to adjust the RSI period, the RSI trend threshold, and more.
Color and Transparency Options : Offers color styles for bullish and bearish trends, as well as adjustable transparency levels for personalized visualization.
Average Trend Display : Calculates and displays the average trend based on activated timeframes, providing a quick summary of the current market state.
Flexible Table Positioning : Allows users to choose the indicator’s display location on the chart for seamless integration.
List of Parameters:
RSI Period : Defines the RSI period for calculation.
RSI Up/Down Threshold: Threshold for determining bullish or bearish trends of the RSI.
Table Position: Location of the indicator’s display on the chart.
Color Style : Selection of the color style for the indicator.
Strong Down/Up Color (User) : Customization of colors for strong market movements.
Table TF Transparency : Adjustment of the transparency level for the timeframe table.
Show X Minute/Hour/Day/Week Trend : Activation of the RSI display for specific timeframes.
Show AVG : Option to display or not the calculated average trend.
the Multi-Timeframe Momentum Indicator , stands as a comprehensive tool for market trend analysis across various timeframes, leveraging the RSI for in-depth market insights. With the promise of future updates including the integration of additional oscillators like the MACD and StochRSI, this indicator is set to offer even more robust analysis capabilities.
Please note that the MTF-Momentum is not a guarantee of future market performance and should be used in conjunction with proper risk management. Always ensure that you have a thorough understanding of the indicator’s methodology and its limitations before making any investment decisions. Additionally, past performance is not indicative of future results.

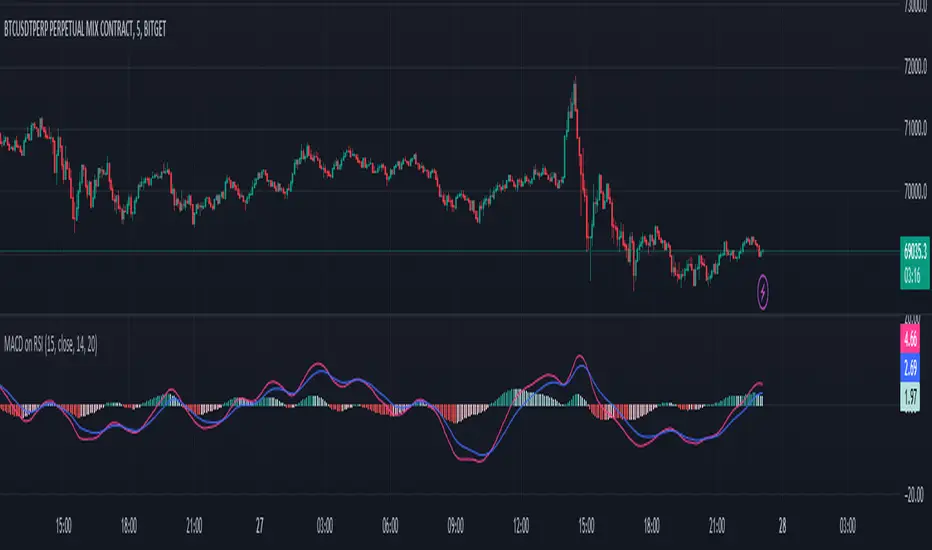
MACD on RSIThe MACD on RSI indicator combines elements of the Moving Average Convergence Divergence (MACD) and the Relative Strength Index (RSI). It calculates the RSI on a specified source with a customizable length, then applies two exponential moving averages (EMAs) to the RSI values. The difference between these EMAs forms the MACD line, visually representing the momentum of the RSI.
Heikin Ashi RSI + OTT [Erebor]Relative Strength Index (RSI)
The Relative Strength Index (RSI) is a popular momentum oscillator used in technical analysis to measure the speed and change of price movements. Developed by J. Welles Wilder, the RSI is calculated using the average gains and losses over a specified period, typically 14 days. Here's how it works:
Description and Calculation:
1. Average Gain and Average Loss Calculation:
- Calculate the average gain and average loss over the chosen period (e.g., 14 days).
- The average gain is the sum of gains divided by the period, and the average loss is the sum of losses divided by the period.
2. Relative Strength (RS) Calculation:
- The relative strength is the ratio of average gain to average loss.
The RSI oscillates between 0 and 100. Traditionally, an RSI above 70 indicates overbought conditions, suggesting a potential sell signal, while an RSI below 30 suggests oversold conditions, indicating a potential buy signal.
Pros of RSI:
- Identifying Overbought and Oversold Conditions: RSI helps traders identify potential reversal points in the market due to overbought or oversold conditions.
- Confirmation Tool: RSI can be used in conjunction with other technical indicators or chart patterns to confirm signals, enhancing the reliability of trading decisions.
- Versatility: RSI can be applied to various timeframes, from intraday to long-term charts, making it adaptable to different trading styles.
Cons of RSI:
- Whipsaws: In ranging markets, RSI can generate false signals, leading to whipsaws (rapid price movements followed by a reversal).
- Not Always Accurate: RSI may give false signals, especially in strongly trending markets where overbought or oversold conditions persist for extended periods.
- Subjectivity: Interpretation of RSI levels (e.g., 70 for overbought, 30 for oversold) is somewhat subjective and can vary depending on market conditions and individual preferences.
Checking RSIs in Different Periods:
Traders often use multiple timeframes to analyze RSI for a more comprehensive view:
- Fast RSI (e.g., 8-period): Provides more sensitive signals, suitable for short-term trading and quick decision-making.
- Slow RSI (e.g., 32-period): Offers a smoother representation of price movements, useful for identifying longer-term trends and reducing noise.
By comparing RSI readings across different periods, traders can gain insights into the momentum and strength of price movements over various timeframes, helping them make more informed trading decisions. Additionally, divergence between fast and slow RSI readings may signal potential trend reversals or continuation patterns.
Heikin Ashi Candles
Let's consider a modification to the traditional “Heikin Ashi Candles” where we introduce a new parameter: the period of calculation. The traditional HA candles are derived from the open 01, high 00 low 00, and close 00 prices of the underlying asset.
Now, let's introduce a new parameter, period, which will determine how many periods are considered in the calculation of the HA candles. This period parameter will affect the smoothing and responsiveness of the resulting candles.
In this modification, instead of considering just the current period, we're averaging or aggregating the prices over a specified number of periods . This will result in candles that reflect a longer-term trend or sentiment, depending on the chosen period value.
For example, if period is set to 1, it would essentially be the same as traditional Heikin Ashi candles. However, if period is set to a higher value, say 5, each candle will represent the average price movement over the last 5 periods, providing a smoother representation of the trend but potentially with delayed signals compared to lower period values.
Traders can adjust the period parameter based on their trading style, the timeframe they're analyzing, and the level of smoothing or responsiveness they prefer in their candlestick patterns.
Optimized Trend Tracker
The "Optimized Trend Tracker" is a proprietary trading indicator developed by TradingView user ANIL ÖZEKŞİ. It is designed to identify and track trends in financial markets efficiently. The indicator attempts to smooth out price fluctuations and provide clear signals for trend direction.
The Optimized Trend Tracker uses a combination of moving averages and adaptive filters to detect trends. It aims to reduce lag and noise typically associated with traditional moving averages, thereby providing more timely and accurate signals.
Some of the key features and applications of the OTT include:
• Trend Identification: The indicator helps traders identify the direction of the prevailing trend in a market. It distinguishes between uptrends, downtrends, and sideways consolidations.
• Entry and Exit Signals: The OTT generates buy and sell signals based on crossovers and direction changes of the trend. Traders can use these signals to time their entries and exits in the market.
• Trend Strength: It also provides insights into the strength of the trend by analyzing the slope and momentum of price movements. This information can help traders assess the conviction behind the trend and adjust their trading strategies accordingly.
• Filter Noise: By employing adaptive filters, the indicator aims to filter out market noise and false signals, thereby enhancing the reliability of trend identification.
• Customization: Traders can customize the parameters of the OTT to suit their specific trading preferences and market conditions. This flexibility allows for adaptation to different timeframes and asset classes.
Overall, the OTT can be a valuable tool for traders seeking to capitalize on trending market conditions while minimizing false signals and noise. However, like any trading indicator, it is essential to combine its signals with other forms of analysis and risk management strategies for optimal results. Additionally, traders should thoroughly back-test the indicator and practice using it in a demo environment before applying it to live trading.
The following types of moving average have been included: "SMA", "EMA", "SMMA (RMA)", "WMA", "VWMA", "HMA", "KAMA", "LSMA", "TRAMA", "VAR", "DEMA", "ZLEMA", "TSF", "WWMA". Thanks to the authors.
Thank you for your indicator “Optimized Trend Tracker”. © kivancozbilgic
Thank you for your programming language, indicators and strategies. © TradingView
Kind regards.
© Erebor_GIT

Trend: SMA with ATR Bands and EMA [Oxyge]Brief introduction:
Easy to use trend indicator to help find entry positions
How it works:
1, short-term trend judgment: EMA is greatly influenced by short-term trends, so it is very good to use it as a tool for judging short-term trends. At the same time, the filtering function has been added:
Long: green
Short: red
No direction: blue
2, the general trend judgment: the use of 30SMA as the default trend line, while increasing the ATR band to increase the scope of judgment.
How do I use (assuming it is now a period of long market):
1, first look at the 30SMA and ATR band, if the slope is positive (> 45 °), then ready to go long!
2. When price comes to the ATR band, the ATR band is my point of interest
3. Wait for a test of the ATR band: the EMA turns green, which means that the short-term trend is already nice and long.
4. Stop Loss Placement: Stop Loss is placed at the most recent low.
Closing
Enjoy it!
——————————————
简单介绍:
简单易用的趋势指标,帮助寻找进场位置
它怎么工作:
1、短期趋势判断:EMA受短期趋势影响很大,因此把它作为判断短期趋势的工具非常好用。同时增加了过滤功能:
多头:绿色
空头:红色
无方向:蓝色
2、大趋势判断:使用30SMA作为默认趋势线,同时增加ATR带增加判断范围。
我是如何使用的(假设是现在是一段多头行情):
1、先看30SMA和ATR带,如果斜率为正(>45°),那么准备做多
2、当价格来到ATR带时,ATR带是我的感兴趣的点
3、等待一次对于ATR带的测试:EMA变成绿色,代表短期已经是不错的多头趋势
4、止损放置:止损放置在最近的低点
结束
请享受它

Altered Money Flow Index by CoffeeShopCrypto**Use the comments section below to request access to the script**
Market Trends need to be confirmed each and every time.
Over the years the Money Flow Index has been a tool to find where the money is flowing
either long or short in market movements.
Long confirmation and false short
Confirming a long entry:
1. Wait for price to close above a previous swing high.
2. Look to see if the MFI is in UPCOLOR and above ZERO.
Confriming a short entry:
1. Wait for price to close below a previous swing low.
2. Look to see if the MFI is in DOWNCOLOR and below ZERO.
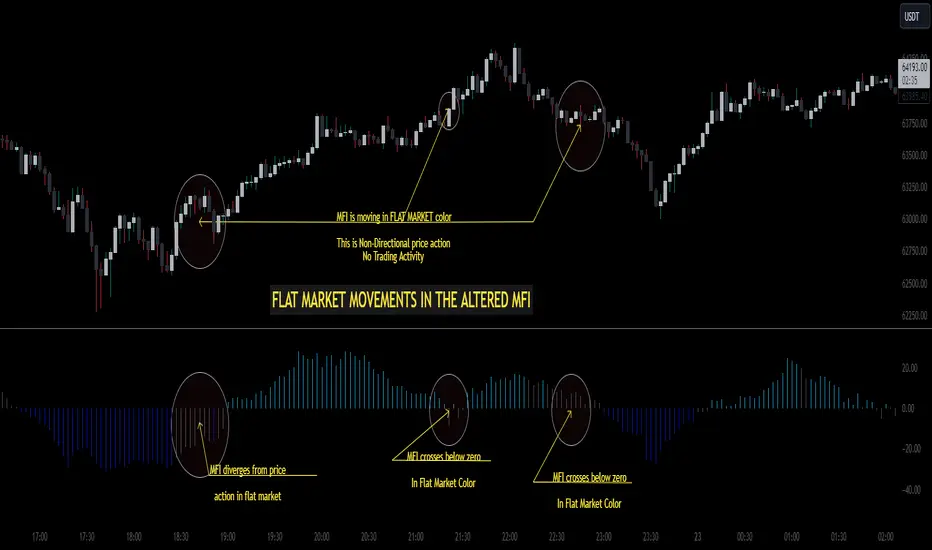
NON-Confirmed market: (Flat Market)
Anytime you believe you have a confirmation via price action, check the MFI to see if it is in FLAT MARKET color.
If this is true, do not enter until it is out of FLAT MARKET color.
Flat Market ALtered MFI
A Flat Market Altered MFI reading can do a few things for you.
It can help to confirm the following:
1. price action is moving sideways.
2. a pullback or market stall that was deep enough where dis-intrest in the market occured.
3. a sudden loss of momentum in the short term trend of closing prices.
Utilizing the Altered Money Flow Index indicator by CoffeeShopCrypto offers traders a nuanced approach to identifying market trends, including periods of flat market conditions. Alongside its directional bias indicating bullish or bearish activity based on whether values are above or below zero, respectively, the script incorporates a distinctive feature to recognize flat markets. When neither bullish nor bearish momentum dominates, the indicator designates a flat market, denoted by a distinct color. This feature enhances traders' ability to discern not only bullish and bearish phases but also periods of market consolidation or indecision.
In addition to its ability to recognize bullish and bearish trends, the Altered Money Flow Index indicator by CoffeeShopCrypto incorporates a unique feature to signify potential pullbacks or pauses in market momentum. This is particularly evident when the MFI crosses below zero while displaying a flat market color. Such occurrences suggest that although the short-term movement may appear bearish, it's likely a temporary pullback rather than a sustained trend reversal. Similarly, when the MFI crosses above zero amidst a flat market color, it indicates a potential pause in bullish momentum, urging traders to exercise caution and await confirmation of a sustained uptrend. By incorporating these nuanced observations, traders can effectively discern between short-term fluctuations and significant trend changes, enabling them to make more judicious trading decisions and avoid premature entries or exits.
Alongside its directional bias indicating bullish or bearish activity based on whether values are above or below zero, respectively, the script integrates the Relative Strength Index (RSI) to further refine market analysis. When the Altered MFI and RSI are both above zero, it suggests a strong bullish trend, indicating significant buying pressure. Conversely, when both indicators are below zero, it indicates a strong bearish trend, signifying heightened selling pressure. By observing the confluence between the Altered MFI and RSI, traders can gain valuable confirmation of bullish or bearish money flow in the market, enabling them to make more informed trading decisions.
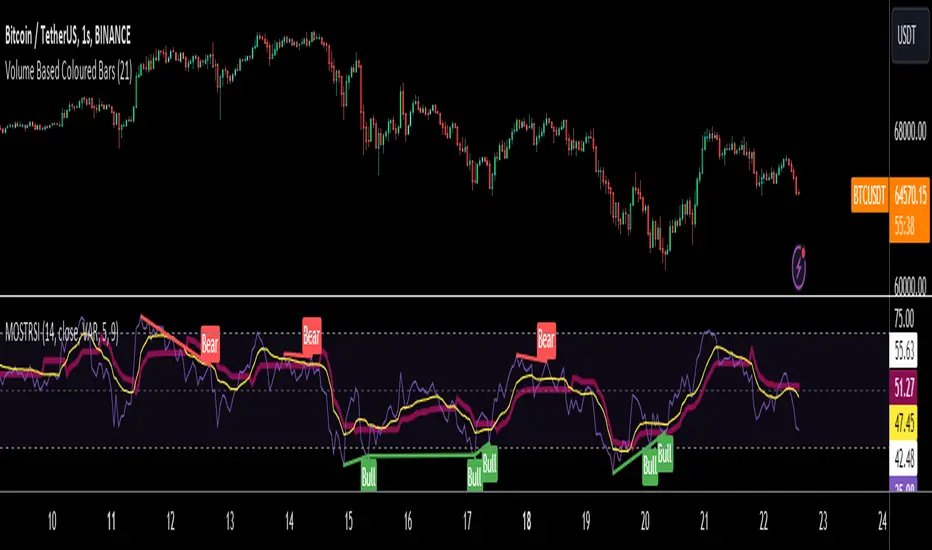
MOST on RSIMOST is applied on this RSI moving average with an extra default option added VAR/VIDYA (Variable Index Dynamic Moving Average)
MOST added on RSI has a Moving Average of RSI and a trailing percent stop level of the Moving Average that can be adjusted by changing the length of the MA and %percent of the stop level.
BUY SIGNAL when the Moving Average Line crosses above the MOST Line
LONG CONDITION when the Moving Average is above the MOST
SELL SIGNAL when Moving Average Line crosses below MOST Line
SHORT CONDITION when the Moving Average is below MOST
-MOST indicator advised to use with Variable Moving Average in the sideways market by its developer Anıl Özekşi, so there are a couple of alternative Moving Average OPTIONS to use in the calculation of MOST:
"SMA", "Bollinger Bands", "EMA", "SMMA (RMA)", "WMA", "VWMA", "VAR"
SMA: Simple Moving Average
EMA: Exponential Movin Average
SMMA (RMA: Smoothed Moving Average, Rolling/Running Moving Average
WMA: Weighted Moving Average
WWMA: Welles Wilder's Moving Average
VAR: Variable Index Dynamic Moving Average aka VIDYA
The Moving Average length and stop loss percent values must be increased for less reliable but late signals. Conversely, it must be decreased to have more and faster signals.
As this indicator is derived from TradingView's built-in RSI, it has Bollinger Bands bounding RSI and a tool that can be used for Bullish & Bearish divergences between the price and RSI. (Show Divergence option)
Finally, users may check the box "Show Signals" to visually see the BUY & SELL signals.
MBAND 200 4H BTC/USDT - By MGS-TradingMBAND 200 4H BTC/USDT with RSI and Volume by MGS-Trading: A Neural Network-Inspired Indicator
Introduction:
The MBAND 200 4H BTC/USDT with RSI and Volume represents a groundbreaking achievement in the integration of artificial intelligence (AI) into cryptocurrency market analysis. Developed by MGS-Trading, this indicator is the culmination of extensive research and development efforts aimed at leveraging AI's power to enhance trading strategies. By synthesizing neural network concepts with traditional technical analysis, the MBAND indicator offers a dynamic, multi-dimensional view of the market, providing traders with unparalleled insights and actionable signals.
Innovative Approach:
Our journey to create the MBAND indicator began with a simple question: How can we mimic the decision-making prowess of a neural network in a trading indicator? The answer lay in the weighted aggregation of Exponential Moving Averages (EMAs) from multiple timeframes, each serving as a unique input akin to a neuron in a neural network. These weights are not arbitrary; they were painstakingly optimized through backtesting across various market conditions to ensure they reflect the significance of each timeframe’s contribution to overall market dynamics.
Core Features:
Neural Network-Inspired Weights: The heart of the MBAND indicator lies in its AI-inspired weighting system, which treats each timeframe’s EMA as an input node in a neural network. This allows the indicator to process complex market data in a nuanced and sophisticated manner, leading to more refined and informed trading signals.
Multi-Timeframe EMA Analysis: By analyzing EMAs from 15 minutes to 3 days, the MBAND indicator captures a comprehensive snapshot of market trends, enabling traders to make informed decisions based on a broad spectrum of data.
RSI and Volume Integration: The inclusion of the Relative Strength Index (RSI) and volume data adds layers of confirmation to the signals generated by the EMA bands. This multi-indicator approach helps in identifying high-probability setups, reinforcing the neural network’s concept of leveraging multiple data points for decision-making.
Usage Guidelines:
Signal Interpretation: The MBAND bands provide a visual representation of the market’s momentum and direction. A price moving above the upper band signals strength and potential continuation of an uptrend, while a move below the lower band suggests weakness and a possible downtrend.
Overbought/Oversold Conditions: The RSI component identifies when the asset is potentially overbought (>70) or oversold (<30). Traders should watch for these conditions near the MBAND levels for potential reversal opportunities.
Volume Confirmation: An increase in volume accompanying a price move towards or beyond an MBAND level serves as confirmation of the strength behind the move. This can indicate whether a breakout is likely to sustain or if a reversal has substantial backing.
Strategic Entry and Exit Points: Combine the MBAND readings with RSI and volume indicators to pinpoint strategic entry and exit points. For example, consider entering a long position when the price is near the lower MBAND, RSI indicates oversold conditions, and there is a notable volume increase.
About MGS-Trading:
At MGS-Trading, we are passionate about harnessing the transformative power of AI to revolutionize cryptocurrency trading. Our indicators and tools are designed to provide traders with advanced analytics and insights, drawing on the latest AI techniques and methodologies. The MBAND 200 4H BTC/USDT with RSI and Volume indicator is a prime example of our commitment to innovation, offering traders a sophisticated, AI-enhanced tool for navigating the complexities of the cryptocurrency markets.
Disclaimer:
The MBAND indicator is provided for informational purposes only and does not constitute investment advice. Trading cryptocurrencies involves significant risk and can result in the loss of your investment. We recommend conducting your own research and consulting with a qualified financial advisor before making any trading decisions.

CAPACE MARKETThis custom indicator combines the Moving Average Convergence Divergence (MACD) and the Relative Strength Index (RSI) into a single trading tool. It calculates the MACD and RSI values, then averages these two indicators to create a composite line. This average line is intended to capture the momentum and relative strength of the market simultaneously, potentially offering a more nuanced view of market conditions.
Key features of the indicator include:
Visualization of MACD and RSI Lines: It plots the MACD and RSI values as separate lines on the chart, allowing traders to see the behavior of each indicator clearly.
Average Line: A line representing the average of the MACD and RSI indicators is plotted, providing a synthesized view of both momentum and strength.
Entry Points Indication: The indicator uses red dots to mark the points where the average line crosses over or under the MACD or RSI lines. These intersections are meant to signal potential entry points for traders.
Market Condition Highlighting: The background color changes based on whether the average line is above or below zero. A green background suggests a positive market condition (bullish), while a red background indicates a negative market condition (bearish).
This tool aims to offer traders an integrated perspective by combining the insights of both MACD and RSI, potentially aiding in the identification of entry and exit points as well as the overall market sentiment.

RSI / Connectable [Azullian]Enhance your trading approach with the modular RSI indicator, skilled in identifying market extremes. Simplify pattern visualization and signal weighting for more efficient strategy formulation.
This connectable RSI indicator is part of an indicator system designed to help test, visualize and build strategy configurations without coding. Like all connectable indicators , it interacts through the TradingView input source, which serves as a signal connector to link indicators to each other. All connectable indicators send signal weight to the next node in the system until it reaches either a connectable signal monitor, signal filter and/or strategy.
█ UNIFORM SETTINGS AND A WAY OF WORK
Although connectable indicators may have specific weight scoring conditions, they all aim to follow a standardized general approach to weight scoring settings, as outlined below.
■ Connectable indicators - Settings
• 🗲 Energy: Energy applies an ATR multiplier to the plotted shapes on the chart. A higher value plots shapes farther away from the candle, enhancing visibility.
• ☼ Brightness: Brightness determines the opacity of the shape plotted on the chart, aiding visibility. Indicator weight also influences opacity.
• → Input: Use the input setting to specify a data source for the indicator. Here you can connect the indicator to other indicators.
• ⌥ Flow: Determine where you want to receive signals from:
○ Both: Weights from this indicator and the connected indicator will apply
○ Indicator only: Only weights from this indicator will apply
○ Input only: Only weights from the connected indicator will apply
• ⥅ Weight multiplier: Multiply all weights in the entire indicator by a given factor, useful for quickly testing different indicators in a granular setup.
• ⥇ Threshold: Set a threshold to indicate the minimum amount of weight it should receive to pass it through to the next indicator.
• ⥱ Limiter: Set a hard limit to the maximum amount of weight that can be fed through the indicator.
■ Connectable indicators - Weight scoring settings
▢ Weight scoring conditions
• SM – Signal mode: Enable specific conditions for weight scoring
○ All: All signals will be scored.
○ Entries only: Only entries will score.
○ Exits only: Only exits will score.
○ Entries & exits: Both entries and exits will score.
○ Zone: Continuous scoring for each candle within the zone.
• SP – Signal period: Defines a range of candles within which a signal can score.
• SC - Signal count: Specifies the number of bars to retrospectively examine and score.
○ Single: Score for a single occurrence
○ All occurrences: Score for all occurrences
○ Single + Threshold: Score for single occurrences within the signal period (SP)
○ Every + Threshold: Score for all occurrences within the signal period (SP)
▢ Weight scoring direction
• ES: Enter Short weight
• XL: Exit long weight
• EL: Enter Long weight
• XS: Exit Short weight
▢ Weight scoring values
• Weights can hold either positive or negative scores. Positive weights enhance a particular trading direction, while negative weights diminish it.
■ Entries, exits and zone illustrated on a standard RSI indicator when the RSI is overbought.
█ RSI - INDICATOR SETTINGS
■ Main settings
• Enable/Disable Indicator: Toggle the entire indicator on or off.
• S - Source: Choose an alternative data source for the RSI calculation.
• T - Timeframe: Select an alternative timeframe for the RSI calculation.
• LE - Length: Define the number of bars or periods used in the RSI calculation.
• OB - Overbought Level: Determine the RSI value at which overbought conditions are met.
• OS - Oversold Level: Specify the RSI value at which oversold conditions are met.
■ Scoring functionality
• The RSI scores long entries when the RSI enters OS: oversold area
• The RSI scores long exits when the RSI exits OS: oversold area
• The RSI scores long zones the entire time the RSI is in OS: oversold area
• The RSI scores short entries when the RSI enters OB: overbought area
• The RSI scores short exits when the RSI exits OB: overbought area
• The RSI scores short zones the entire time the RSI is in OB: overbought area
█ PLOTTING
• Standard: Symbols (EL, XS, ES, XL) appear relative to candles based on set conditions. Their opacity and position vary with weight.
• Conditional Settings: A larger icon appears if global conditions are met. For instance, with a Threshold(⥇) of 12, Signal Period (SP) of 3, and Scoring Condition (SC) set to "EVERY", an RSI signaling over two times in 3 candles (scoring 6 each) triggers a larger icon.
█ USAGE OF CONNECTABLE INDICATORS
■ Connectable chaining mechanism
Connectable indicators can be connected directly to the signal monitor, signal filter or strategy , or they can be daisy chained to each other while the last indicator in the chain connects to the signal monitor, signal filter or strategy. When using a signal filter you can chain the filter to the strategy input to make your chain complete.
• Direct chaining: Connect an indicator directly to the signal monitor, signal filter or strategy through the provided inputs (→).
• Daisy chaining: Connect indicators using the indicator input (→). The first in a daisy chain should have a flow (⌥) set to 'Indicator only'. Subsequent indicators use 'Both' to pass the previous weight. The final indicator connects to the signal monitor, signal filter, or strategy.
■ Set up this indicator with a signal filter and strategy
The indicator provides visual cues based on signal conditions. However, its weight system is best utilized when paired with a connectable signal filter, signal monitor, or strategy .
Let's connect the RSI to a connectable signal filter and a strategy :
1. Load all relevant indicators
• Load RSI / Connectable
• Load Signal filter / Connectable
• Load Strategy / Connectable
2. Signal Filter: Connect the RSI to the Signal Filter
• Open the signal filter settings
• Choose one of the three input dropdowns (1→, 2→, 3→) and choose : RSI / Connectable: Signal Connector
• Toggle the enable box before the connected input to enable the incoming signal
3. Signal Filter: Update the filter signals settings if needed
• The default settings of the filter enable EL (Enter Long), XL (Exit Long), ES (Enter Short) and XS (Exit Short).
4. Signal Filter: Update the weight threshold settings if needed
• All connectable indicators load by default with a score of 6 for each direction (EL, XL, ES, XS)
• By default, weight threshold (TH) is set at 5. This allows each occurrence to score, as the default score in each connectable indicator is 1 point above the threshold. Adjust to your liking.
5. Strategy: Connect the strategy to the signal filter in the strategy settings
• Select a strategy input → and select the Signal filter: Signal connector
6. Strategy: Enable filter compatible directions
• Set the signal mode of the strategy to a compatible direction with the signal filter.
Now that everything is connected, you'll notice green spikes in the signal filter representing long signals, and red spikes indicating short signals. Trades will also appear on the chart, complemented by a performance overview. Your journey is just beginning: delve into different scoring mechanisms, merge diverse connectable indicators, and craft unique chains. Instantly test your results and discover the potential of your configurations. Dive deep and enjoy the process!
█ BENEFITS
• Adaptable Modular Design: Arrange indicators in diverse structures via direct or daisy chaining, allowing tailored configurations to align with your analysis approach.
• Streamlined Backtesting: Simplify the iterative process of testing and adjusting combinations, facilitating a smoother exploration of potential setups.
• Intuitive Interface: Navigate TradingView with added ease. Integrate desired indicators, adjust settings, and establish alerts without delving into complex code.
• Signal Weight Precision: Leverage granular weight allocation among signals, offering a deeper layer of customization in strategy formulation.
• Advanced Signal Filtering: Define entry and exit conditions with more clarity, granting an added layer of strategy precision.
• Clear Visual Feedback: Distinct visual signals and cues enhance the readability of charts, promoting informed decision-making.
• Standardized Defaults: Indicators are equipped with universally recognized preset settings, ensuring consistency in initial setups across different types like momentum or volatility.
• Reliability: Our indicators are meticulously developed to prevent repainting. We strictly adhere to TradingView's coding conventions, ensuring our code is both performant and clean.
█ COMPATIBLE INDICATORS
Each indicator that incorporates our open-source 'azLibConnector' library and adheres to our conventions can be effortlessly integrated and used as detailed above.
For clarity and recognition within the TradingView platform, we append the suffix ' / Connectable' to every compatible indicator.
█ COMMON MISTAKES, CLARIFICATIONS AND TIPS
• Removing an indicator from a chain: Deleting a linked indicator and confirming the "remove study tree" alert will also remove all underlying indicators in the object tree. Before removing one, disconnect the adjacent indicators and move it to the object stack's bottom.
• Point systems: The azLibConnector provides 500 points for each direction (EL: Enter long, XL: Exit long, ES: Enter short, XS: Exit short) Remember this cap when devising a point structure.
• Flow misconfiguration: In daisy chains the first indicator should always have a flow (⌥) setting of 'indicator only' while other indicator should have a flow (⌥) setting of 'both'.
• Hide attributes: As connectable indicators send through quite some information you'll notice all the arguments are taking up some screenwidth and cause some visual clutter. You can disable arguments in Chart Settings / Status line.
• Layout and abbreviations: To maintain a consistent structure, we use abbreviations for each input. While this may initially seem complex, you'll quickly become familiar with them. Each abbreviation is also explained in the inline tooltips.
• Inputs: Connecting a connectable indicator directly to the strategy delivers the raw signal without a weight threshold, meaning every signal will trigger a trade.
█ A NOTE OF GRATITUDE
Through years of exploring TradingView and Pine Script, we've drawn immense inspiration from the community's knowledge and innovation. Thank you for being a constant source of motivation and insight.
█ RISK DISCLAIMER
Azullian's content, tools, scripts, articles, and educational offerings are presented purely for educational and informational uses. Please be aware that past performance should not be considered a predictor of future results.
