HV-RV Oscillator by DINVESTORQ(PRABIR DAS)Description:
The HV-RV Oscillator is a powerful tool designed to help traders track and compare two types of volatility measures: Historical Volatility (HV) and Realized Volatility (RV). This indicator is useful for identifying periods of market volatility and can be employed in various trading strategies. It plots both volatility measures on a normalized scale (0 to 100) to allow easy comparison and analysis.
How It Works:
Historical Volatility (HV):
HV is calculated by taking the log returns of the closing prices and finding the standard deviation over a specified period (default is 14 periods).
The value is then annualized assuming 252 trading days in a year.
Realized Volatility (RV):
RV is based on the True Range, which is the maximum of the current high-low range, the difference between the high and the previous close, and the difference between the low and the previous close.
Like HV, the standard deviation of the True Range over a specified period is calculated and annualized.
Normalization:
Both HV and RV values are normalized to a 0-100 scale, making it easy to see their relative magnitude over time.
The highest and lowest values within the period are used to normalize the data, which smooths out short-term volatility spikes.
Smoothing:
The normalized values of both HV and RV are then smoothed using a Simple Moving Average (SMA) to reduce noise and provide a clearer trend.
Crossover Signals:
Buy Signal : When the Normalized HV crosses above the Normalized RV, it indicates that the historical volatility is increasing relative to the realized volatility, which could be interpreted as a buy signal.
Sell Signal : When the Normalized HV crosses below the Normalized RV, it suggests that the historical volatility is decreasing relative to the realized volatility, which could be seen as a sell signal.
Features:
Two Volatility Lines: The blue line represents Normalized HV, and the orange line represents Normalized RV.
Neutral Line: A gray dashed line at the 50 level indicates a neutral state between the two volatility measures.
Buy/Sell Markers: Green upward arrows are shown when the Normalized HV crosses above the Normalized RV, and red downward arrows appear when the Normalized HV crosses below the Normalized RV.
Inputs:
HV Period: The number of periods used to calculate Historical Volatility (default = 14).
RV Period: The number of periods used to calculate Realized Volatility (default = 14).
Smoothing Period: The number of periods used for smoothing the normalized values (default = 3).
How to Use:
This oscillator is designed for traders who want to track the relationship between Historical Volatility and Realized Volatility.
Buy signals occur when HV increases relative to RV, which can indicate increased market movement or potential breakout conditions.
Sell signals occur when RV is greater than HV, signaling reduced volatility or potential trend exhaustion.
Example Use Cases:
Breakout/Trend Strategy: Use the oscillator to identify potential periods of increased volatility (when HV crosses above RV) for breakout trades.
Mean Reversion: Use the oscillator to detect periods of low volatility (when RV crosses above HV) that might signal a return to the mean or consolidation.
This tool can be used on any asset class such as stocks, forex, commodities, or indices to help you make informed decisions based on the comparison of volatility measures.
NOTE: FOR INTRDAY PURPOSE USE 30/7/9 AS SETTING AND FOR DAY TRADE USE 14/7/9
Chỉ số Biến động tương đối (RVI)

Relative Range at Time/ Relative volatility / High−Low This script is designed to help you compare the size of the current price candle (the difference between the highest and lowest prices in a given time period) to the average size of the last several candles. It does this by calculating the average range of a certain number of previous candles (you can set how many with the "Length" input) and then dividing the current candle's range by this average. The result is plotted on the chart as a bar: if the current candle's range is larger than the average, the bar is green; if it's smaller, the bar is red. A horizontal line is also drawn at the value of 1, so you can easily see whether the current candle's range is above or below the average. If there’s an issue with the data, the script will show an error message to let you know.

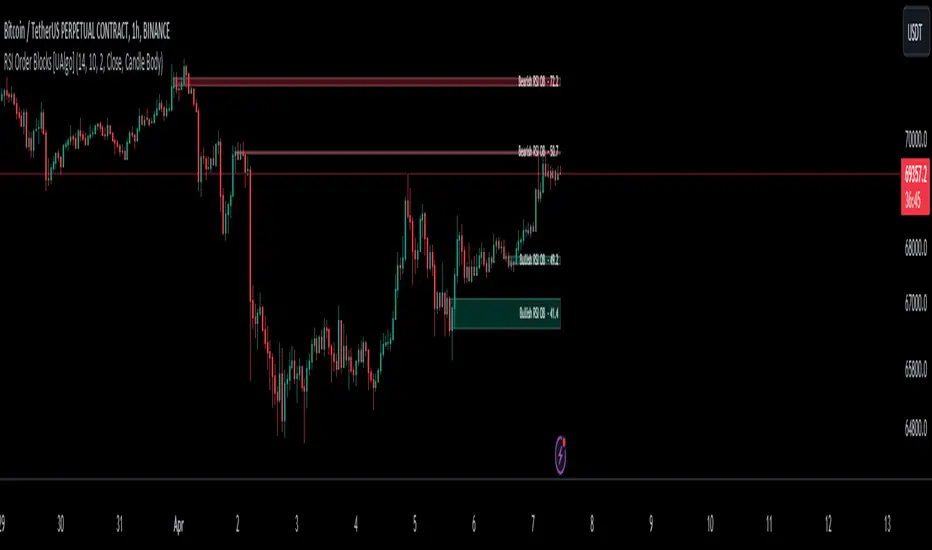
RSI Order Blocks [UAlgo]The "RSI Order Blocks " identifies and visualizes potential order blocks based on the Relative Strength Index (RSI) indicator. These zones may indicating potential support or resistance levels.
🔶 Key Features :
RSI-based Order Block Identification: The script utilizes the RSI indicator to identify potential order blocks. It detects pivot highs and lows in the RSI, which are indicative of potential reversal points, and marks these areas as potential order blocks.
Order Block Visualization: Identified order blocks are visually represented on the chart, making it easy for traders to recognize and interpret these significant price zones. Both bullish and bearish order blocks are differentiated by color, enhancing clarity and ease of analysis. Additionally, within each order block, the RSI value of that block is also shown.
RSI Overbought/Oversold Filter: Optionally, users can apply a filter based on RSI levels to refine the detection of order blocks. This filter prevents the creation of order blocks when the RSI is within specified overbought or oversold conditions (default between 30 and 70), helping traders focus on areas of potentially significant price action.
An Example with the OB/OS Filter Feature Turned Off:
An Example with the OB/OS Filter Feature Turned On:
Mitigation of Broken Order Blocks: Provides flexibility in selecting the mitigation method (based on close or wick) for determining order block breaches.
Customizable Parameters: The script offers a range of customizable parameters to tailor the detection and visualization of order blocks to suit individual trading preferences. Users can adjust parameters such as RSI Length, Order Block Detection Sensitivity, Mitigation Method, and order block style to fine-tune the analysis according to their trading strategy.
🔶 Disclaimer :
Not Financial Advice: This indicator is intended for educational and informational purposes only. It does not constitute financial advice or recommendations to buy, sell, or hold any financial instruments.
Use at Own Risk: Trading involves substantial risk of loss and is not suitable for all investors. Users of this indicator should exercise caution and conduct their own research and analysis before making any trading decisions.
Performance Not Guaranteed: Past performance is not indicative of future results. While the indicator aims to assist traders in analyzing market trends, there is no guarantee of accuracy or success in trading operations.
CofeeShopCrypto CoffeeBreak RSI**This Indicator DOES NOT REPAINT**
For me the RSI who's been a very powerful tool but one of the things that's been missing from it time and time again is the ability to show true dynamic support and resistance that is generated by the movements of the RSI.
This version of the Relative Strength Index is designed to visualize and mark Support and Resistance conditions on the Relative Strength Index (RSI) itself, and leaving behind those known dynamic support and resistance (S/R) zones.
It also has the ability during live marks to show you whether the majority of momentum is to the bullish or bearish side and if there is a conflict between the current momentum and the support or resistance zone that you are inside of. In short it will create the zones during live market.
This means you don't have to wait to only look at previous values you can also make an assessment during live breakouts on current support and resistance levels as well as using previous support and resistance levels as markers for any limits in movement.
Inputs Tab:
Show Dynamic Zone Creator - Gives you a live action SR Generator on your chart at your current bars which extends a bit into the future for a better visual sense of activity.
The color of this area can be set manually or you can let the script color this area automatically.
This Generator helps to plot Support and Resistance Zones on your chart.
If no zone is triggered then it will move on.
If a zone is triggered, it will change to the appropriate color and leave the zone behind as the new candles form.
Show Dynamic Zone Mid Level - This is just a midline of the Zone Creator to get an earlier visualization of what's happening inside the zone when it is very large.
I use this midline as a breakpoint when price and RSI values come back to this level and both break it. If only ONE breaks the level, I do not take it as a confirmation.
Extend RSI support and resistance boxes into the future - this is strictly up to the user which value you set. It will simply extend the zones that were left behind into the future as many bars as you choose. Depending on the chart or asset that you trade and how much volatility there is at the time you should be able to determine a good length for these boxes.
How many bars reflect the dynamic S/R zone - raising this value can overlap more zones using more bars going backwards. This can intensify the color of the current zone being created. The lowest value you should use is 2. But the higher you make this value you will also be able to see previous zones created with more intensity. Raising this value above the RSI value can give you a very nice previous depletion of color on previous zones where you'll be able to watch them fade away and it will intensify the current ones being created.
Only show this many previous support and resistance zones - this is a way to limit the number of zones that are being left behind on your chart which could possibly slow down the activity of calculations and how your chart moves with more indicators on it. Technically you can show 400 to 500 previous zones on your chart but you don't really need to see that many in the past so set this to something that is relative to how far in history you need to reference SR levels.
------------- Lets talk about how to take trades and see false breakouts. -------------
Support Created, Not broken, False Breakout
In the image below you can see how the Dynamic Zone Generator left behind a Support Level however the RSI was unable to break above it.
This creates a price swing on the chart.
The RSI later comes back to this level, however while price breaks this level, the RSI does not.
This confirms that it is a false breakout.
------------------------------------------------------------------------------------------
Now lets take a look at what a confirmed breakout is for a short along with a Continuation of short move. This is quickly followed by a divergence.
In the image below you can see how the RSI was in its ranging area and broke below that range. In this case it would be be below -10. During this time it never created a support level or resistance level underneath it implicating that it has continuous movement.
You can see later that when it broke back inside of the range did not go long instead there was a red resistance area created below the RSI. The RSI then again broke below -10 and it broke through this resistance area below it indicating another quick short entry. This is the setup for a quick continuation. Be careful of these setups as they are usually followed quickly by a divergence.
----------------------------------------------------------------------------------
The Dynamic Zone Creator takes its time to calculate. It cant predict the future so you'll have to just let it do its thing. Once the candles close and they confirm, you'll have the color, and zone size you need.
The Dynamic Zone Creator works against your currently OPEN candles.
It will give you a high and a low area of a zone which you can use in later points of the oscillator to determine if you have valid breakouts and or bounces of price and momentum.
When set to automatic coloring, its zone background and midline will automatically change their colors to match the momentum of the RSI and price.
If there is no support or resistance found, the Zone Creator will simply move onto the next candles in play.
If there IS support or resistance found, the Zone Creator will leave behind a phantom zone or Support or Resistance.
Keep in mind these zones left behind will turn into opposing Support or Resistance depending on if price and momentum break these areas simultaneously.
----------------------------Reason for closed source----------------------------
This indicator will be updated in the future to also produce trendlines, signals, and incorporate different methods of validate pivots and volume by calculations I have created of my own.
To avoid publishing this script more than once and give you all a direct access, without having to find a secondary or tertiary publication with the addons code is protected and will be updated here.
I have put several days into this particular script and will continue over the next few weeks to add in complimentary coding as this version of the script is really just stage one.
Machine Learning: MFI Heat Map [YinYangAlgorithms]Overview:
MFI Heat Maps are a visually appealing way to display the values of 29 different MFIs at the same time while being able to make sense of it. Each plot within the Indicator represents a different MFI value. The higher you get up, the longer the length that was used for this MFI. This Indicator also features the use of Machine Learning to help balance the MFI levels. It doesn’t solely rely upon Machine Learning but instead incorporates a growing length MFI averaged with the Machine Learning MFI at any given index.
For instance, say we are calculating the 10th plot from the bottom, the MFI would be an average of:
MFI(source, 11)
Machine Learning MFI at Index of 10
We do it this way as they both help smooth each other out without relying solely on just one calculation method.
Due to plot limitations, you are capped at 28 Plot Amounts within this indicator, but that is still quite a bit of information you can glean from a Heat Map.
The Machine Learning used in this indicator is of the K-Nearest Neighbor (KNN). It uses a Fast and Slow MFI calculation then sorts through them over Machine Learning Length and calculates the differences between them. It then slices off KNN length to create our Max/Min Distances allotted. It adds the average between Fast and Slow MFIs to a Viable Distances array if their distances are within the KNN Min/Max distance. It then averages all distances in the Viable Distances array and returns the result.
The result of the KNN Function is saved to another ML Data array whose length is that of Plot Amount (Heat Map Size). This way each Index of the ML Data array can be indexed according to the Heat Map Size.
The Average of the ML Data array is the MFI line (white) that you’ll see plotted on the Indicator. There is also the SMA of the MFI Average (orange) which is likewise plotted. These plots allow you to visualize where the ML MFI is sitting and can potentially be useful for seeing when the MFI Average and SMA cross over and under each other.
We’ve heard many people talk highly of RSI, but sadly not too many even refer to MFI. MFI oftentimes may be overlooked, especially with new traders who may not even know what it is. Essentially MFI is an RSI but it also incorporates Volume into its calculations, which in our opinion leads to a more accurate reading; afterall, what is price movement without Volume.
Tutorial:
You may be thinking, this Indicator looks appealing to the eye, but how do I benefit from it trading wise?
Before we get into our visual examples, let's talk briefly about what makes Heat Maps in general a useful tool for trading. Heat Maps give us the ability to visualize and understand lots of data while removing the clutter. We can understand the data of 29 different MFIs without having to look at and decipher 29 different MFI plots. When you overlay too many MFI lines on top of each other, they can be very difficult to read and oftentimes end up actually hindering your Technical Analysis. For this reason, we have a simple solution to this problem; Heat Maps. This MFI Heat Map allows you to easily know (in a relative %) what the MFI level is for varying lengths. For Instance, the First (bottom) plot indexes an MFI of (K(0) (loop of Plot Amount) + Smoothing Length (default 1)) = 1. Since this is indexing (usually) a very low length, it will change much quicker. Whereas the Last (top) plot indexes an MFI of (K(27) (loop of Plot Amount) + Smoothing Length (default 1)) = 28. This is indexing a much higher length of MFI which results in the MFI the higher you go up in the Heat Map to move much slower.
Heat Maps give us the ability to see changes happening over multiple MFIs at the same time, which can be very useful for seeing shifts in MFI / Momentum. Remember, MFI incorporates Volume, so even if the price goes up a lot, if there was low volume, the MFI won’t move as much as an RSI would. However, likewise, if there is high volume but low price movement, the MFI will move slightly more than the RSI.
Heat Maps change color based on their MFI level. If the MFI is >= 90 it is HOT (red), if the MFI <= 9 it is COLD (teal, think of ICE). Green represents an MFI of 50-59 and Dark Blue represents an MFI of 40-49. Green and Dark blue are the most common colors as all the others are more ‘Extreme’ MFI levels.
Okay, time to get to the Examples :
Since there is so much going on in Heat Maps, we’ve decided to focus this tutorial to this specific area and talk about individual locations before talking about it as a whole.
If you refer to the example above where there are 2 white circles; these white circles are highlighting a key location you’ll be wanting to identify within your Heat Maps, many things are happening here:
The MFI crossed over the SMA (bullish).
The Heat Map started changing from mid/dark Blue (30-50 MFI) to Green (50-59 MFI) around the midline (the 50% dashed like).
The Lower levels of the Heat Map are turning Yellow/Orange/Red (60-100 MFI).
The Upper Levels of the Heat Map are still Light Blue - Green (10-50 MFI).
The 4 Key points above, all point towards potential Bullish Momentum changes. You’re likely wondering, but why? Let's discuss about each one in more specific detail:
1. The MFI crossed over the SMA (bullish): What this tells us is that the current MFI Average is now greater than its average over the last (default) 16 bars. This means there's been a large amount of Money Flow (Price and Volume) recently (subjectively based on the last (default) 16 average). This is one of the leading Bullish / Bearish signals you will see within this Indicator. You can enable Signals within the Settings and/or even add Alerts for when these crossings occur.
2. The Heat Map started changing from mid/dark Blue (30-50 MFI) to Green (50-59 MFI) around the midline (the 50% dashed like): This shows us that the index’s in the mid (if using all 28 heat map plots it would be at 14) has already received some of this momentum change. If you look at the second white circle (right), you’ll also notice the higher MFI plot indexes are also green. This is because since their length is long they still have some momentum and strength from the first white circle (left). Just because the first white circle failed in its bullish push, doesn’t mean it didn’t achieve momentum that would later on help to push the price up.
3. The Lower levels of the Heat Map are turning Yellow/Orange/Red (60-100 MFI): It occurred somewhat in the left white circle, but mainly in the right white circle. This shows us the MFI is very high on the lower lengths, this may lead to the current, middle and higher length MFIs following suit soon. Remember it has to work its way up, the higher levels can’t go red unless the lower levels go red first and the higher levels can also lag quite a bit behind and take awhile to catch up, this is normal, expected and meant to happen. Vice versa is also true with getting higher levels to go cold (light teal (think of ICE)).
4. The Upper Levels of the Heat Map are still Light Blue - Green (10-50 MFI): You might think at first that this is a bad thing, but it's not! Remember you want to be Fearful when others are Greedy and Greedy when others are Fearful! You don’t want to buy when the higher levels have a high MFI, you want to buy when you see the momentum pushing up in the lower MFI levels (getting yellow/orange/red in the low levels) while it is still Cold in the higher levels (BLUE OR GREEN, nothing higher than green as it is already slightly too high). There will be many times that it is Yellow or possibly Orange in the high levels and the bullish push still happens, but this is much more risky! The key to trading is to minimize risks while maximizing potential.
Hopefully now you’re getting an idea of how to spot potential bullish momentum changes, but what about bearish momentum changes? Technically they are the exact opposite, so we don’t need to go into as much detail, but lets still take a look at a few examples:
In the example above we marked the 3 times where it was displaying overly bullish characteristics. We marked the bullish momentum occurring with arrows. If you look closely at the start of the arrow to where it finishes, you’ll notice how the heat (HOT)(RED) works its way up from the lower levels to the higher levels. We then see the MFI to SMA cross under. In all 3 of these examples the heat made it all the way to the top of the chart. These are all very bearish signals that represent a bearish momentum movement that may occur soon.
Also, please note, the level the MFI is at DOES matter! That line isn’t there simply for you to see when there are crosses over and under. The MFI is considered to be Overbought when it is greater than 70 (the upper white dashed line, it is just formatted to be on a different scale cause there are 28 plots, but it represents 70). The MFI is considered to be Oversold when it is less than 30 (the lower white dashed line).
If we look to the left a little here where a big drop in price occurred shortly after our MFI and SMA crossed, would we have been able to identify it using the Heat Maps? Likely, No. There was some color change in the lower levels a few bars prior that went yellow/orange/red but before this cross happened they all went back to Dark Blue. In the middle section when the cross happened it was only Green and Yellow and in the upper section we are Blue. This would be a very risky trade to go on as the only real Bearish Indication was the MFI to SMA cross under. Remember, you want to reduce risk, you don’t want to simply trade on everytime the MFI and SMA cross each other or you’ll be getting yourself into many risky trades based on false signals.
Based on what you’ve learned above, can you see the signs that are indicating where this white circle may have potential for a bullish momentum change?
Now that we are more zoomed in, you may also be noticing there are colors to the price bars. This can be disabled in the settings, but just so you know what they mean, let’s zoom in a little more and talk about it.
We’ve condensed the Indicator a bit so you can see the bars better here. The colors that are displayed on these bars are the Heat Map value for your MFI (the white line in the Indicator). This way you can better see when the Price is Hot and Cold. As you may see while looking, the colors generally go from cold to hot when bullish momentum is happening and hot to cold when bearish momentum is happening. We don’t recommend solely looking at the bars as indicators to MFI momentum change, as seeing the Heat Map will give you much more data; however it can be nice to see the Heat Map projected on the bars rather than trying to eyeball it yourself or hover over each bar specifically to see their levels.
We will conclude our Tutorial here. Hopefully this has given you some insight to how useful Heat Maps can be and why it works well with a Machine Learning (KNN) Model applied to the MFI.
PLEASE NOTE: You can adjust the line width for the Heat Map within the settings. If you condense the Indicator a lot or have a small screen, likely use a length of 1-2. If you have it stretched out or a large screen, a length of 2-3 will work nice. You just don’t want to have the lines overlapping or it defeats the purpose of a Heat Map. Also, the bigger the linewidth, generally you’ll want to increase the Transparency within the Settings also as it can get quite bright and hurt your eyes over time.
Settings:
MFI:
Show MFI and SMA Crossing Signals: MFI and SMA Crossing is one of the leading Bullish and Bearish Signals in this Indicator. You can also add alerts for these signals.
Plot Amount: How many plots are used in this Heat Map. (2 - 28).
Source: The Source to use in all MFI calculations.
Smooth Initial MFI Length: How much to smooth the Fast and Slow MFI calculation by. 1 = No smoothing.
MFI SMA Length: What length we smooth the MFI Average over to get our MFI SMA.
Machine Learning:
Average MFI data by adding a lookback to the Source: While populating our Heat Map with the MFI's, should use use the Source each MFI Length increase or should we also lookback a Source each MFI Length Increase.
KNN Distance Requirement: To be a valid KNN, it needs to abide by a Distance calculation. Generally only Max is used, but you can change it if it suits your trading style better.
Machine Learning Length: How much ML data should we store? The longer the length generally the smoother the result; which may not be as accurate for something like a Heat Map, so keeping this relatively low may lead to more accurate results.
KNN Length: How many KNN are used in the slice to calculate max/min distance allowed.
Fast Length: Fast MFI length used in KNN to calculate distances by comparing its distance with the Slow MFI Length.
Slow Length: Slow MFI length used in KNN to calculate distances by comparing its distance with the Fast MFI Length.
Smoothing Length: When populating our Heat Map, at what length do we start our MFI calculations with (A Higher value with result in a slower and more smoothed MFI / Heat Map).
Colors:
Change Bar Color: Change bar colors to MFI Avg Color.
Heat Map Transparency: If there isn't any transparency it can be a little hard on the eyes. The Greater the Line Width, generally the more transparency you'll want for your eyes.
Line Width: Set how wide the Heat Map lines are
MFI 90-100 Color: Color when the MFI is between these levels.
MFI 80-89 Color: Color when the MFI is between these levels.
MFI 70-79 Color: Color when the MFI is between these levels.
MFI 60-69 Color: Color when the MFI is between these levels.
MFI 50-59 Color: Color when the MFI is between these levels.
MFI 40-49 Color: Color when the MFI is between these levels.
MFI 30-39 Color: Color when the MFI is between these levels.
MFI 20-29 Color: Color when the MFI is between these levels.
MFI 10-19 Color: Color when the MFI is between these levels.
MFI 0-100 Color: Color when the MFI is between these levels.
If you have any questions, comments, ideas or concerns please don't hesitate to contact us.
HAPPY TRADING!

Zaree - RSI Gradient FillDescription:
The "Zaree - RSI Gradient Fill" (RGF) indicator is a technical analysis tool designed to enhance the interpretation of the Relative Strength Index (RSI) by incorporating visual cues through gradient fill. This indicator aids traders in identifying potential overbought and oversold conditions in the market using the RSI as a key reference.
Details of the Indicator:
The indicator calculates the RSI of a selected source based on user-defined settings for length and source.
Traders have the option to choose from various types of moving averages (SMA, EMA, SMMA, WMA) to calculate the RSI.
RSI values and their corresponding moving average values are plotted on the chart for visual analysis.
The indicator offers customization through input settings for RSI length, RSI source, and moving average type and length.
Upper and lower bands for the RSI are displayed on the chart, providing visual cues for potential overbought and oversold conditions.
A center line is plotted on the chart to help traders identify the equilibrium point of the RSI.
The gradient fill feature enhances the visualization by coloring the space between the RSI plot and the center line based on RSI levels.
How to Use the Indicator:
Specify the RSI length and source for calculation.
Choose the desired moving average type and set the length for the moving average.
Observe the RSI values, moving average lines, and the center line plotted on the chart.
Pay attention to the position of the RSI values relative to the upper and lower bands. Values above the upper band suggest potential overbought conditions, while values below the lower band indicate potential oversold conditions.
Interpret the gradient fill between the RSI plot and the center line. The color changes provide additional visual cues about the RSI's strength compared to the center line.
Example of Usage:
As an experienced swing trader, you can leverage the RGF indicator to fine-tune your trading decisions. Here's an example of how you might use the indicator:
Select your preferred RSI length and source, such as the closing price.
Choose "SMA" as the moving average type and set the length to 14.
Observe the RSI values plotted on the chart along with the upper and lower bands.
Pay special attention to the gradient fill between the RSI plot and the center line. This coloring offers valuable insights into the RSI's position relative to equilibrium.
Look for instances where the RSI values cross above or below the upper and lower bands. These crossings can signal potential trend shifts or reversals.
Use the gradient fill colors to quickly assess the strength of the RSI's deviation from the center line.
Remember that the RGF indicator is a powerful tool to complement your trading strategy. Consider combining its insights with other technical and fundamental analyses for well-informed trading decisions.
Feel free to adjust the indicator settings according to your trading preferences and style. While the RGF indicator provides valuable visual cues, always consider the broader context of the market before making trading choices.

Zaree - FX Index RSI IndicatorDescription:
The "Zaree - FX Index RSI Indicator" (FIRI) is a technical analysis tool designed to provide insights into the relative strength of two selected currency indices using the Relative Strength Index (RSI). It allows traders to compare the RSI values of a primary currency index and a secondary currency index, helping them identify potential overbought and oversold conditions in the currency market.
Details of the Indicator:
The indicator calculates the RSI for both the primary and secondary currency indices based on the user's selections.
Traders can choose from a variety of currency indices to use as the primary and secondary indices for comparison.
The indicator offers settings for customizing the calculation of the RSI, including selecting the type of moving average (SMA, EMA, WMA, SMMA) and adjusting the length of the RSI and moving average.
Upper and lower RSI bands are displayed on the chart to highlight potential overbought and oversold conditions.
The RSI values and their corresponding moving average values are plotted on the chart, allowing traders to visually analyze the relative strength of the indices.
How to Use the Indicator:
Select the primary and secondary currency indices you want to compare from the provided dropdown menus. These indices will serve as the basis for RSI calculation.
Choose the type of moving average (SMA, EMA, WMA, SMMA) to use for RSI calculation and set the desired length for the moving average.
Decide whether you want to visualize the RSI and moving average values for the primary and secondary indices on the chart.
Observe the RSI values and moving averages plotted on the chart. The indicator's upper and lower bands can help you identify potential overbought (above the upper band) and oversold (below the lower band) conditions.
Pay attention to the intersections between the RSI values and the moving average lines. These intersections can provide insights into potential trend changes or reversals in the currency market.
Example of Usage:
Let's say you're a swing trader focusing on currency pairs involving the US Dollar (USD) and Euro (EUR). You want to compare the relative strength of the USD Index (USDINX) and the EUR Index (EURINX) to identify potential trading opportunities. Here's how you can use the FIRI indicator:
Select "USDINX" as the primary index and "EURINX" as the secondary index.
Choose "SMA" as the moving average type and set the RSI length to 14.
Enable the visualization of RSI values for both the primary and secondary indices.
Observe the chart to identify instances where the RSI values of the indices cross above the upper band (potential overbought) or below the lower band (potential oversold).
Look for intersections between the RSI values and the moving average lines. A bullish signal may occur when the RSI crosses above the moving average, indicating potential upward momentum, while a bearish signal may occur when the RSI crosses below the moving average, indicating potential downward momentum.
Remember that the FIRI indicator is a tool to assist you in your analysis. It's important to consider other technical and fundamental factors before making trading decisions.
Feel free to adjust the settings of the indicator based on your trading preferences and strategy. Keep in mind that no indicator is foolproof, and it's recommended to use the FIRI indicator in conjunction with other analysis techniques for a comprehensive trading approach.

Zaree - FX Index Spread IndicatorDescription:
The "Zaree - FX Index Spread Indicator" (FISI) is a powerful technical analysis tool designed to provide insights into the spread between two selected currency indices. By calculating and visualizing the percentage difference between the values of a primary and a secondary currency index, traders can gain valuable information about potential market dynamics and trends.
Details of the Indicator:
The indicator calculates the spread percentage between a primary and a secondary currency index, allowing traders to understand the relative strength of the two indices.
Traders can choose from a list of currency indices to use as the primary and secondary indices for comparison.
The indicator offers multiple methods for setting thresholds to identify potential trading opportunities, including standard deviations, percentile ranks, historical highs and lows, and fixed thresholds.
Users can customize the length of the calculation period and choose whether to display the primary index, secondary index, and the spread percentage on the chart.
Shaded areas on the chart indicate regions where the spread percentage is above or below predefined thresholds, helping traders identify potential trading signals.
How to Use the Indicator:
Select the primary and secondary currency indices you want to compare from the provided dropdown menus. These indices will be used to calculate the spread percentage.
Choose the method for setting thresholds by selecting one of the options: "Standard Deviations," "Percentile Ranks," "Historical Highs and Lows," or "Fixed Thresholds."
Depending on the selected method, configure the relevant threshold parameters, such as historical threshold percentage, upper and lower fixed thresholds, upper and lower percentile thresholds, or the standard deviation multiplier.
Choose whether to visualize the primary index, secondary index, and spread percentage on the chart by enabling the respective options.
Observe the chart to identify potential trading signals based on the interactions between the spread percentage and the predefined thresholds.
Example of Usage:
Suppose you're interested in trading currency pairs involving the US Dollar (USD) and Euro (EUR), and you want to monitor the spread between the USD Index (USDINX) and the EUR Index (EURINX). Here's how you can use the FISI indicator:
Select "USDINX" as the primary index and "EURINX" as the secondary index.
Choose the method for setting thresholds based on your strategy. For instance, you can select "Standard Deviations" and adjust the standard deviation multiplier.
Enable the visualization of the primary index, secondary index, and spread percentage on the chart.
Observe the shaded areas on the chart. If the spread percentage crosses above the upper threshold, it may indicate a potential market overextension. Conversely, if the spread percentage crosses below the lower threshold, it could suggest an oversold market condition.
Look for instances where the spread percentage approaches or crosses the predefined thresholds. Consider these instances as potential entry or exit points for your trades.
Remember that the FISI indicator is a tool to assist you in your analysis. It's recommended to combine its insights with other technical and fundamental factors before making trading decisions. Adjust the indicator settings and thresholds based on your trading strategy and preferences.
As with any trading tool, practice and observation are key. Over time, you can refine your trading strategy by analyzing historical data and observing how the indicator performs in different market conditions.
Feel free to experiment with different settings and methods to find the configuration that aligns best with your trading style and goals.
RSI Exponential Smoothing (Expo)█ Background information
The Relative Strength Index (RSI) and the Exponential Moving Average (EMA) are two popular indicators. Traders use these indicators to understand market trends and predict future price changes. However, traders often wonder which indicator is better: RSI or EMA.
What if these indicators give similar results? To find out, we wanted to study the relationship between RSI and EMA. We focused on a hypothesis: when the RSI goes above 50, it might be similar to the price crossing above a certain length of EMA. Similarly, when the RSI goes below 50, it might be similar to the price crossing below a certain length of EMA.
Our goal was simple: to figure out if there is any connection between RSI and EMA.
Conclusion: Yes, it seems that there is a correlation between RSI and EMA, and this indicator clearly displays that relationship. Read more about the study here:
█ Overview of the indicator
The RSI Exponential Smoothing indicator displays RSI levels with clear overbought and oversold zones, shown as easy-to-understand moving averages, and the RSI 50 line as an EMA. Another excellent feature is the added FIB levels. To activate, open the settings and click on "FIB Bands." These levels act as short-term support and resistance levels which can be used for scalping.
█ Benefits of using this indicator instead of regular RSI
The findings about the Relative Strength Index (RSI) and the Exponential Moving Average (EMA) highlight that both indicators are equally accurate (when it comes to crossings), meaning traders can choose either one without compromising accuracy. This empowers traders to pick the indicator that suits their personal preferences and trading style.
█ How it works
Crossings over/under the value of 50
The EMA line in the indicator acts as the corresponding 50 line in the RSI. When the RSI crosses the value 50 equals when Close crosses the EMA line.
Bouncess from the value 50
In this example, we can see that the EMA line on the chart acts as support/resistance equals when RSI rejects the 50 level.
Overbought and Oversold
The indicator comes with overbought and oversold bands equal when RSI becomes overbought or oversold.
█ How to use
This visual representation helps traders to apply RSI strategies directly on the price chart, potentially making RSI trading easier for traders.
-----------------
Disclaimer
The information contained in my Scripts/Indicators/Ideas/Algos/Systems does not constitute financial advice or a solicitation to buy or sell any securities of any type. I will not accept liability for any loss or damage, including without limitation any loss of profit, which may arise directly or indirectly from the use of or reliance on such information.
All investments involve risk, and the past performance of a security, industry, sector, market, financial product, trading strategy, backtest, or individual's trading does not guarantee future results or returns. Investors are fully responsible for any investment decisions they make. Such decisions should be based solely on an evaluation of their financial circumstances, investment objectives, risk tolerance, and liquidity needs.
My Scripts/Indicators/Ideas/Algos/Systems are only for educational purposes!

MACD & RSI Overlay (Expo)█ Overview
The MACD & RSI Overlay (Expo) trading indicator is a technical analysis tool that combines two popular indicators, the Relative Strength Index (RSI ) and the Moving Average Convergence Divergence (MACD ), and overlays them onto the price chart. The indicator oscillates relative to price, so it plots the RSI and MACD around price while still displaying the same insights as the regular MACD and RSI indicators. This feature gives traders a unique perspective, allowing them to see the relationship between price, momentum, and trend in a single chart.
This indicator is a valuable addition to any trader's technical analysis toolkit, whether they are a beginner or an experienced trader.
█ MACD
█ RSI
The RSI comes with overbought and oversold areas, which can be set by the trader.
█ MACD & RSI
█ Trend Feature
What sets the MACD & RSI Overlay indicator apart is its ability to factor in the underlying trend. This feature makes the indicator more useful than ever before, as traders can use it to filter trades in the direction of the trend. By considering the underlying trend, traders can gain valuable insights into market trends.
█ Benefits
One of the primary benefits of having the MACD and RSI plotted directly on the price chart is that it provides a more intuitive understanding of the relationship between price, momentum, and trend. Traders can quickly identify the direction of the trend by observing the price movement relative to the MACD and RSI lines. In addition, by having these indicators plotted on the chart, traders can quickly identify potential buy and sell signals and develop new trading strategies.
█ How to use
One of the most popular strategies is to use the MACD & RSI Overlay indicator to look for crossings. A crossing occurs when the MACD and RSI lines cross over each other or when they cross over the signal line. These crossings can signal potential trend reversals and momentum shifts. For example, if the MACD line crosses over the signal line from below, it could indicate a bullish signal, while a cross from above could indicate a bearish signal.
-----------------
Disclaimer
The information contained in my Scripts/Indicators/Ideas/Algos/Systems does not constitute financial advice or a solicitation to buy or sell any securities of any type. I will not accept liability for any loss or damage, including without limitation any loss of profit, which may arise directly or indirectly from the use of or reliance on such information.
All investments involve risk, and the past performance of a security, industry, sector, market, financial product, trading strategy, backtest, or individual's trading does not guarantee future results or returns. Investors are fully responsible for any investment decisions they make. Such decisions should be based solely on an evaluation of their financial circumstances, investment objectives, risk tolerance, and liquidity needs.
My Scripts/Indicators/Ideas/Algos/Systems are only for educational purposes!
Catching the Bottom (by Coinrule)This script utilises the RSI and EMA indicators to enter and close the trade.
The relative strength index (RSI) is a momentum indicator used in technical analysis. RSI measures the speed and magnitude of a security's recent price changes to evaluate overvalued or undervalued conditions in the price of that security. The RSI is displayed as an oscillator (a line graph) on a scale of zero to 100. The RSI can do more than point to overbought and oversold securities. It can also indicate securities that may be primed for a trend reversal or corrective pullback in price. It can signal when to buy and sell. Traditionally, an RSI reading of 70 or above indicates an overbought situation. A reading of 30 or below indicates an oversold condition.
An exponential moving average (EMA) is a type of moving average (MA) that places a greater weight and significance on the most recent data points. The exponential moving average is also referred to as the exponentially weighted moving average. An exponentially weighted moving average reacts more significantly to recent price changes than a simple moving average simple moving average (SMA), which applies an equal weight to all observations in the period.
The strategy enters and exits the trade based on the following conditions.
ENTRY
RSI has a decrease of 3.
RSI <40.
EMA100 has crossed above the EMA50.
EXIT
RSI is greater than 65.
EMA9 has crossed above EMA50.
This strategy is back tested from 1 April 2022 to simulate how the strategy would work in a bear market and provides good returns.
Pairs that produce very strong results include ETH on the 5m timeframe, BNB on 5m timeframe, XRP on the 45m timeframe, MATIC on the 30m timeframe and MATIC on the 2H timeframe.
The strategy assumes each order is using 30% of the available coins to make the results more realistic and to simulate you only ran this strategy on 30% of your holdings. A trading fee of 0.1% is also taken into account and is aligned to the base fee applied on Binance.

[ChasinAlts] RSI (Time-Spent) Count[MO]// Hello fellow traduers, hope all is well in your neck of the woods. Anywho, I'll attempt to be short and sweet.
// I've been doing a LOT of work recently with RSI to figure out what its all about and to learn the ins and outs.
// Some great ideas (I think at least) have come to fruition from the deep-dive into RSI, thus, I've got 2 of these ideas
// to share. One notable feature for the RSI is when there is a BULLISH trend, it is VERY likely to stay within the upper
// 2/3rds of the RSI extremes (0-100) and vise-versa for BEARISH trends and the lower 2/3rds of the RSI extremes.
// That is where this script's idea was derived. Now PLEASE, do tell, if you disagree with me (preferably via a cool,
// calm, and collected comment...but hey, that's up to you). Ok, now the script.
//
// What this does is gives you a Bullish and Bearish count for the bars. Bullish Cnt counts up by +1 per every PRINTED bar
// that is above OverSold and vise-versa for the Bearish Cnt and being below OverBought. That does VERY MUCH make it
// possible for both counts to have a high value if RSI is staying between OverBought and OverSold for extended periods
// of time. Though, the ONLY count that will be shown is the one with the highest value.
//
// There are tooltips describing each of the settings but I will quickly talk about 3 more things. First of all, I prefer
// to have as few settings in the settings menu as possible thus the "Boundaries to OB/OS" setting can be viewed as the
// OverSold input and the OverBought setting is configured from this by subtracting "Boundaries to OB/OS" from 100
// (ie. 100-Oversold = OverBought). There Lastly, there is the option to show ONLY the coin with the MAX Count from each
// 'set' of coins. When that count resets to 0 then the next highest count coin will take its place. To use this instead
// of how the script is currently constructed you only need to comment out (add '//' at the beginning of each line of) the current
// plot functions and uncomment the lines at the very bottom under the 'MAX' section. Doing so also reveals the possibility of
// setting an alert for when the coin with the max count changes between different coins. This is very helpful because since it
// only gives the top count of ALL the coins in the selected set, this count is most likely going to continue forward with its
// count for a while thus when the alert goes off I prefer to look at the potential trades in the opposite direction of which
// the max coin was just in (ie. if its count plot/label is red and it stops then look for a potential long trade on the coin
// who's count just reset. Only ONE more piece of the script I have yet to talk about. There is a filter in the code and you
// can select to use or not use within the settings. What this filter does is it counts all the printed bars within the last
// ___bars(user selectable). This is due to the fact that if there is no trade that occurs on a bar then TradingView does not
// print the bar. The coins that have fewer updates also tend to stay within a tighter range for it's RSI thus many times
// giving the illusion that the coin is a good trade bc its trending count is very high (tending to be higher than the others)
// thus hogging the precious chart space if using the script in its current form, or hogging up the MAX slot so that no other
// (and most likely BETTER-TO-TRADE) coins will be shown. It is a great volatility indicator (that of which I have published
// a script using the idea in the recent past). If selected in the settings menu and if the % of printed bars count goes below
// the user set minimum % then both Bullish and Bearish counts will be reset. This is indicated within the counts plots by looking
// at the plots whose counts reset and rather than the plots just stopping printing in mid-air, they will continue to plot while the
// counts reset and fall down to 0. These types of coins will keep you in a trade longer that you'd probably want gaining less than
// you'd probably expect.
//
// Peace Folks & Happy Trading,
//
// ChasinAlts

Yasir Hameed Advance RSI IndicatorRELATIVE STRENGTH INDEX ( RSI )
This is a tool that is widely used
Especially for Overbought and Oversold systems, but I have made some changes in this indicator,
How to use it...!
I have set it as the default setting
- RSI Length: 7
- Overbought: 70
- Oversold: 30
What is unique about this tool?
we can see 3 conditions:
1) RSI Overbought / Oversold with Bullish Engulfing / Bearish Engulfing
2) RSI Overbought / Oversold with Hammer and Shooting Star
3) RSI Overbought / Oversold with 2 Bullish Bars / 2 Bearish Bars
4) RSI Overbought / Oversold with All Patterns at the same time
When the RSI reaches its Oversold line, the code will wait for Bullish Engulfing pattren, when oversold and Bullish engulfing matched, This indicator will generate a buy signal when the condition is met,
and same as for Bear market, When the RSI reaches its Overbought line, the code will wait for Bearish Engulfing pattren, This indicator will generate a sell/exit signal when the condition is met,
2nd condition is that a Hammer candle will be waited for when RSI touches the Overbought line, for Bullish Move
and Shooting Star candle will be waited for when RSI touches the Overbought line, for Bullish Move, for Bearish Move
3rd Condition is also the same as Condition 1 and Condition 2,
When the RSI reaches its Oversold line, the code will wait for 2 Bullish Bars, when oversold and 2 Bullish Bars matched then this indicator will generate a buy signal, and same as for Bear market,
When the RSI reaches its Overbought line, the code will wait for 2 Bearish Bars, when overbought and 2 Bearish Bars matched then this indicator will generate a Sell signal,
4th Condition is that we can use All Conditions at the same time,
- Bullish Engulfing / Bearish Engulfing
- Hammer and Shooting Star
- 2 Bullish Bars / 2 Bearish Bars

Variety RSI of Adaptive Lookback Averages [Loxx]Variety RSI of Adaptive Lookback Averages uses an adaptive lookback algorithm in order to determine dynamic length inputs to get used to smooth the input price source before calculating your choice of 6 different types of RSI. This ALB algorithm counts bars back until X many swing counts are reached.
Included:
Bar coloring
2 signal variations w/ alerts
Oversold RSI with tight SL Strategy (by Coinrule)This is one of the best strategies that can be used to get familiar with technical indicators and start to include them in your trading bot rules.
ENTRY
1. This trading system uses the RSI ( Relative Strength Index ) to anticipate good points to enter positions. RSI is a technical indicator frequently used in trading. It works by measuring the speed and change of price movements to determine whether a coin is oversold (indicating a good entry point) or overbought (indicating a point of exit/entry for a short position). The RSI oscillates between 0 and 100 and is traditionally considered overbought when over 70 and oversold when below 30.
2. To pick the right moment to buy, the strategy enters a trade when the RSI falls below 30 indicating the coin is oversold and primed for a trend reversal.
EXIT
The strategy then exits the position when the price appreciates 7% from the point of entry. The position also maintains a tight stop-loss and closes the position if the price depreciates 1% from the entry price. The idea behind this is to cut your losing trades fast and let your winners ride.
The best time frame for this strategy based on our backtesting data is the daily. Shorter time frames can also work well on certain coins, however in our experience, the daily works best. Feel free to experiment with this script and test it on a variety of your coins! With our backtesting data a trading fee of 0.1% is taken into account. The fee is aligned to the base fee applied on Binance, which is the largest cryptocurrency exchange by volume. In the example shown, this strategy made a handsome net profit of 39.31% on Chainlink with 61.54% of trades being profitable.

Spot [FTX] [Moto]Hello traders,
This indicator was primarily designed to show the dominating influence of the underlying spot asset while trading perpetual futures , specifically on FTX.
IMPORTANT: In order for this indicator to work properly/accurately you must be observing an FTX Perpetual future chart. The indicator detects which perpetual future symbol you're observing and changes its comparative metrics accordingly. If you're observing some other chart family, it will either be inaccurate or show nothing.
In my opinion spot price and metrics are more important to observe than derivatives. If I'm looking for entries or exits I want to know that spot is leading the way, and with evidential conviction. This indicator/signal is designed to be used in context and not to be the sole metrics observed. By comparing the spot chart metrics and the respective spot chart metrics, one is able to ascertain which candles are predominantly 'lead' or dominant via spot price action or conversely derivative lead. Generally, I've found, derivative lead moves have a highly likelihood of reverting
1) Spot engulfing - When spot has exerted control successfully on the current candlestick
This and other plot shapes contain plot shape sizing options and are optionally filtered via the cycled Rsi in the inputs
Smaller plot shapes (auto-sized) show when the candle is spot influenced, but not engulfing .
2) Spot Candle reversals - "E" and "e" plot shapes
These signals are sequential engulfing and opposing candles. "E" being when sequential engulfing candles print, "e" forms when spot candles are sequential, opposing, but not engulfing .
3) Bear / Bull Sequences: "Strong" / "Weak" plot shapes
These signals are looking for a Rsi mid-line (50) 'bounce' among the last four candles on the observed time frame. For example, this will give a signal when the rsi is above, below, below, and back above the 50 on the cycled Rsi .
4) "Prox" plot shapes - "p" and "P"
These plot shapes are purely based on Rsi and the confluence between two time frames. Signals occur when the low time frame and high time frame are near the 50 line of their respective Rsi but on opposing sides. There are two sets of these, comprising two different (optional) times frames each. Essentially these signals are to point out potential places of cascade in either direction. If however the market decides to "save" price, action can continue or perhaps violently push in the opposite direction. Consider them warnings to either follow or take advantage of. "P" plots indicate the lower time frame set, while "Prox" indicate the higher time frame signals. These signals can be optionally filtered by Rsi-Vwap directional bias, i.e above or below its "normal" range.
5) Exceptional spot reversals, 'X' and '+'
These plots show when spot sells immediately after buying and outside of the momentum bias. i.e spot selling immediately after spot buying when Rsi > 50.
6) Bar-coloring is provided on the more important signals
7) Alerts for almost all of the aforementioned metrics are included
Thanks,
DM for access
If the indicator throws an error, it's likely due to a newer ticker not being called in the script. I will update this periodically, or upon polite request.

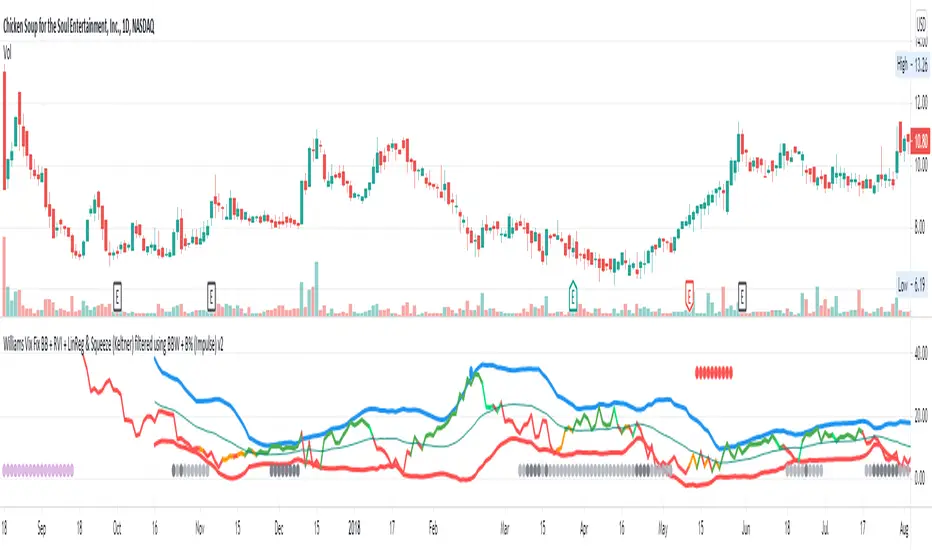
Williams Vix Fix BB + RVI + LinReg & Squeeze (Keltner) BBW + %BLegend:
Entery signal: When line color turns to lime (lighter green) after a blue dot appears
Exit signal: When line color turns to red (darker red) after a red dot appears
Note: it is more affective as an entry signal (Bottom is stronger)
- When line touches or crosses red band it is Top signal (Williams Vix Fix)
- When line touches or crosses blue band it is Bottom signal (Williams Vix Fix)
- Red dot at the top of indicator is a Top signal (Relative Volatility Index)
- Blue dot at the top of indicator is a Bottom signal (Relative Volatility Index)
- Gray dot at the bottom of indicator is a Keltner Squeeze signal (filtered by either BBW or %B)
- Silver dot at the bottom of indicator is a weaker Keltner Squeeze signal (Doesn't meet either BBW or %B filter)
- Purple is a 'Half Squeeze' only 1 Bollinger Band crossed the Keltner Channel
This is an attempt to make use of the main features of all 6 of these Volatility tools:
- Williams Vix Fix + Bollinger Bands
- Relative Volatility Index (RVI)
- Linear Regression (detects Vix Fix starts to rise or fall to a certain degree in order to help validate bottom/top)
Note : There is also added precision on Linear Regression entry by dividing WVF by square roots of basis.
- The crossing of Keltner Channel by the Bollinger Bands (Squeeze)
Conditions to Help Filter Keltner Squeeze:
- When the Bollinger Bands Width (BBW) value is lower than the lowest value within a period plus a margin of error (percentage)
- When the %B value goes up or down by the impulse value (threshold value in setting) detailed in LazyBears indicator. (www.tradingview.com)
If it meets one of these 2 filters and there is a Keltner Channel Squeeze than gray color or else if the squeeze doesn’t meet one of the 2 filters than silver color (weaker Squeeze).
The goal is to find the best tool to find bottoms and top relative to volatility and filter squeeze.
Note: You can also change the threshold for RVI top and bottom.
And this work builds on my last indicators:
- Williams Vix Fix + BB & RVI (Top/Bottom) & Squeeze ()
- Williams Vix Fix BB + RVI & Squeeze (Keltner) filtered BBW + %B ()
If you have ideas on this work or have ideas on potential combinations please message me, I always want to learn or get perspective on how it can be improved.
Sharing is how we get better (Parameter tuning, ideas, discussion)
I don’t reinvent the wheel, just trying to make the wheel better.
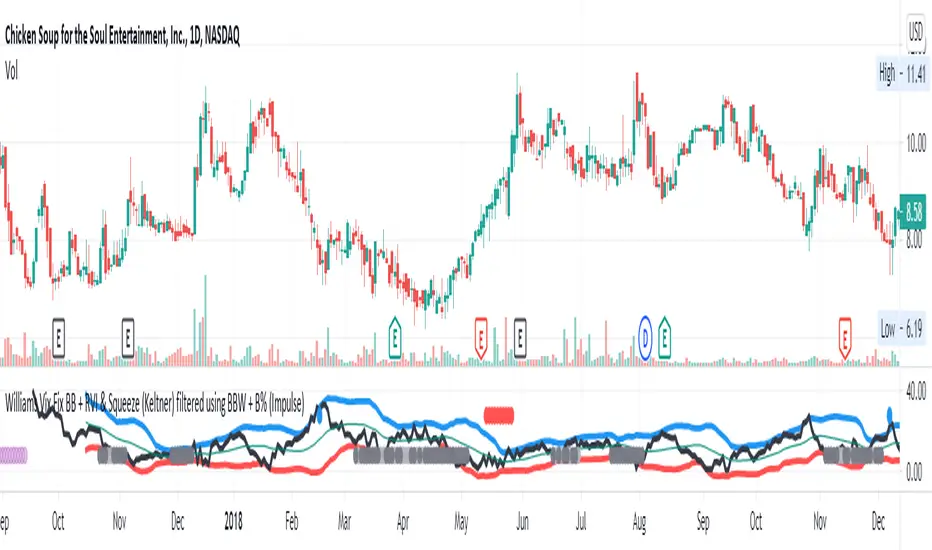
Williams Vix Fix BB + RVI & Squeeze (Keltner) filtered BBW + %BLegend:
- When line touches or crosses red band it is Top signal (Williams Vix Fix)
- When line touches or crosses blue band it is Bottom signal (Williams Vix Fix)
- Red dot at the top of indicator is a Top signal (Relative Volatility Index)
- Blue dot at the top of indicator is a Bottom signal (Relative Volatility Index)
- Gray dot at the bottom of indicator is a Keltner Squeeze signal (filtered by either BBW or %B)
- Silver dot at the bottom of indicator is a weaker Keltner Squeeze signal (Doesn't meet either BBW or %B filter)
- Purple is a 'Half Squeeze' only 1 Bollinger Band crossed the Keltner Channel
This is an attempt to make use of the main features of all 6 of these Volatility tools :
- Williams Vix Fix + Bollinger Bands
- Relative Volatility Index (RVI)
- The crossing of Keltner Channel by the Bollinger Bands (Squeeze)
Conditions to Help Filter Keltner Squeeze:
- When the Bollinger Bands Width (BBW) value is lower than the lowest value within a period plus a margin of error (percentage)
- When the %B value reaches the alert level detailed in LazyBears indicator. ()
If it meets one of these 2 filters and there is a Keltner Channel Squeeze than gray color or else if the squeeze doesn’t meet one of the 2 filters than silver color (weaker Squeeze).
The goal is to find the best tool to find bottoms and top relative to volatility and filter the squeeze.
The idea is that both Williams Vix Fix + Bollinger Bands and Relative Volatility Index both already give the main volatility bottom and top so combining them to compare and validate the signals makes sense. (Note: Bottom signal is more accurate than top). In addition, I added the squeeze to show the potential breakout pressure and to compliment bottom and top signals.
For ideas on how to continue this work :
I encourage ideas to combine the Williams Vix Fix and Relative Volatility Index for volatility top and bottom (with probability would be awesome)
And I encourage ideas to filter Keltner Channel Volatility Squeeze using both the BBW or %B or other volatility squeeze indicators or a combination of all of them.
Also, I encourage people to post their top parameters for the BBW and %B to filter the Keltner Squeeze in the comments or to send me them by chat relative to this indicator.
Half the battle is making the indicator, while the other half is tuning the parameters.
The current parameters are one of the least aggressive, and act as a mild filter.
Note: You can also change the threshold for RVI top and bottom.
And this work builds on my last indicator:
If you have ideas on this work or have ideas on potential combinations please message me, I always want to learn or get perspective on how it can be improved.
Sharing is how we get better (Parameter tuning, ideas, discussion)
I don’t reinvent the wheel, just trying to make the wheel better.
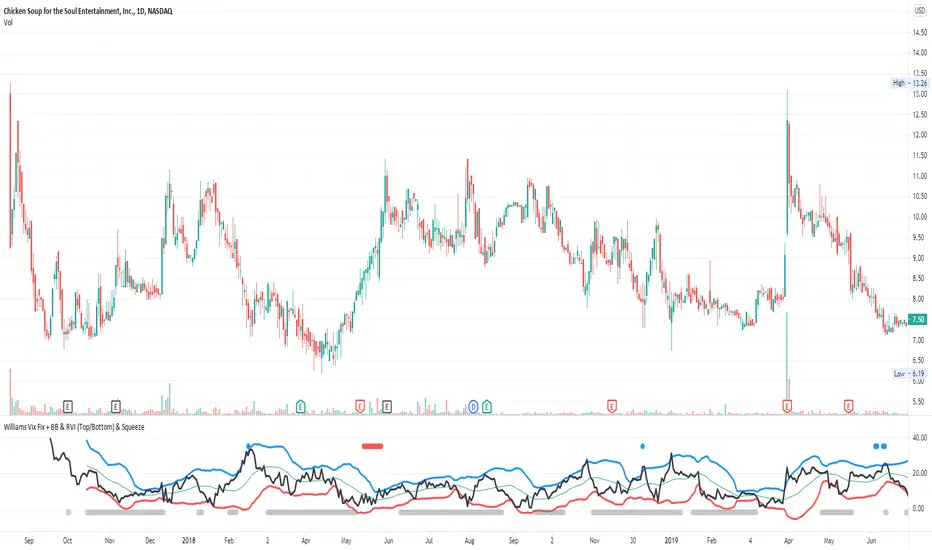
Williams Vix Fix + BB & RVI (Top/Bottom) & SqueezeLegend :
- When line touches or crosses red band it is Top signal (Williams Vix Fix)
- When line touches or crosses blue band it is Bottom signal (Williams Vix Fix)
- Red dot at the top of indicator is a Top signal (Relative Volatility Index)
- Blue dot at the top of indicator is a Bottom signal (Relative Volatility Index)
- Gray dot at the bottom of indicator is a Squeeze signal
This is an attempt to make use of the main features of all 4 of these very popular Volatility tools :
- Williams Vix Fix + Bollinger Bands (as per Larry Williams idea, link )
- Relative Volatility Index (RVI)
- The crossing of Keltner Channel by the Bollinger Bands (Squeeze)
The goal is to find the best tool to find bottoms and top relative to volatility . This is a simple combination, but I find it very useful personally
(no need to reinvent the wheel, just need to find what works best)
The idea is that Williams Vix Fix + Bollinger Bands already give the main volatility bottom and top (Bottom are more accurate).
So instead of trying to modify it, I chose to compliment it by mapping with points when the Relative Volatility Index (RVI) reached the
top/bottom thresholds (red dot means top and blue dot means bottom). That way we can easily see when both indicators find a top or bottom relative
to volatility (of course this needs to be then confirmed with a momentum indicator rally).
In addition, I added the squeeze because this quickly shows the potential breakouts.
For ideas on how to continue this work, it would be very interesting to be able to create a probability of a bottom and top relative to volatility using the
Williams Vix Fix + Bollinger Bands and "Relative Volatility Index" signals as both work well and give top or bottom the other doesn't see.
Combo Backtest 123 Reversal & Relative Volatility Index This is combo strategies for get a cumulative signal.
First strategy
This System was created from the Book "How I Tripled My Money In The
Futures Market" by Ulf Jensen, Page 183. This is reverse type of strategies.
The strategy buys at market, if close price is higher than the previous close
during 2 days and the meaning of 9-days Stochastic Slow Oscillator is lower than 50.
The strategy sells at market, if close price is lower than the previous close price
during 2 days and the meaning of 9-days Stochastic Fast Oscillator is higher than 50.
Second strategy
The RVI is a modified form of the relative strength index (RSI).
The original RSI calculation separates one-day net changes into
positive closes and negative closes, then smoothes the data and
normalizes the ratio on a scale of zero to 100 as the basis for the
formula. The RVI uses the same basic formula but substitutes the
10-day standard deviation of the closing prices for either the up
close or the down close. The goal is to create an indicator that
measures the general direction of volatility. The volatility is
being measured by the 10-days standard deviation of the closing prices.
WARNING:
- For purpose educate only
- This script to change bars colors.

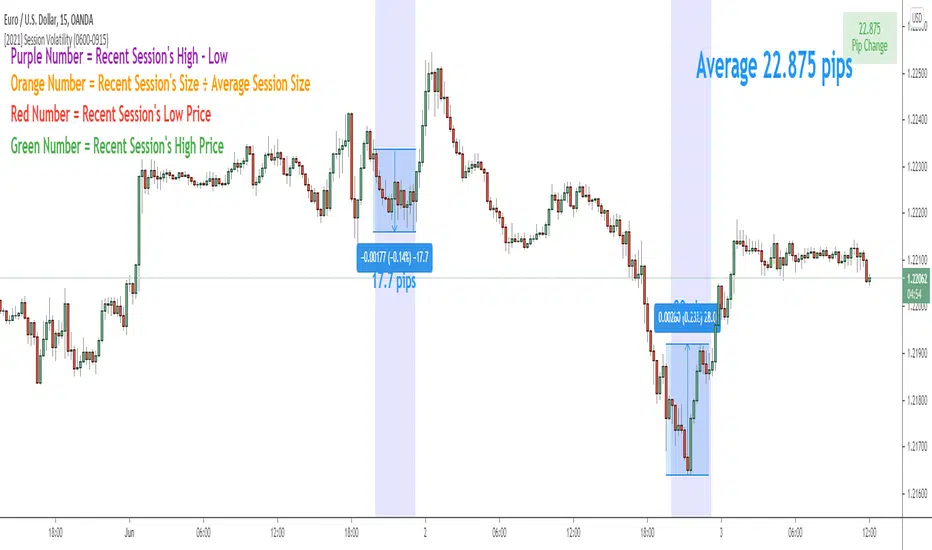
Session Volatility CalculatorHey traders!
This script calculates the average volatility of trading sessions.
You specify a start date, an end date, and a session time (eg. market open, Asian session etc)
The script then scans through all the price action on your chart and calculates the average price movement during that specified period.
What Is It For?
I created this script for my own purposes when developing certain strategies and testing certain ideas.
The purpose of this script is to give you an idea of how much price tends to move during certain times of day for certain markets.
You could think of it as a "session's average true range".
In crypto and forex this might be how much price tends to move on certain pairs during the Australian/Asian session, or the European session, or the overnight U.S. session etc.
In stocks this might be how much a symbol tends to move during the first hour of the day or the last hour of the day.
The point of calculating this information is for better understanding how markets move during certain times of day.
It's not a perfect science obviously since some days can be wilder than others depending on what fundamental events are developing, but it's useful information to have for times when there are no expected volatility-inducing events.
This info can help with optimizing targets and stop loss placement for certain day-trading strategies, and just generally getting an idea of what kinds of moves you might reasonably expect out of overnight positions or certain times of day etc - or at least that's what I use it for.
Settings
Hover your mouse over the "i" symbol to get more information on the script's settings, but here's a brief description:
Start Date: The date to begin calculating from (set to 1000 by default so it scans the entire chart).
End Date: The date to stop calculating (set to 2099 by default so it scans the entire chart)
Time Session: This is the time session during the day that you want to analyze.
Color Background: If turned on, this setting changes the background color to highlight the session.
Indicator Values
The indicator outputs a handful of values onto your chart. This is what the colors correspond to:
Top-Right Box: The average price range during the given time of day over historical price action.
Green Number: The recent session's highest price.
Red Number: The recent session's lowest price.
Purple Number: The recent session's price range (high - low).
Orange Number: The recent session's range ÷ the average (outputs a relative % of the average).
Relative Volatility OscillatorRelative Volatility Oscillator is a volatility based oscillator and works very well on Lower Time Frames on volatile assets. It uses one of five periods (34,55,89,144,233) to calculate relative volatility of the current bar with the volatility trend of one of the 5 periods from the settings, using percentile rank.
Features of Relative Volatility Oscillator
Choice of one of five periods for the Relative Volatility Oscillator plot.
SOS Triangles to indicate Bull/Bear Exhaustion.
Option to plot Volatility Zones. Oscillator Values between -5 and 5 will be plotted using exhaustion colours and can be used to monitor trades closely for trend reversals.
Choice of 3 colour themes including option to plot trend based coloured price bars.
Adaptive Relative StrengthAdaptive Relative Strength shows a line of relative strength with a moving period in relative to Nifty 500 for Indian Market,
by default its 45 days but you can change as per your need or change relative symbol as per your need.
