cATRpillerThis indicator is used to identify range breakouts using an ATR multiplier. My first script, Im sure there are indies out there like this, but this my favorite way to identify breakouts and trends.
Reversal

Combo Backtest 123 Reversal & Elder Ray (Bear Power) This is combo strategies for get a cumulative signal.
First strategy
This System was created from the Book "How I Tripled My Money In The
Futures Market" by Ulf Jensen, Page 183. This is reverse type of strategies.
The strategy buys at market, if close price is higher than the previous close
during 2 days and the meaning of 9-days Stochastic Slow Oscillator is lower than 50.
The strategy sells at market, if close price is lower than the previous close price
during 2 days and the meaning of 9-days Stochastic Fast Oscillator is higher than 50.
Second strategy
Developed by Dr Alexander Elder, the Elder-ray indicator measures buying
and selling pressure in the market. The Elder-ray is often used as part
of the Triple Screen trading system but may also be used on its own.
Dr Elder uses a 13-day exponential moving average (EMA) to indicate the
market consensus of value. Bull Power measures the ability of buyers to
drive prices above the consensus of value. Bear Power reflects the ability
of sellers to drive prices below the average consensus of value.
Bull Power is calculated by subtracting the 13-day EMA from the day's High.
Bear power subtracts the 13-day EMA from the day's Low.
You can use in the xPrice any series: Open, High, Low, Close, HL2, HLC3, OHLC4 and ect...
WARNING:
- For purpose educate only
- This script to change bars colors.

Combo Strategy 123 Reversal & Elder Ray (Bear Power) This is combo strategies for get a cumulative signal.
First strategy
This System was created from the Book "How I Tripled My Money In The
Futures Market" by Ulf Jensen, Page 183. This is reverse type of strategies.
The strategy buys at market, if close price is higher than the previous close
during 2 days and the meaning of 9-days Stochastic Slow Oscillator is lower than 50.
The strategy sells at market, if close price is lower than the previous close price
during 2 days and the meaning of 9-days Stochastic Fast Oscillator is higher than 50.
Second strategy
Developed by Dr Alexander Elder, the Elder-ray indicator measures buying
and selling pressure in the market. The Elder-ray is often used as part
of the Triple Screen trading system but may also be used on its own.
Dr Elder uses a 13-day exponential moving average (EMA) to indicate the
market consensus of value. Bull Power measures the ability of buyers to
drive prices above the consensus of value. Bear Power reflects the ability
of sellers to drive prices below the average consensus of value.
Bull Power is calculated by subtracting the 13-day EMA from the day's High.
Bear power subtracts the 13-day EMA from the day's Low.
You can use in the xPrice any series: Open, High, Low, Close, HL2, HLC3, OHLC4 and ect...
WARNING:
- For purpose educate only
- This script to change bars colors.

LuxAlgo® - Oscillator Matrix™Oscillator Matrix™ is an all-in-one indicator that incorporates 6+ unique components designed for interoperability & confluence with one another to provide a powerful trend following & reversal detection experience.
Users can create various ways to utilize the indicator's features together such as looking for excess money flowing into the market alongside strong reversal signals appearing or getting real-time divergence signals alongside a lack of money flowing into the market to predict upcoming trends.
This indicator is described as an 'Oscillator Matrix' as it's made up of many different components that can create a systematic approach to analyzing markets alone, however, the indicator also can serve as a great secondary piece to a user's primary analysis with or without our other LuxAlgo Premium indicators.
🔶 FEATURES
Below we describe each component of Oscillator Matrix™ in order of each's significance for the most confluent analysis possible.
Money Flow - Easily see the amount of buying or selling liquidity entering the market by analyzing the green & red waves and how they react with their thresholds to achieve further insight. Best to analyze first before considering any signals the indicator can generate.
Thresholds - Dynamic levels that align above/below the Money Flow to show at which level significant buying or selling is actually taking place.
Overflow - Small lighter waves that occur within the Money Flow's display when excess buying or selling activity is occurring to accurately predict upcoming reversals.
Hyper Wave - An oscillator ribbon in green/grey that provides highly reactive trend following signals & powerful divergence detection.
Real-Time Divergences - Real-time divergence labels that appear on the Hyper Wave oscillator's adaptive ribbon. A highly effective approach to a concept that's not typically done for oscillators. Users can also increase the sensitivity of divergences within the settings.
Reversal Signals - Small dots on the upper or lower boundaries represent high frequency points that indicate possible reversals or a warning signal to upcoming larger reversal signals which are indicated separately by the large triangular arrows on the top & bottom of the indicator's panel.
Confluence Zones - Allows the Money Flow & Hyper Wave oscillator to be used together to display easily interpretable shades of bullish & bearish activity. Brighter, more vibrant colors indicate strong bullish or bearish confluence between these 2 features.
Confluence Meter - An optional display at the current bar to easily find the current level of confluence between all features within Oscillator Matrix™ indicated by the arrow pointing to bullish or bearish levels. (Disabled by default)
Generally, we recommend using these features in order from first to last, whereas analyzing components of the Smart Money Flow category prior to considering other features in your analysis is most productive to ensure you find proper confluence alongside any signal that is generated.
🔶 USAGE
In the image below, we can see 5 points of interest to a user analyzing Oscillator Matrix™ based on various different behaviors.
Point 1 : Here we can see a large reversal signal arrow at the bottom of the panel. These signals, like all signals in LuxAlgo Premium & any indicator in general are not meant to be used as buy/sell signals themselves.
What makes this signal particularly more of interest opposed to other reversal signals that may not play out right away is the Money Flow that corresponding as weak. We can tell the Money Flow is weak because it is not near the red threshold level.
This indicates to us that there is not real selling pressure occurring and that the market could easily reverse in these conditions.
Point 2 : In this specific area we can notice the Money Flow in green is moving upwards alongside the green threshold level. This combination indicates a high probability there is a lot of real buying volume coming into the market, opposed to the previous example (point 1) where the Money Flow was not near the threshold level.
We can also notice the Hyper Wave Oscillator is printing a green dot while above the 50 value on Oscillator Matrix™ panel, further indicating a likely bullish impulse to come.
Point 3 : There are multiple indications here showing us the market may potentially be reversing. The most notable being the larger red reversal arrow, however, as we mentioned previously these cannot be used by themselves.
A further indication is that on the Money Flow we can see Overflow has occurred by the lighter small wave that has appeared & is now turning downwards. This indicates that an excess of buyers have come into the market & are likely to be washed out with a move to the downside.
We can see this happen once again about 8 candles later paired with a high frequency reversal signal (red dot) which marked a local high before the larger impulse down.
Point 4 : You can notice during the recent 25 or so candles the high frequency reversal points (green & red dots) have been highly effective for indicating potential local highs & lows in real-time.
There was a previous real-time bullish divergence detected while Money Flow was strongly in the red and this did indicate a small move upwards, however, with the Money Flow still holding in the red, another high frequency reversal dot, and then as the Money Flow begins to decrease further, we see a clean local top detected here at point 4.
Point 5 : As the lower Confluence Zone moved into the bright red, we saw a large move to the downside and a large bullish reversal signal printed in real-time as well.
Just like point 1, we have a very clear indication the selling has stopped as we further analyze the Money Flow is nowhere near it's true Activity Line.
This analysis combined gave us a further indication of a larger reversal which played out with no lag at all as all reversal signals are fully predictive separate from the Hyper Wave oscillator itself, which can be used as a further trend following approach alongside signals & money flow.
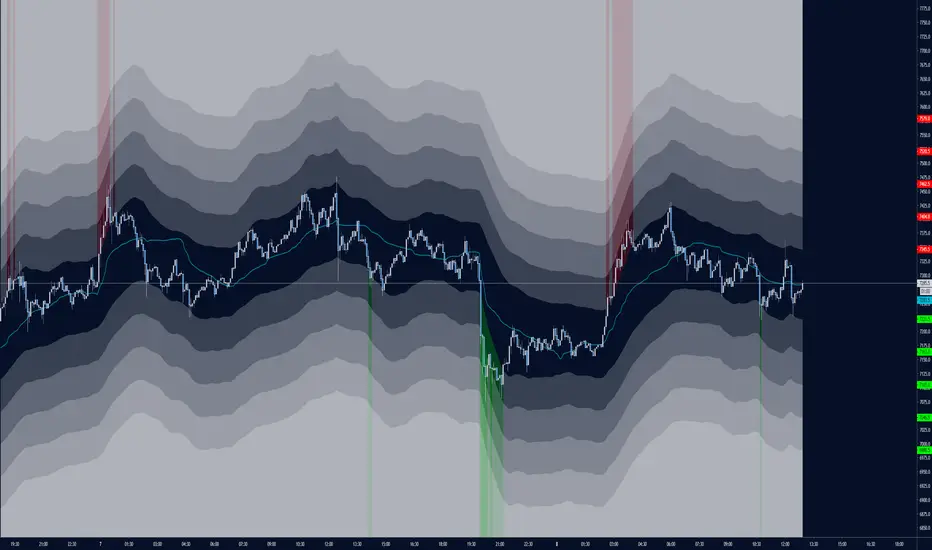
🔶 NAVIGATING MARKET CONDITIONS
In the image above we can see another example with 6 new points of interest marked in green & red shaded areas, all accompanied by a list of possible interpretations of the indicator.
The importance of this usage example is to demonstrate the ability to focus on certain components of the indicator during specific market conditions. For any indicator attempting to catch reversals, trending market conditions will be a detriment to its usability.
The same amount of the components within Oscillator Matrix™ will support trending market conditions as there are components to support ranging market conditions. The indicator further aims to provide clear abilities to detect when the market is likely trending or ranging.
With an understanding of the components within the Smart Money Flow section particularly such as the Overflow & Thresholds, it's possible to develop a more significant understanding of when to consider the market is trending vs when to consider the market may be ranging.
By doing this, we can potentially determine at certain points when to 'filter out' reversal signals or to just consider them merely indications of local tops/bottoms opposed to significant tops/bottoms.
Analyzing a significant Overflow particularly is useful to consider a trend potentially coming to an end. For example, at point 5 in the image above we had a clear downtrend only until there was a very considerable amount of Overflow that begun a real reversal.
We recommend studying the outlined chart above & the list of indications at each shaded area to develop a deep understanding of how to navigate varying market conditions & spot various points of confluence during reversals.
🔶 CONCLUSION & ACCESS
This indicator is an extremely comprehensive approach to an oscillator that allows users to further develop a systematic approach to trading and can be paired great alongside other forms of technical analysis such as our LuxAlgo Signals & Overlays indicator.
Although we believe this indicator to be useful, it's critical to understand that past performance is not necessarily indicative of future results and there are many more factors that go into being a profitable trader.
You can see the Author's instructions below to get instant access to Oscillator Matrix™ & our LuxAlgo Premium suite.

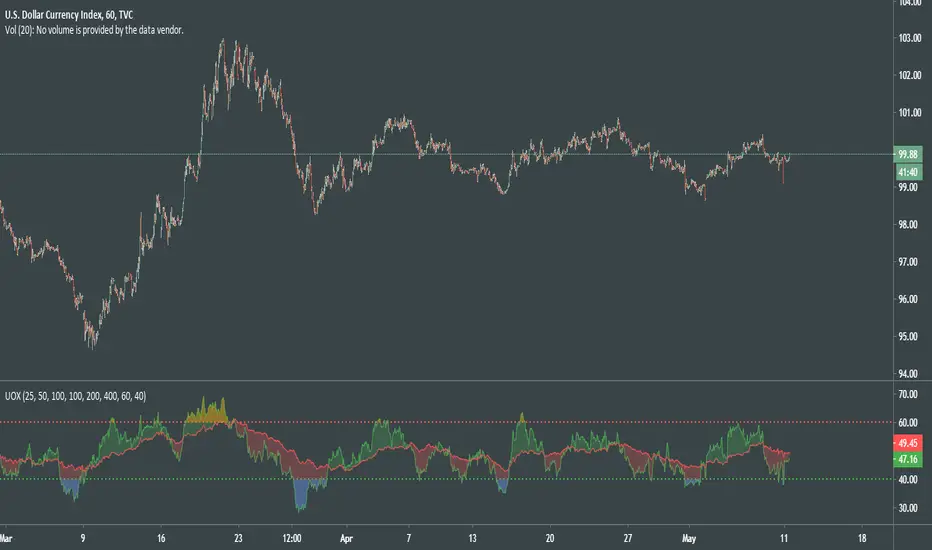
UO CrossThis particular UO Cross is evolved into far more flexible and visually intuitive oscillator than previous versions.
After thorough experiments with the code of indicator, I came to new deductions on how to use it properly for random TF and made it simpler.
How to read a chart using UOX:
Before uptrend takes place, we see the both indicator levels moving towards green dotted line (40).
When green UO index passes below 40, it's an alert that the market is about to interact to new demand levels, coloring it blue for a potential reversal.
Once green UO index is moving up and crossing above green dotted line - the second signal of uptrend established.
Another strong sign of uptrend is when green UO index passes above red UO index, coloring the space in between 2 indicators greenish.
At this point of time, we can be more confident that the general movement of the price is headed upwards, although we might see some small corrections there.
During uptrend Green UO index will fluctuate above red UO index.
Both indices will rise, getting closer and closer to red dotted line, which psychologically would be the first signs of the reversal of the uptrend.
When you see green UO index passing above red dotted line 60, coloring orangish, that's a serious alert for upcoming reversal.
I'll once more remind you that at this point of time both UO indices are at overbought levels, def above 50.
You know the situation is serious when you witness red UO index being very close to red dotted line!
To confirm the signals for downtrend, you must see green UO index go down and passing below red dotted line.
Second confirmation of downtrend is when green UO index crosses below red UO index, and colors the space in between indices red.
With this indicator we can understand:
Condition of the market
Early signs and alerts for reversal
Signals of entry
Confirmations of those signals
Visualized mass psychology behind domination of bulls / bears
It would be much better if you combine it with volume-based indicators.
Good luck!
Candlestick Pattern Detector - Aitch-TThis script detects the following candlestick patterns:
Bullish Patterns:
- Normal 3 Bar Fractal
- Enhanced 3 Bar Fractal
- Engulfing
- Harami ( Inside bar )
- Bullrami (Altenate Bull Harami)
Bearish Patterns:
- Normal 3 Bar Fractal
- Enhanced 3 Bar Fractal
- Engulfing
- Harami ( Inside bar )
- Bearami (Alternate Bear Harami)
- Shooting Star
How it works:
- When you add the script to your chart, green and red dots will appear at the top and the bottom of the chart.
- Red dots at the top of the chart point out the candles that have completed a bearish pattern .
- Green dots at the bottom of the chart point out the candles that have completed a bullish pattern .
How to use:
Use it in conjunction with other analysis tools ( Fibonacci Retracements, Histogram, Willy, RSI , volume , etc) to determine high probability levels.

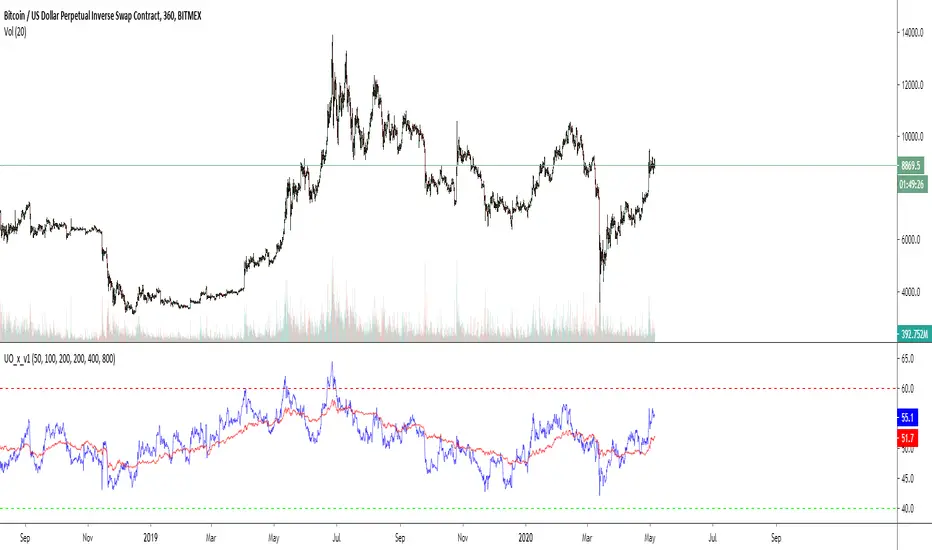
Cross UO v1This is my first script.
I use 2x UO's as a tool to identify the stability and overall condition of a trend.
The UO colored blue is more reactive to price change (candles) than red one, because it takes into account less candles.
The difference in rates of change is a mass mental condition of a market.
The combo might predict the reversals too.
How to read a chart using it?
We'd know the uptrend is stable when Blue UO fluctuates OVER Red UO.
As blue UO reaches red band - it's time for reversal.
To confirm the reversal of an uptrend - Blue UO must cross below Red UO.
During downtrend, the blue and red UOs are reaching green band which would indicate that market is oversold.
Once Blue UO touches green band and crosses above red UO - it's time for downtrend to reverse it's direction.
EMA200 with alerts before touchingInitial version: provide alert when price is in range before it touches ema.
Used for Binary Option to enter rejection from EMA200.
Why Jason200?
It's a legitimate request from Jason Estudillo.

Linear Regression Trend Channel with Entries & AlertsPlease Use this Indicator If you understand the risk posed by linear regression trend channel
Features
Provides trend channel (best value for period is 40 on 5 minute timeframe
Provides BUY/SELL entries based on current channel
Provides custom color for channel
Best used with MattyPips strategy indicators
Risks : Please note, this script is the likes of Bollinger bands and poses a risk of falling in a trend range.
Entries may keep running on the same direction while the market is moving.
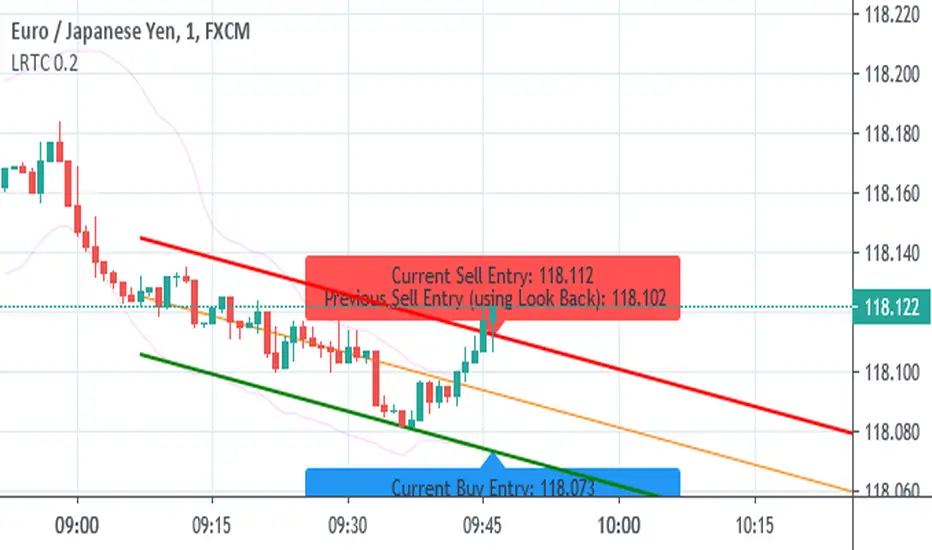
Combo Backtest 123 Reversal & Elder Ray (Bear Power) This is combo strategies for get a cumulative signal.
First strategy
This System was created from the Book "How I Tripled My Money In The
Futures Market" by Ulf Jensen, Page 183. This is reverse type of strategies.
The strategy buys at market, if close price is higher than the previous close
during 2 days and the meaning of 9-days Stochastic Slow Oscillator is lower than 50.
The strategy sells at market, if close price is lower than the previous close price
during 2 days and the meaning of 9-days Stochastic Fast Oscillator is higher than 50.
Second strategy
Developed by Dr Alexander Elder, the Elder-ray indicator measures buying
and selling pressure in the market. The Elder-ray is often used as part
of the Triple Screen trading system but may also be used on its own.
Dr Elder uses a 13-day exponential moving average (EMA) to indicate the
market consensus of value. Bear Power measures the ability of sellers to
drive prices below the consensus of value. Bear Power reflects the ability
of sellers to drive prices below the average consensus of value.
Bull Power is calculated by subtracting the 13-day EMA from the day's High.
Bear power subtracts the 13-day EMA from the day's Low.
You can use in the xPrice any series: Open, High, Low, Close, HL2, HLC3, OHLC4 and ect...
WARNING:
- For purpose educate only
- This script to change bars colors.
Combo Strategy 123 Reversal & Elder Ray (Bear Power) This is combo strategies for get a cumulative signal.
First strategy
This System was created from the Book "How I Tripled My Money In The
Futures Market" by Ulf Jensen, Page 183. This is reverse type of strategies.
The strategy buys at market, if close price is higher than the previous close
during 2 days and the meaning of 9-days Stochastic Slow Oscillator is lower than 50.
The strategy sells at market, if close price is lower than the previous close price
during 2 days and the meaning of 9-days Stochastic Fast Oscillator is higher than 50.
Second strategy
Developed by Dr Alexander Elder, the Elder-ray indicator measures buying
and selling pressure in the market. The Elder-ray is often used as part
of the Triple Screen trading system but may also be used on its own.
Dr Elder uses a 13-day exponential moving average (EMA) to indicate the
market consensus of value. Bear Power measures the ability of sellers to
drive prices below the consensus of value. Bear Power reflects the ability
of sellers to drive prices below the average consensus of value.
Bull Power is calculated by subtracting the 13-day EMA from the day's High.
Bear power subtracts the 13-day EMA from the day's Low.
You can use in the xPrice any series: Open, High, Low, Close, HL2, HLC3, OHLC4 and ect...
WARNING:
- For purpose educate only
- This script to change bars colors.

Failed ReversalThis is built on False Reversal or say Profit Booking logic where price is moving in an direction and suddenly reverses but then fails to sustain on that reversal and comes back to original trend.This is a Trend Following system and the entry exits are based on price action using 2 candles wherein close of second candle defines Entry and low of previous is SL.This also has an Stop loss Filter so that user's can avoid the trades having big candles as per their risk appetite .

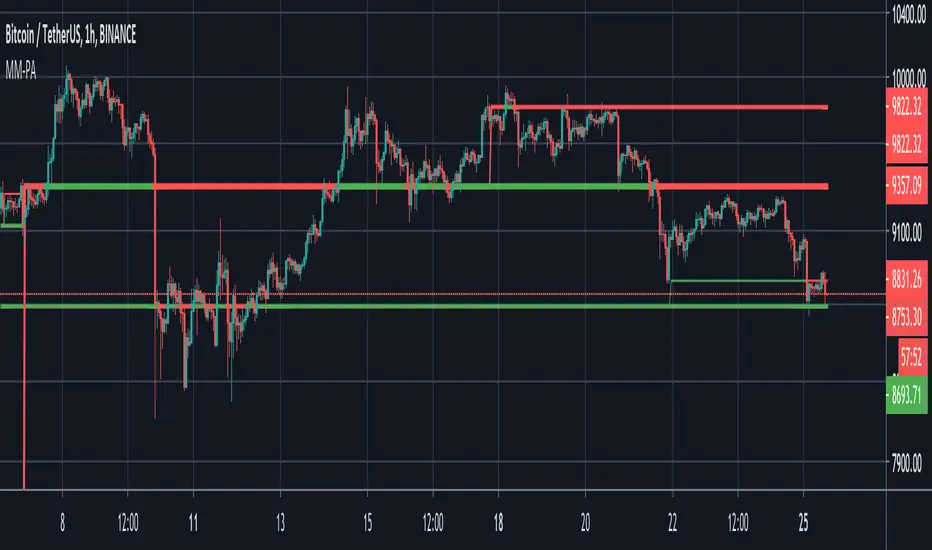
Cuban's Price Action ChannelThe latest in the indicator series tailored to discretionary traders.
This script draws a channel by using the highs and lows of previous timeframes. The H1 and H4 fill is extremely useful for taking low timeframe front-side reversals in a ranging environment, while providing high timeframe levels to take profit at, and plan your next trade.
I believe this script provides a solid fundamental price action understanding and foundation to anyone's discretionary trading setup.

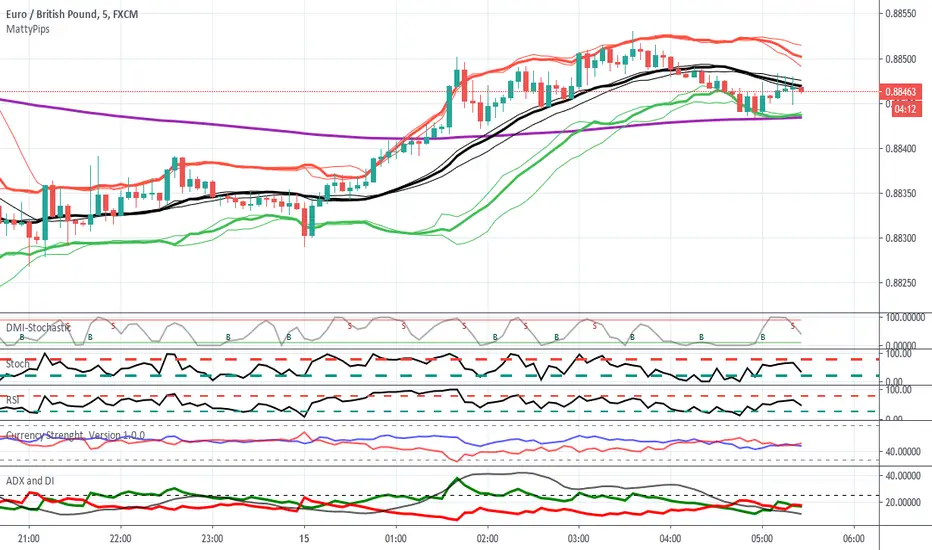
MattyPips Strategy with Alerts For education purpose.
Applied only for Matty Pips Strategy.
Arrow will appear when
DMI + Stoch + RSI are in the same OB/OS.
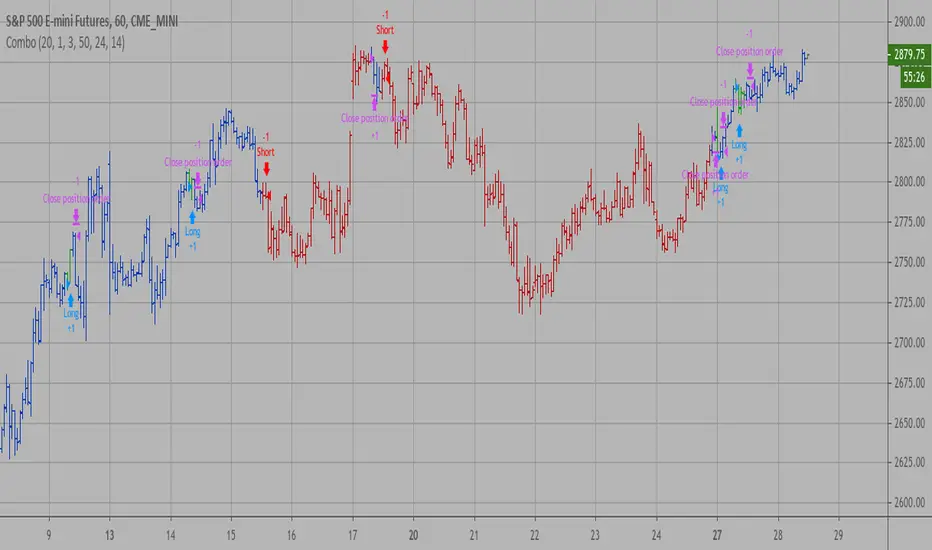
Combo Backtest 123 Reversal & ECO Strategy This is combo strategies for get a cumulative signal.
First strategy
This System was created from the Book "How I Tripled My Money In The
Futures Market" by Ulf Jensen, Page 183. This is reverse type of strategies.
The strategy buys at market, if close price is higher than the previous close
during 2 days and the meaning of 9-days Stochastic Slow Oscillator is lower than 50.
The strategy sells at market, if close price is lower than the previous close price
during 2 days and the meaning of 9-days Stochastic Fast Oscillator is higher than 50.
Second strategy
We call this one the ECO for short, but it will be listed on the indicator list
at W. Blau’s Ergodic Candlestick Oscillator. The ECO is a momentum indicator.
It is based on candlestick bars, and takes into account the size and direction
of the candlestick "body". We have found it to be a very good momentum indicator,
and especially smooth, because it is unaffected by gaps in price, unlike many other
momentum indicators.
We like to use this indicator as an additional trend confirmation tool, or as an
alternate trend definition tool, in place of a weekly indicator. The simplest way
of using the indicator is simply to define the trend based on which side of the "0"
line the indicator is located on. If the indicator is above "0", then the trend is up.
If the indicator is below "0" then the trend is down. You can add an additional
qualifier by noting the "slope" of the indicator, and the crossing points of the slow
and fast lines. Some like to use the slope alone to define trend direction. If the
lines are sloping upward, the trend is up. Alternately, if the lines are sloping
downward, the trend is down. In this view, the point where the lines "cross" is the
point where the trend changes.
When the ECO is below the "0" line, the trend is down, and we are qualified only to
sell on new short signals from the Hi-Lo Activator. In other words, when the ECO is
above 0, we are not allowed to take short signals, and when the ECO is below 0, we
are not allowed to take long signals.
WARNING:
- For purpose educate only
- This script to change bars colors.

Combo Strategy 123 Reversal & ECO This is combo strategies for get a cumulative signal.
First strategy
This System was created from the Book "How I Tripled My Money In The
Futures Market" by Ulf Jensen, Page 183. This is reverse type of strategies.
The strategy buys at market, if close price is higher than the previous close
during 2 days and the meaning of 9-days Stochastic Slow Oscillator is lower than 50.
The strategy sells at market, if close price is lower than the previous close price
during 2 days and the meaning of 9-days Stochastic Fast Oscillator is higher than 50.
Second strategy
We call this one the ECO for short, but it will be listed on the indicator list
at W. Blau’s Ergodic Candlestick Oscillator. The ECO is a momentum indicator.
It is based on candlestick bars, and takes into account the size and direction
of the candlestick "body". We have found it to be a very good momentum indicator,
and especially smooth, because it is unaffected by gaps in price, unlike many other
momentum indicators.
We like to use this indicator as an additional trend confirmation tool, or as an
alternate trend definition tool, in place of a weekly indicator. The simplest way
of using the indicator is simply to define the trend based on which side of the "0"
line the indicator is located on. If the indicator is above "0", then the trend is up.
If the indicator is below "0" then the trend is down. You can add an additional
qualifier by noting the "slope" of the indicator, and the crossing points of the slow
and fast lines. Some like to use the slope alone to define trend direction. If the
lines are sloping upward, the trend is up. Alternately, if the lines are sloping
downward, the trend is down. In this view, the point where the lines "cross" is the
point where the trend changes.
When the ECO is below the "0" line, the trend is down, and we are qualified only to
sell on new short signals from the Hi-Lo Activator. In other words, when the ECO is
above 0, we are not allowed to take short signals, and when the ECO is below 0, we
are not allowed to take long signals.
WARNING:
- For purpose educate only
- This script to change bars colors.

Combo Backtest 123 Reversal & Ease of Movement (EOM) This is combo strategies for get a cumulative signal.
First strategy
This System was created from the Book "How I Tripled My Money In The
Futures Market" by Ulf Jensen, Page 183. This is reverse type of strategies.
The strategy buys at market, if close price is higher than the previous close
during 2 days and the meaning of 9-days Stochastic Slow Oscillator is lower than 50.
The strategy sells at market, if close price is lower than the previous close price
during 2 days and the meaning of 9-days Stochastic Fast Oscillator is higher than 50.
Second strategy
This indicator gauges the magnitude of price and volume movement.
The indicator returns both positive and negative values where a
positive value means the market has moved up from yesterday's value
and a negative value means the market has moved down. A large positive
or large negative value indicates a large move in price and/or lighter
volume. A small positive or small negative value indicates a small move
in price and/or heavier volume.
A positive or negative numeric value. A positive value means the market
has moved up from yesterday's value, whereas, a negative value means the
market has moved down.
WARNING:
- For purpose educate only
- This script to change bars colors.

TITAN StrategyTitan Strategy it's a Volatility & price action indicator giving you the exact point of exit or stop or reversal
with 2 different lengths represent as 2-time frames to drive the trend and reversals during the bear market and the bull market
with one adjustable level of taking profit and one adjustable stop loss level.
Grate for swing trading and Bullrun recognition and scalp those short trade into the bear market
and there its 2 more timeframes or lengths for the short environments where titan will scalp short into the average true range
default settings are at 4% stop loss and 4% take profit
How to use :
Buy Signal: long condition
Sell Signal: Short condition
If you like to know how to apply to the service please send me a private msg
we have a full pdf guide that comes with indicator its will be provided to you for mentoring propose
thx for your time and support

Combo Strategy 123 Reversal & Ease of Movement (EOM) This is combo strategies for get a cumulative signal.
First strategy
This System was created from the Book "How I Tripled My Money In The
Futures Market" by Ulf Jensen, Page 183. This is reverse type of strategies.
The strategy buys at market, if close price is higher than the previous close
during 2 days and the meaning of 9-days Stochastic Slow Oscillator is lower than 50.
The strategy sells at market, if close price is lower than the previous close price
during 2 days and the meaning of 9-days Stochastic Fast Oscillator is higher than 50.
Second strategy
This indicator gauges the magnitude of price and volume movement.
The indicator returns both positive and negative values where a
positive value means the market has moved up from yesterday's value
and a negative value means the market has moved down. A large positive
or large negative value indicates a large move in price and/or lighter
volume. A small positive or small negative value indicates a small move
in price and/or heavier volume.
A positive or negative numeric value. A positive value means the market
has moved up from yesterday's value, whereas, a negative value means the
market has moved down.
WARNING:
- For purpose educate only
- This script to change bars colors.

Ants BeastMode Die or Fly IndicatorCandle will be highlighted blue whenever a large move is about to happen

EMA Mean Reversionthis is a mean reversion strategy using ema std deviations
use flat scaling 5 orders buy and sell - just close it back when it hits the VWMA
strategy operates to make dozens of small profitable trades in exchange for a larger loss on rare trending moves.
It works by projecting five 0.5% std deviations from the ema as volatility bands to help you scale into shorts and longs. generally flat scaling will work better than ascending. there is no SL logic for the strategy - positions should be closed when prices crosses back through the VWMA . To be used on lower timeframes only as the bands to do not expand or contract according to ATR
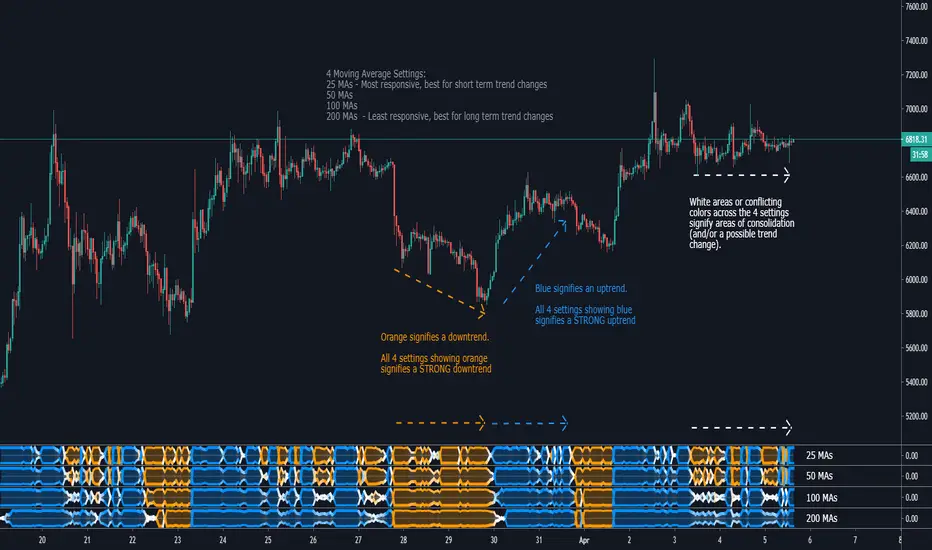
Life StrandA visual representation of 25, 50, 100, or 200 moving averages and their position relative to price action.
Reading this Indicator:
Blue represents that the majority of MAs are below price action, indicating a bullish trend. The wider the Strand, the stronger the trend. All 4 Settings showing blue indicate a strong bullish trend.
Orange represents that the majority of MAs are above price action, indicating a bearish trend. The wider the Strand, the stronger the trend. All 4 Settings showing orange indicate a strong bearish trend.
White areas signify some MAs are above while others are below price action, indicating periods of consolidation or trend change.
The 25 MA setting is most responsive to PA and shows change of trends quickly. The 200 MA setting is the least responsive but gives a solid look at the long term trend and ignores the ups and downs in a longer trend.
Currently Supported MAs:
Simple Moving Average (SMA)
Exponential Moving Average (EMA)
RSI Moving Average (RMA)
Weighted Moving Average (WMA)
Volume Weighted Moving Average (VWMA)
Jurik Moving Average (JMA)
Trading Strategy:
I prefer to have all 4 Life Strands open (25, 50, 100, 200) and look for confluence of all 4 for confirmation of PA direction. All 4 are orange for 2-4 candles, strong indication of bearish movement. Same can be said for blue. When the 4 settings have conflicting colors (ie 2 are blue, 2 are orange), that PA becomes a no trade zone for me. Confirmation is key, as is with any indicator.