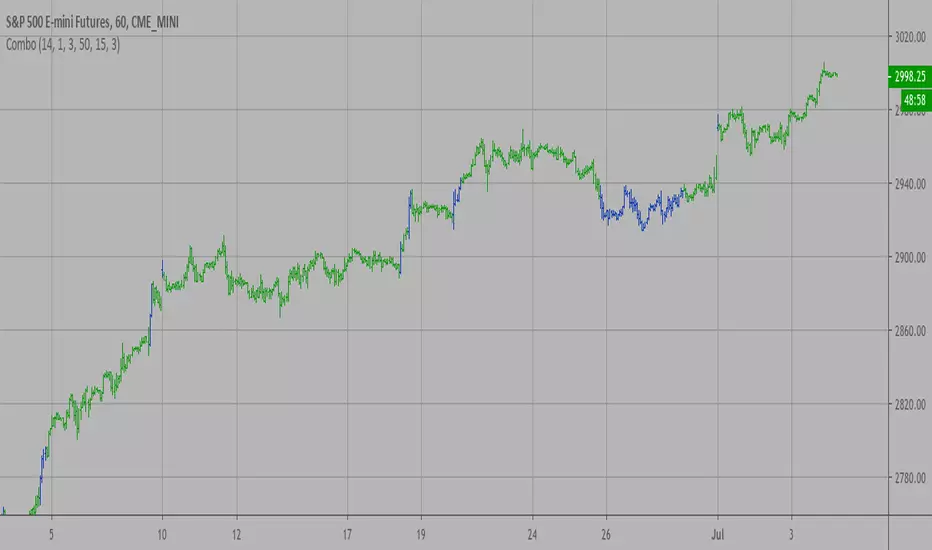
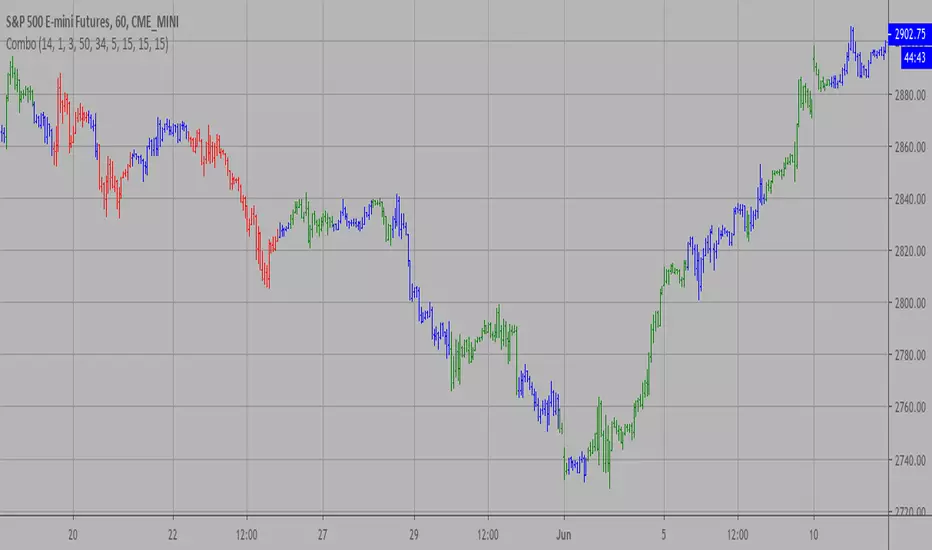
Combo Backtest 123 Reversal & Bull Power This is combo strategies for get a cumulative signal.
First strategy
This System was created from the Book "How I Tripled My Money In The
Futures Market" by Ulf Jensen, Page 183. This is reverse type of strategies.
The strategy buys at market, if close price is higher than the previous close
during 2 days and the meaning of 9-days Stochastic Slow Oscillator is lower than 50.
The strategy sells at market, if close price is lower than the previous close price
during 2 days and the meaning of 9-days Stochastic Fast Oscillator is higher than 50.
Second strategy
Bull Power Indicator
To get more information please see "Bull And Bear Balance Indicator"
by Vadim Gimelfarb.
WARNING:
- For purpose educate only
- This script to change bars colors.
Reversal

Combo Strategy 123 Reversal & Bull Power This is combo strategies for get a cumulative signal.
First strategy
This System was created from the Book "How I Tripled My Money In The
Futures Market" by Ulf Jensen, Page 183. This is reverse type of strategies.
The strategy buys at market, if close price is higher than the previous close
during 2 days and the meaning of 9-days Stochastic Slow Oscillator is lower than 50.
The strategy sells at market, if close price is lower than the previous close price
during 2 days and the meaning of 9-days Stochastic Fast Oscillator is higher than 50.
Second strategy
Bull Power Indicator
To get more information please see "Bull And Bear Balance Indicator"
by Vadim Gimelfarb.
WARNING:
- For purpose educate only
- This script to change bars colors.
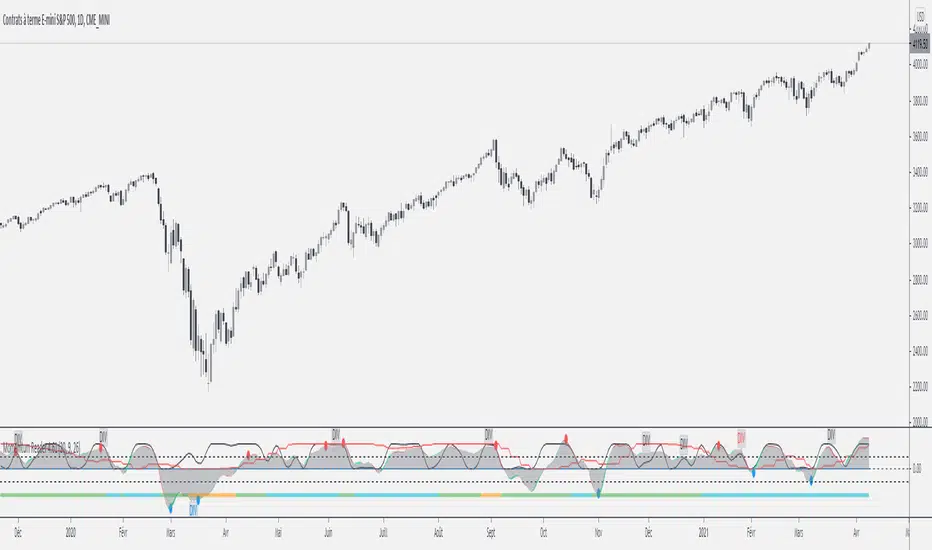
MOMEMTUM READER ULTIMATEMomemtum Reader is the complement of Market Reader it will help you to find market Top and Bottom.
Vortex Trend TrackerThough it may sound complex, the Vortex Indicator is essentially an uptrend line and a downtrend line. The vortex indicator can be used for a variety of purposes, including tracking the strength of trends, identifying/anticipating reversals, and generating entry/exit signals. It’s calculation is shown in the open-source code below.
To reduce the number of whipsaws produced by the indicator, we used an Exponential Moving Average of vmPlus and vmNegative values with a default length of 10. Decreasing this length will result in a more responsive vortex at the cost of more whipsaws and false signals.
The chart shows the absolute value of the difference between the uptrend and downtrend line displayed as the main histogram.
If the uptrend line is greater than the downtrend (thus indicating positive movement), then the histogram bars will be either light green or dark green. If the uptrend line has just now crossed the downtrend line, then the bar will be dark green. Bars will also be dark green when the uptrend line is greater than the downtrend line and the uptrend line is increasing. This means the trend is increasing in strength still. If the uptrend line is greater than the downtrend line, but is decreasing, then the bars will be light green. This means that the upwards trend is losing strength.
If the downtrend line is greater than the uptrend line, then there is a negative trend occurring and the bars will be either red or light red. If the downtrend line has just crossed over the uptrend line or is increasing in value, then the bar will be red. If the downtrend line is greater than the uptrend line, but is decreasing in value, then the bars will be light red (meaning the downtrend is weakening).
One way to trade using this vortex is to enter a long position when the bar color changes from red to light red. This would mean that the downtrend is decreasing in strength and an upwards reversal is likely to occur soon. Then, traders can exit their long position when the bars change from dark green to light green. When that color change occurs it means that the uptrend is running out of steam and price is unlikely to continue its upwards climb.
Traders can also choose to have the uptrend and downtrend lines plotted as well in the input menu. This may make it easier to visualize the Vortex and its usefulness in identifying reversals.

Combo Backtest 123 Reversal & Bull And Bear Balance This is combo strategies for get a cumulative signal.
First strategy
This System was created from the Book "How I Tripled My Money In The
Futures Market" by Ulf Jensen, Page 183. This is reverse type of strategies.
The strategy buys at market, if close price is higher than the previous close
during 2 days and the meaning of 9-days Stochastic Slow Oscillator is lower than 50.
The strategy sells at market, if close price is lower than the previous close price
during 2 days and the meaning of 9-days Stochastic Fast Oscillator is higher than 50.
Second strategy
This new indicator analyzes the balance between bullish and
bearish sentiment.
One can cay that it is an improved analogue of Elder Ray indicator.
To get more information please see "Bull And Bear Balance Indicator"
by Vadim Gimelfarb.
WARNING:
- For purpose educate only
- This script to change bars colors.

Combo Strategy 123 Reversal & Bull And Bear Balance This is combo strategies for get a cumulative signal.
First strategy
This System was created from the Book "How I Tripled My Money In The
Futures Market" by Ulf Jensen, Page 183. This is reverse type of strategies.
The strategy buys at market, if close price is higher than the previous close
during 2 days and the meaning of 9-days Stochastic Slow Oscillator is lower than 50.
The strategy sells at market, if close price is lower than the previous close price
during 2 days and the meaning of 9-days Stochastic Fast Oscillator is higher than 50.
Second strategy
This new indicator analyzes the balance between bullish and
bearish sentiment.
One can cay that it is an improved analogue of Elder Ray indicator.
To get more information please see "Bull And Bear Balance Indicator"
by Vadim Gimelfarb.
WARNING:
- For purpose educate only
- This script to change bars colors.

Combo Backtest 123 Reversal & Breakout Range Short This is combo strategies for get a cumulative signal.
First strategy
This System was created from the Book "How I Tripled My Money In The
Futures Market" by Ulf Jensen, Page 183. This is reverse type of strategies.
The strategy buys at market, if close price is higher than the previous close
during 2 days and the meaning of 9-days Stochastic Slow Oscillator is lower than 50.
The strategy sells at market, if close price is lower than the previous close price
during 2 days and the meaning of 9-days Stochastic Fast Oscillator is higher than 50.
Second strategy
Breakout Range Short Strategy
WARNING:
- For purpose educate only
- This script to change bars colors.

Combo Strategy 123 Reversal & Breakout Range Short This is combo strategies for get a cumulative signal.
First strategy
This System was created from the Book "How I Tripled My Money In The
Futures Market" by Ulf Jensen, Page 183. This is reverse type of strategies.
The strategy buys at market, if close price is higher than the previous close
during 2 days and the meaning of 9-days Stochastic Slow Oscillator is lower than 50.
The strategy sells at market, if close price is lower than the previous close price
during 2 days and the meaning of 9-days Stochastic Fast Oscillator is higher than 50.
Second strategy
Breakout Range Short Strategy
WARNING:
- For purpose educate only
- This script to change bars colors.

Rounded Bottom Breakout Strategy Moving Averages20-day SMA , 34-day EMA , 50-day SMA and 200-day SMA moving average indicator based on Rick Saddler's Rounded Bottom Reversal Breakout Strategy

Combo Backtest 123 Reversal & Breakout Range Long This is combo strategies for get a cumulative signal.
First strategy
This System was created from the Book "How I Tripled My Money In The
Futures Market" by Ulf Jensen, Page 183. This is reverse type of strategies.
The strategy buys at market, if close price is higher than the previous close
during 2 days and the meaning of 9-days Stochastic Slow Oscillator is lower than 50.
The strategy sells at market, if close price is lower than the previous close price
during 2 days and the meaning of 9-days Stochastic Fast Oscillator is higher than 50.
Second strategy
Breakout Range Long Strategy
WARNING:
- For purpose educate only
- This script to change bars colors.

Megalodon Pro Automated Longer Term TimerHow to use?
It should be used on DAILY time frame for finding potential market reversal points.
It shows reversal signals by printing Green for Buy - Orange for Strong Buy - Red for Sell - Purple for Strong Sell signals.

Combo Strategy 123 Reversal & Breakout Range Long This is combo strategies for get a cumulative signal.
First strategy
This System was created from the Book "How I Tripled My Money In The
Futures Market" by Ulf Jensen, Page 183. This is reverse type of strategies.
The strategy buys at market, if close price is higher than the previous close
during 2 days and the meaning of 9-days Stochastic Slow Oscillator is lower than 50.
The strategy sells at market, if close price is lower than the previous close price
during 2 days and the meaning of 9-days Stochastic Fast Oscillator is higher than 50.
Second strategy
Breakout Range Long Strategy
WARNING:
- For purpose educate only
- This script to change bars colors.

WhiplashClimax setup looking for a reversal the next day after a gap, this works best if the signal is triggered after a prolonged move in one direction. Enter the position at the close of the day when you get a signal and exit for a loss the next day if not profitable, otherwise, trail a stop to lock profits.
Combo Backtest 123 Reversal & Bill Williams. AO with Signal Line This is combo strategies for get a cumulative signal.
First strategy
This System was created from the Book "How I Tripled My Money In The
Futures Market" by Ulf Jensen, Page 183. This is reverse type of strategies.
The strategy buys at market, if close price is higher than the previous close
during 2 days and the meaning of 9-days Stochastic Slow Oscillator is lower than 50.
The strategy sells at market, if close price is lower than the previous close price
during 2 days and the meaning of 9-days Stochastic Fast Oscillator is higher than 50.
Second strategy
This indicator plots the oscillator as a histogram where blue denotes
periods suited for buying and red . for selling. If the current value
of AO (Awesome Oscillator) is above previous, the period is considered
suited for buying and the period is marked blue. If the AO value is not
above previous, the period is considered suited for selling and the
indicator marks it as red.
You can make changes in the property for set calculating strategy MA, EMA, WMA
WARNING:
- For purpose educate only
- This script to change bars colors.

Combo Strategy 123 Reversal & Bill Williams. AC with Signal Line This is combo strategies for get a cumulative signal.
First strategy
This System was created from the Book "How I Tripled My Money In The
Futures Market" by Ulf Jensen, Page 183. This is reverse type of strategies.
The strategy buys at market, if close price is higher than the previous close
during 2 days and the meaning of 9-days Stochastic Slow Oscillator is lower than 50.
The strategy sells at market, if close price is lower than the previous close price
during 2 days and the meaning of 9-days Stochastic Fast Oscillator is higher than 50.
Second strategy
This indicator plots the oscillator as a histogram where blue denotes
periods suited for buying and red . for selling. If the current value
of AO (Awesome Oscillator) is above previous, the period is considered
suited for buying and the period is marked blue. If the AO value is not
above previous, the period is considered suited for selling and the
indicator marks it as red.
You can make changes in the property for set calculating strategy MA, EMA, WMA
WARNING:
- For purpose educate only
- This script to change bars colors.
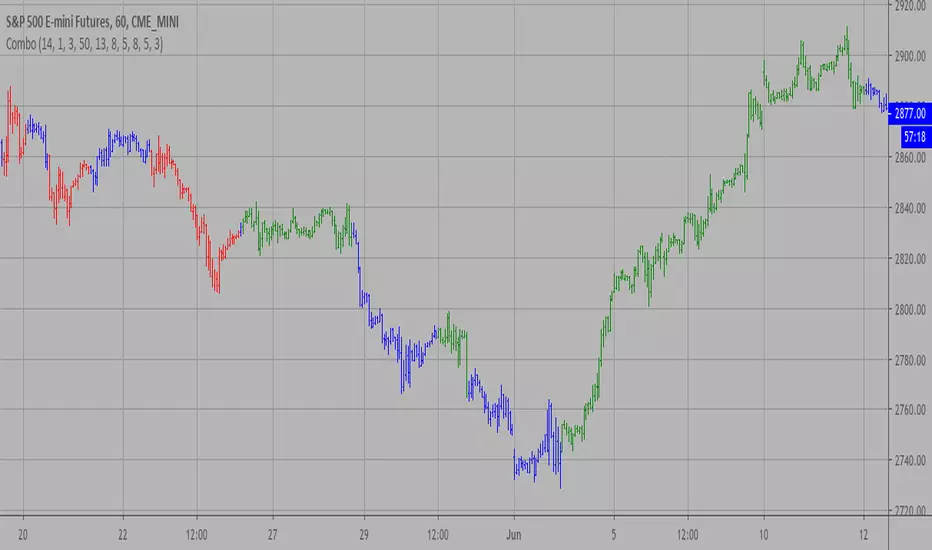
Combo Backtest 123 Reversal & Bill Williams Averages. 3Lines This is combo strategies for get
a cumulative signal. Result signal will return 1 if two strategies
is long, -1 if all strategies is short and 0 if signals of strategies is not equal.
First strategy
This System was created from the Book "How I Tripled My Money In The
Futures Market" by Ulf Jensen, Page 183. This is reverse type of strategies.
The strategy buys at market, if close price is higher than the previous close
during 2 days and the meaning of 9-days Stochastic Slow Oscillator is lower than 50.
The strategy sells at market, if close price is lower than the previous close price
during 2 days and the meaning of 9-days Stochastic Fast Oscillator is higher than 50.
Second strategy
This indicator calculates 3 Moving Averages for default values of
13, 8 and 5 days, with displacement 8, 5 and 3 days: Median Price (High+Low/2).
The most popular method of interpreting a moving average is to compare
the relationship between a moving average of the security's price with
the security's price itself (or between several moving averages).
WARNING:
- For purpose educate only
- This script to change bars colors.

Combo Strategy 123 Reversal & Bill Williams Averages. 3Lines This is combo strategies for get
a cumulative signal. Result signal will return 1 if two strategies
is long, -1 if all strategies is short and 0 if signals of strategies is not equal.
First strategy
This System was created from the Book "How I Tripled My Money In The
Futures Market" by Ulf Jensen, Page 183. This is reverse type of strategies.
The strategy buys at market, if close price is higher than the previous close
during 2 days and the meaning of 9-days Stochastic Slow Oscillator is lower than 50.
The strategy sells at market, if close price is lower than the previous close price
during 2 days and the meaning of 9-days Stochastic Fast Oscillator is higher than 50.
Second strategy
This indicator calculates 3 Moving Averages for default values of
13, 8 and 5 days, with displacement 8, 5 and 3 days: Median Price (High+Low/2).
The most popular method of interpreting a moving average is to compare
the relationship between a moving average of the security's price with
the security's price itself (or between several moving averages).
WARNING:
- For purpose educate only
- This script to change bars colors.
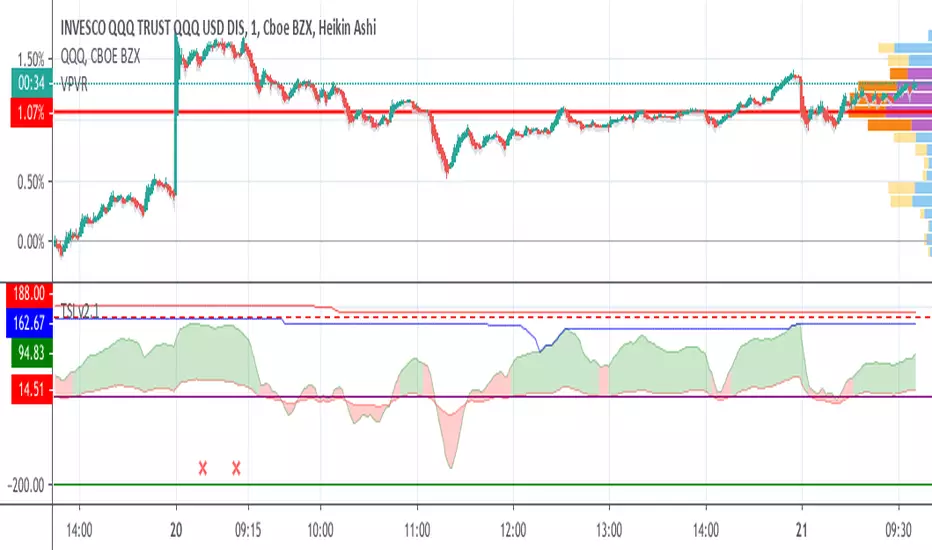
Trend Shift Indicator v2.0 [Bradford Fournier]TSI v2.0-- Early Trend Shift Indicator Version 2.0
PURPOSE: This indicator detects early changes in trends and provides confirmation
TSI aims to do the following simultaneously:
detect trend changes early
provide a means of trend confirmation -- while still being early in the cycle change
provide an early indication of trend changing away from positive.
SIGNALS
EARLY SELL: Green peaked and decreasing
SELL: GREEN TO RED
(STRONG SELL: TSI peaked and crossunder "overbought input(180)")
BUY: RED TO GREEN
NOTE: Version 1 is still operative and updated. This is simply an alternative version for those who prefer it. SEE CHANGES BELOW
-----------------
VERSION 2 CHANGES:
Earlier reversal indications.
Dynamic risk range. (yellow filler)
[*}Overlay for signal confirmation


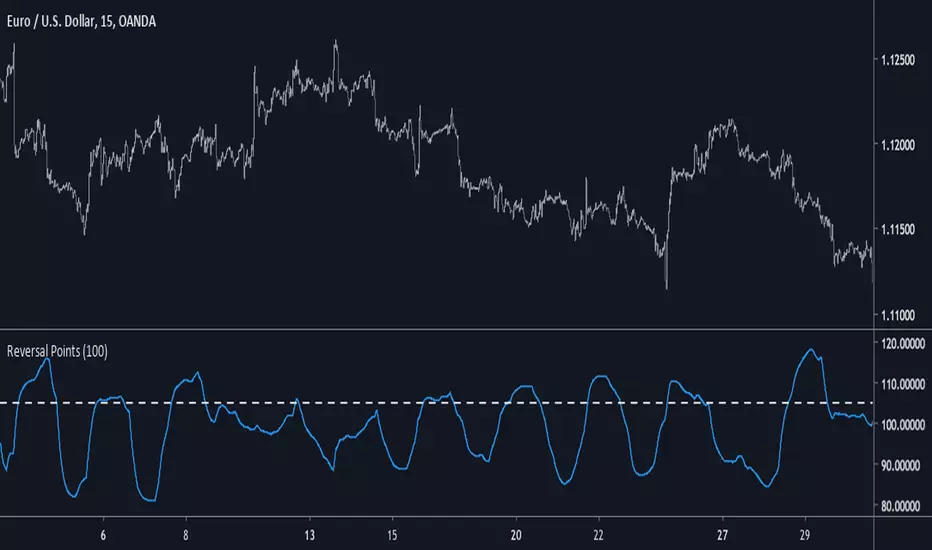
Reversal PointsIntroduction
This indicator is inspired from the mass index indicator with the goal of telling the user when a trend is about to stop thus highlighting potential reversals.
The Indicator
When the indicator cross under the trigger line the trend is about to stop and may reverse, shorter length will spot shorter terms reversals but a length of 100 is a good value.
Combo Backtest 123 Reversal & Bear Power This is combo strategies for get
a cumulative signal. Result signal will return 1 if two strategies
is long, -1 if all strategies is short and 0 if signals of strategies is not equal.
First strategy
This System was created from the Book "How I Tripled My Money In The
Futures Market" by Ulf Jensen, Page 183. This is reverse type of strategies.
The strategy buys at market, if close price is higher than the previous close
during 2 days and the meaning of 9-days Stochastic Slow Oscillator is lower than 50.
The strategy sells at market, if close price is lower than the previous close price
during 2 days and the meaning of 9-days Stochastic Fast Oscillator is higher than 50.
Second strategy
Bear Power Indicator
To get more information please see "Bull And Bear Balance Indicator"
by Vadim Gimelfarb.
WARNING:
- For purpose educate only
- This script to change bars colors.

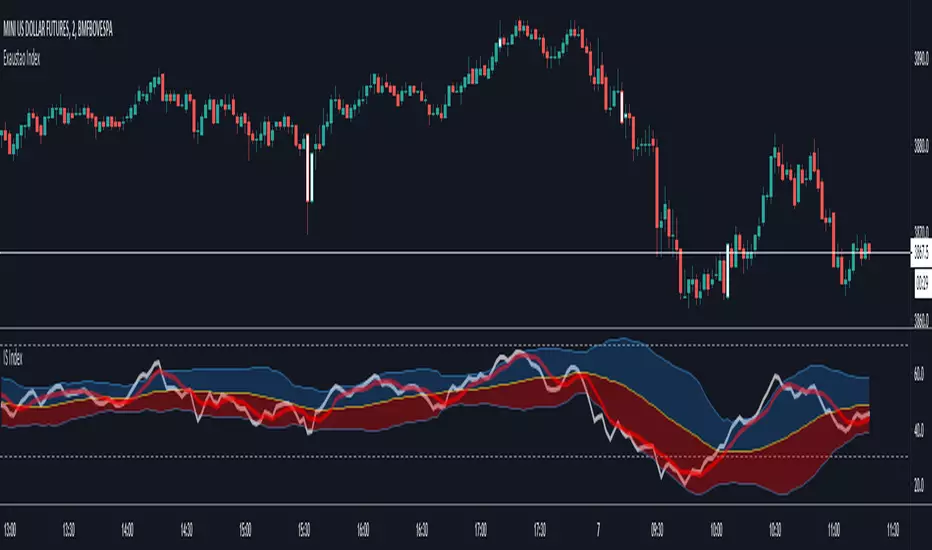
IS - Exaustao IndexIS - Indice de Exaustão
Este indicador está sendo publicado temporariamente. (Aproveitem para utilizar no Brasil usando o MiniDolar **Faz geralmente de 3 a 5ptos
O Objetivo é encontrar investidores;
Indicações de utilização:
B3 - Bolsa Brasileira;
Forex - Mercado Forex Descentralizado;
Melhores pares B3:
WDO
Melhores pares Forex:
AUDJPY
EURJPY
Tempo Grafico: 1 minuto (Ambos os mercados);
Indicações de Venda:
No M1, quando o ativo atingir as paredes, em exato na segunda parede, já ficar preparado para acionar uma venda. O melhor ponto de venda é quando ele se encontra na parede e o candle é colorido de amarelo.
Indicações de Compra:
Exatamente como a venda, realizar a venda quando houver o toque na segunda parede (indicado fazer parcial entre primeira e segunda parede), se o candle estiver entre as paredes e formar um triangulo abaixo do candle, habilita uma compra com stop curto.
Considerações:
Este indicador foi construído com base em muito estudo de volume, foram mais de 2 meses fazendo ele e testando incansavelmente.
Façam o backtest retroativo no grafico no M1 e percebam o quanto ele pode oferecer quando se forma um triangulo abaixo do candle ou um candle amarelo para a venda.
Ele funciona perfeitamente na B3 até as 11h 12h. Depois, como o mercado perde um pouco de liquidez ele nao tem o mesmo indice de eficiencia.
Não aceitar stops longos por se tratar do M1, se habilitar entrada e logo habilitar entrada no sentido contrario não pense duas vezes antes de sair da operação.
Aceite levar até 2 stops por dia com este indicador, se passar disso, o dia não está positivo para o indicador;
Stop:
Vai depender da relação de exposição a banca, geralmente para B3 (WDO) é indicado um stop de 3pts a 4ptos (Acima é força contraria e euforia)
Contato: 41 - 998964223 / 41 - 991154223 (Curitiba/Pr) - Brasil
"Escolha sempre estar ao lado de quem queira crescer e faça acontecer!!!"