Bitstamp BTC Horizontal 200 Week SMAsmall change to my horizontal 200 week SMA script.
Plots the latest 200 week SMA value from Bitstamp BTCUSD on the chart. I use it for the Bitmex chart, as Bitmex doesn't have enough history for a 200 week moving average.
Tìm kiếm tập lệnh với "BTC"

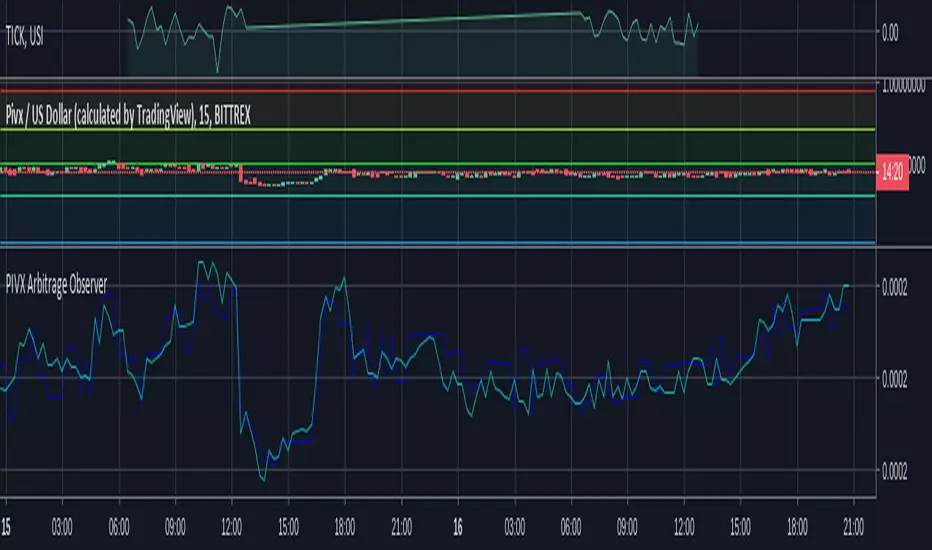
PIVX Arbitrage ObserverObserve PIVX price arbitrage in BTC on two exchanges that TradingView has listed. It's on a bunch more but TV doesn't track them :/
Volumen Consolidado de BTCVolumen consolidado de BTC tomando en cuenta varios exchanges dónde se comercializa.

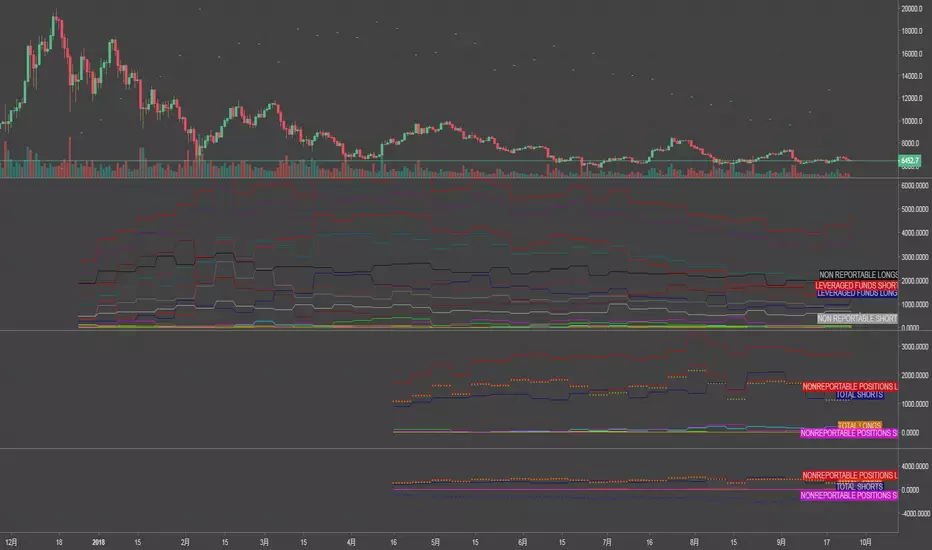
Bitfinex BTC Longs & Shorts Positions Proportion ValueBTCUSDLONGS BTCUSDSHORTS Proportion- Bitfinex BTC Longs & Shorts Positions Proportion Value

Bitfinex BTC Longs & Shorts Positions Difference ValueBTCUSDLONGS BTCUSDSHORTS Difference- Bitfinex BTC Longs & Shorts Positions Difference Value

Bitmex BTC FuturesBitmex / Bitcoin indicator.
Just a simple overlay to visualise the contango / backwardation on Bitmex btc futures products so you know which to take position in, at a glance.
There are two selectable instruments (I have Dec18 and Mar19 selected already). By default the one with nearest settlement date is plotted with a filled coloured band from current price, the other plots a cross symbol.

CBOE/CME BTC FUTURE LISThow to pull data from quandl.com
this script for CBOE/CME BTC FUTURE
ex.
if you want to pull www.quandl.com you input "QUANDL:CFTC/1330E1_FO_ALL|n" as TV symbol.("n" is table number)
Bitfinex BTC margin position differencesIf green is over the red it means that longs are currently dominant on BitFinex for BTC.
Same goes if red is over green just that shorts are dominant.
If the green is over red the green will show how many more longs there are than shorts and if you hover over the red you will see how many more shorts there are compared to longs
Vice versa if red is over green .
You can change to a histogram, area, line or any other style of chart in the settings of the indicator
The black dashed line in the middle is 0 aka if u see the indicator go there it means there are an equal amount of longs and shorts

ETHUSDSHORTS ETHUSDLONGS - Bitfinex BTC Shorts & LongsBTCUSDSHORTS BTCUSDLONGS - Bitfinex BTC Shorts & Longs

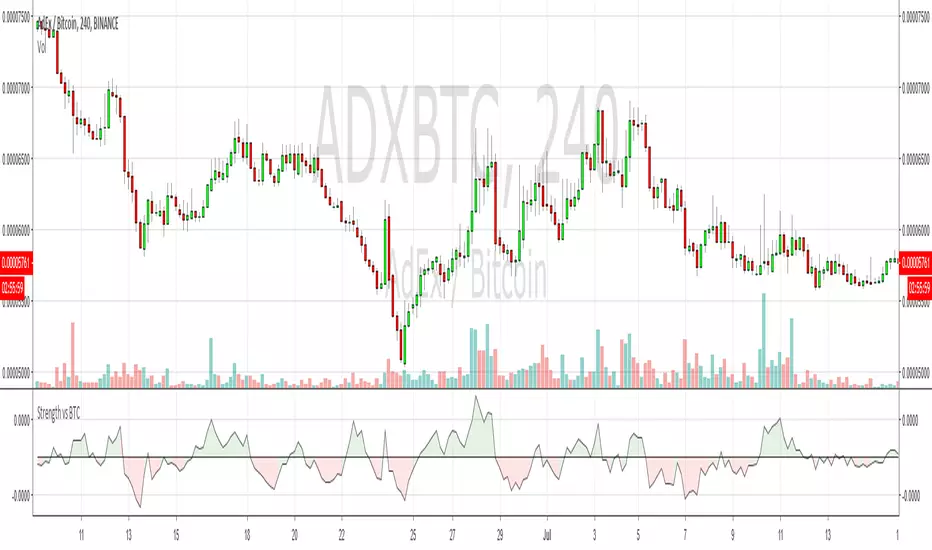
Strength Relative to BTCShows strength of the currently charted alt compared to BTCUSD. If BTC is going down or sideways and the alt is going up, then you'll see green and vice-versa for red. Good for quick at-a-glance strength evaluation when flying through a watchlist. The output uses a normalised moving average to reduce signal noise.
Bitfinex BTC longs vs Short & RatioSince the last BTC Short Squeeze on Bitmex maintenance I decided to made a Indicator plotting Long:Short ratio, and their respective graphs.
Green = Longs
Red = Shorts
Black = Ratio (Longs:Shorts)*Close <= Close price just for chart normalization!
I hope you find it useful.
NOTE: It isn't a prospective indicator, but try to find out who's bitching the market and when ;p
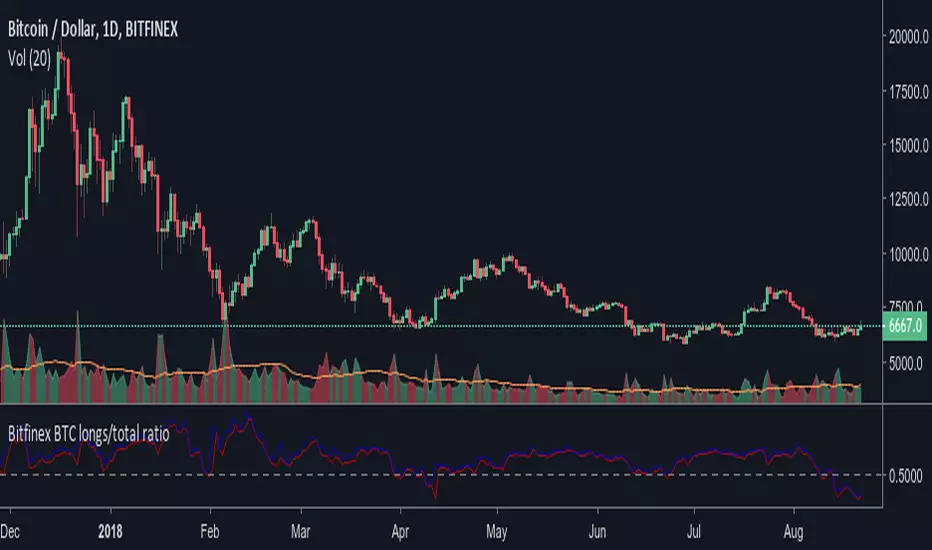
Bitfinex BTC longs/total ratioRatio of bitfinex longs versus the total btc in positions. Maybe a good indicator of market sentiment. It allows you to see too where were people taking profit or closing positions. Remember that ratio going up doesn't necesarily mean more longs positions are being added. It could mean shorts are closing position massively. The conversely is also true.
The rate above 0.5 doesn't necesarily bullish, though, and the indicator is "timeframe" agnostic. So take into account that there could be tons of longs positions that were opened since back before summer 2017, It seems to be too of positions opened at prices below 4.000$. That's why the average seems to be around 0.6.
The blue lines indicates current ratio (or on close for past bars). The red line is the max ratio (higher shorts versus lowest longs).
TPA BTC Chart
We created this chart to compare the Altco Saturn chart with the Bitcoin chart of the same time zone. The source of this chart is BITSTAMP: BTCUSD.
동시간대의 비트트코인 차트와 알트사토시 차트를 비교하기 위해 만들었습니다.이 차트의 소스는 BITSTAMP:BTCUSD 입니다.

Bitfinex BTC Shorts histogramDifference between the BTC amount of short positions at every candle, respect to the previous one, plotted as an histogram.
Volatility Across CoinsCompare the recent volatility of 8 cryptocurrencies, based on percentage change per candle.
Useful for volatility strategies to find the highest volatility coins over recent periods or to get an at-a-glance view of volatility correlations.
Options to change the resolution and find average % change per candle over user defined length.
Key:
BTC = Yellow/Gold
ETH = Purple
LTC = Gray
NEO = Green
IOTA = Light Blue
XMR = Orange
BCH = Red
Dash = Blue

Bitfinex BTC Delta Long & ShortShows short term changes in BTC/USDT Short and Long Positions and their difference to determine cost of a manipulative move.

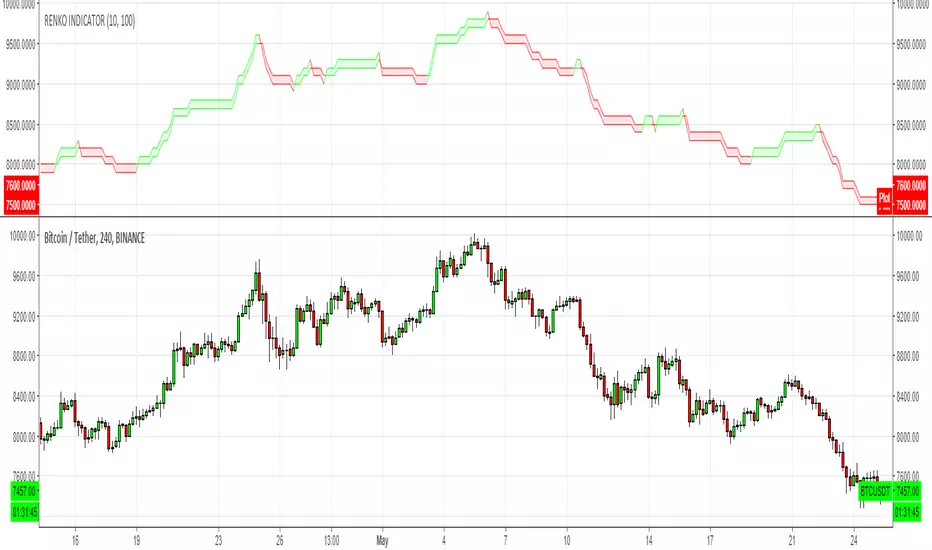
RENKO INDICATOR OVERLAY by CryptoJoncisA very simple and basic renko indicator for any time frame and ticker.
Please be aware, the minimum value for traditional renko box size = 0.0001 so if you are using this indicator for trading with cryptocurrencies, it might be better to use ATR for that.
Can be merged together with main chart for better performance.
Consider a tip if you find this helpful
BTC: 3FiBnveHo3YW6DSiPEmoCFCyCnsrWS3JBR
ETH: 0xac290B4A721f5ef75b0971F1102e01E1942A4578

GDAX Coin CorrelationPretty viz of how correlated/uncorrelated price of coins BTC ETH LTC BCH are on GDAX.
From the ref:
"Correlation coefficient. Describes the degree to which two series tend to deviate from their sma values."


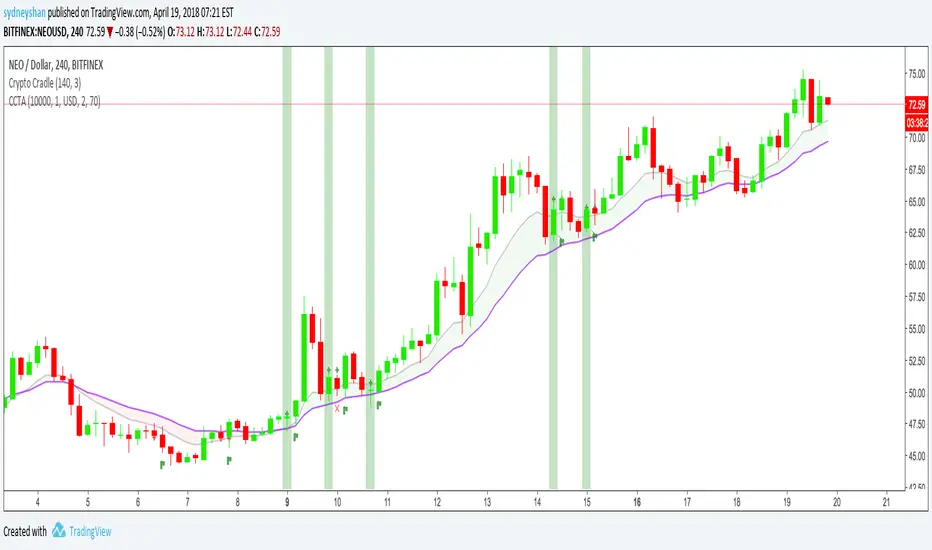
Crypto Cradle Trade AssistantThis indicator compliments the Crypto Cradle indicator by providing your entry, stop, 1:1 scale-out price, trade amount, and potential profit based on your target and scale-out strategy.
1. Ensure you have added the Crypto Cradle and Crypto Cradle Trade Assistant indicators to your chart
2. Click the cog icon to configure this indicator
3. Enter in your account balance and the % you are willing to risk on this trade (default: 1%).
3. Set your target price
4. Tweak the Trade Pair and Precision (Decimals) if required (USD/USDT only BTC & ETH coming soon)
5. Click on the 'Data Window' icon on the right-hand side of the screen and scroll down to CCTA
6. Hover over a highlighted crypto cradle candle (green for long, red for short) and a series of values will appear
Entry price
Stop price
1:1 scale out price
Amount to buy/sell (ie NEO)
Amount in traded currency (ie USD)
Target price (that you set)
Profit based on selling 50% of your bought amount when your reward equals your risk (1:1 scale-out)
Profit based on risking 1% of your portfolio
For more about the Crypto Cradle strategy, visit www.tradercobb.com