Open High Low StrategyThis is a very simple, yet effective and to some extend widely followed scalping strategy to capture the underling sentiments of the counter whether it will go up or down.
What is it?
This is Open-High-Low (OLH) strategy.
As you already aware of Candlestick patterns, there is patterns called as Marubozu patterns where the sell wick or buy wick either ceases to exists (or very small). This is exactly in the same principle.
In OLH strategy: The buy signal appears when the Open Price is the Low Price. It means if you draw the candlestick, there is no bottom wick. So after the opening of the candle, the demand drives the price up to the level, some selling may or may not come and closes in green. This indicates a strong upward biasness of the underlying counter.
Similarly, a sell signal appears when the Open price is the High Price. It means there is no upper wick. So there is no buying pressure, since the opening of the candle, sellers are in force and pulls down the price to a closing.
This strategy generates the signal at the close of the candle (technically barstate.isconfirmed). Because until the bar is real-time there is no option to know the final closing or high. So you will see the bar on which it generates the buy or sell signal is actually indicates the previous bar as OLH bar.
To determine the Stop-Loss, it uses the most widely known SL calculation of:
For buy signal, it takes the low of the last 7 candles and substract the ATR (Average True Range) of 14-period.
For sell signal, it takes the high of the last 7 candles and add it to the ATR (Average True Range) of 14-period.
One can plot the SL lines as dotted green and red lines as well to see visually.
Default Risk:Reward is 1:2, Can be customizable.
What is Unique?
Of course the utter simplistic nature of this strategy is it's key point. Very easy and intuitive to understand.
There are awesome strategies in this forum that talks about the various indicators combinations and what not.
Instead of all this, in a 15m NSE:NIFTY chart, it generates a good ~ 47% profit-factor with 1:2 Risk Reward ratio. Means if you loose a trade you will loose 1% of account and if you win you will gain 2%. Means 3 trades (2 profits and 1 loss) in a trading session result 3% overall gain for the day. (Assuming you are ready with 1% draw down of your account per trade, at max).
Disclaimer:
This piece of software does not come up with any warrantee or any rights of not changing it over the future course of time.
We are not responsible for any trading/investment decision you are taking out of the outcome of this indicator.
Tìm kiếm tập lệnh với "Candlestick"

Yearly CandlesPlots yearly candles from monthly candles data. This indicator could also be used to view yearly candles of those symbols for which candlesticks are not available in TradingView (for e.g., ECONOMICS:USINTR , ECONOMICS:USIRYY , ECONOMICS:USWG etc)
As these are not out of the box candles they do have these shortcomings -
Last candle's data is not available in status line, a separate label lists OHLC and change details near its close level
The very first candle's width may vary based on how much data is available for that year
Works only with monthly timeframe
Only those indicators that can be added on other indicators can be applied, however, they may still not work as intended as this still technically is a monthly chart!

HorseShoe - At NalıHorseShoe - At Nalı
English
HORSEHOE FORMATION
It is actually a kind of bobbin. As with the bobbin, the needles of the candles are not taken into account much.The difference is that there are only four candlesticks in this formation. There is no limit to this in the bobbin.In addition, it is important which of the bars forming the bobbin is longer or shorter than which.is not. This is very important in a horseshoe. There is a rule for the length and shortness of the bars.Candlesticks in a horseshoe showing the bearish sequentially rising, falling, rising and repeatingin the form of falling bars. Also the lengths of the first and fourth bars, i.e. price opening andThe differences between the closing must be longer than the second and third bar. So those on the sideshould be clearly larger than the middle ones. For the rise, the bars are falling-rising-falling in order.The rising candle should be in the form of a bar. Likewise the first and last barsshould be longer than the middle ones.Of the first and fourth bars, it is better if the fourth bar is longer than the first.was the signal. But the fact that they are equal or the first one is long does not mean this formation. Attentionthe first and last bars that need to be beat are clearly longer than the middle onesrequired. A millimeter long means a very weak signal.
It is valid for every price and parity. But this is not a magic wand, so every horseshoemay not be the correct signal. Trend, Supdem, Correlation and other similar components are alsois involved, a highly efficient signal is formed. Well reviewed onexperience must be gained. More like an indicator to show the direction of the price rather than a signalshould be used.
Turkish
AT NALI FORMASYONU
Aslında bir tür bobindir. Bobinde olduğu gibi mumların iğneleri çok dikkate alınmaz. Farkı, bu oluşumda sadece dört mum çubuk vardır. Bobinde bunun sınırı yoktur. Ayrıca bobini oluşturan barların hangisinin hangisinden uzun ya da kısa olduğu önemli değildir. At nalında bu çok önemlidir. Barların uzunluğu kısalığı ve sırasında bir kural vardır. Düşüşü gösteren at nalında mum çubuklar sırayla yükselen düşen yükselen ve tekrar düşen barlar şeklindedir. Ayrıca birinci ve dördüncü barların uzunlukları, yani fiyat açılış ve kapanışı arasındaki farkları, ikinci ve üçüncü bardan daha uzun olmalıdır. Yani kenardakiler ortadakilerden net bir şekilde büyük olmalı. Yükseliş için ise barlar sırayla düşen-yükselen düşen-yükselen mum çubuk şeklinde olmalıdır. Aynı şekilde ilk ve son barlar ortadakilerden uzun olmalıdır. Birinci ve dördüncü barlardan dördüncü barın birinciden uzun olması daha güze bir sinyaldi. Fakat eşit olmaları ya da birincinin uzun olması da bu oluşumu bozmaz. Dikkat edilmesi gereken ilk ve son barların açık bir şekilde ortadakilerden uzun olması gerekmektedir. Milim farkla uzun olması çok zayıf bir sinyal olması anlamına gelir.
kaynak:
Price Action TR

topsy-turvy tousled candlesVery simple and weird type of candlesticks 😀
Wicks becomes body-ish and body becomes wickish
Cheers!

Heikin-Ashi Candle ColoringThis script will change the color of normal candlesticks to the color that the corresponding Heikin-Ashi candles would have.
This allows to spot a trend or a trend reversal just by looking at candles, without using Heikin-Ashi candles, which distort the appearance of a typical chart.

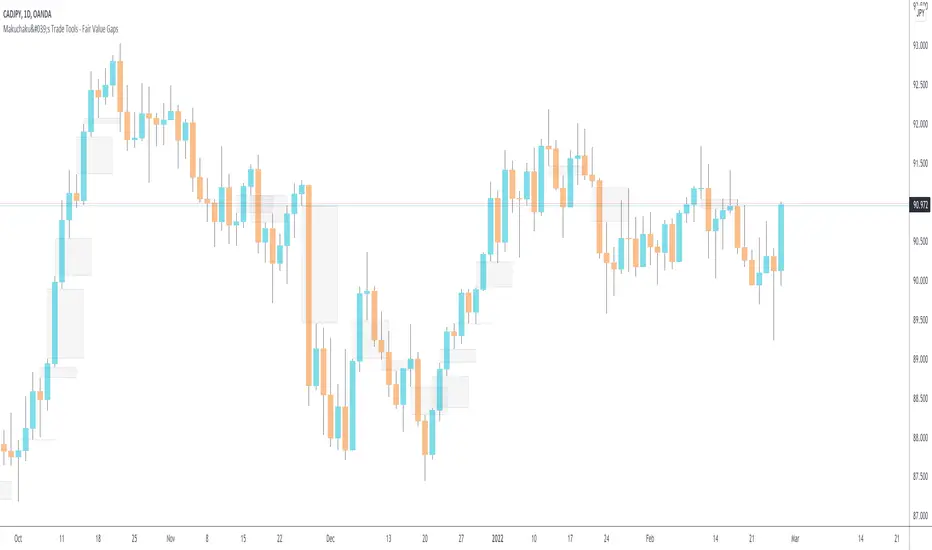
Makuchaku's Trade Tools - Fair Value GapsFair Value Gaps are a 3 candlesticks patterns, formed when the 3rd candle does not fully overlaps the 1st candle, leaving a gap in the 2nd candle.
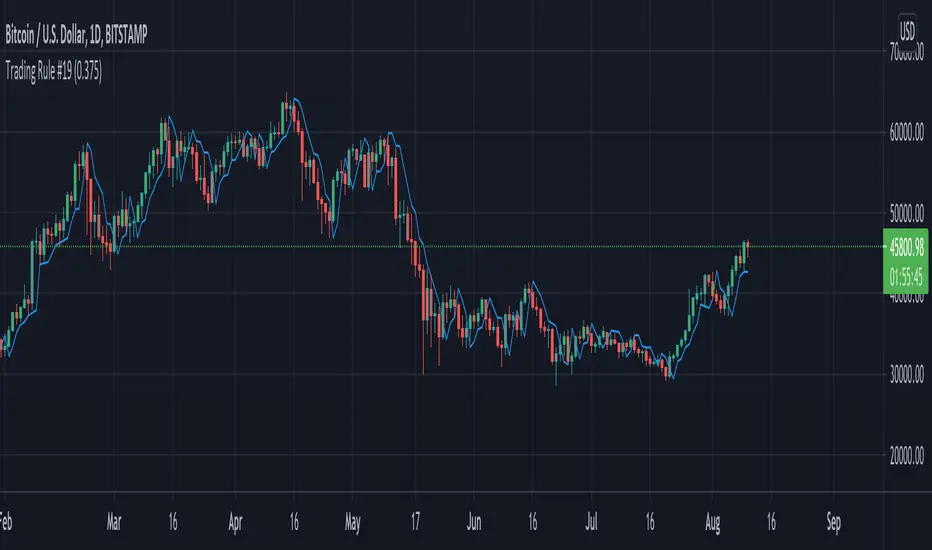
Trading Rule #19This script is based on Trading Rule #19 from Chester Keltner's book How To Make Money On Commodities. It is best applied to candlestick charts with longer time frames and plans with minimal losses (i.e. swing trades). The rule is based on "Key" trend days (this is applied to daily charts in the book).
An initial Key-Up day is established on the third day of 3 consecutive new highs. Subsequent key-up days are determined as follows:
1. The first day following an initial key-up day trades 0.375% above the previous key-up day
2. The second day or any following day trades 0.125% above the previous key-up day
An initial Key-Down day is established on the third day of 3 consecutive new lows. Subsequent key-down days are determined as follows:
1. The first day following an initial key-up day trades 0.375% below the previous key-down day
2. The second day or any following day trades 0.125% below the previous key-down day
Green candles are considered up-trend, red candles are down-trend. Gray candles are undecided - when there is a new high and low in the same time frame, when there is no new high or low in that time frame, or the order price was cleared.
Order prices are represented as a blue line, with some days being "na" when order prices remain unchanged. On key-up days, orders are placed 0.375% below the low of the previous key-up day or the day previous (whichever is lower). Order prices on key-down days are placed 0.375% above the high of the previous key-down day or the day previous (whichever is higher).
The tolerance setting mainly effects the plot point of order price, at a certain point key-trend rules will take priority over order price (meaning if tolerance is high enough, order price will have no effect on determining key-trends).
Cumulative Volume Delta Candles Aggregated (Lite)Cumulative Volume Delta Candles Aggregated (Lite)
Multi-Exchange CVD Visualization in Candle Format
This indicator provides an aggregated Cumulative Volume Delta (CVD) view across multiple major perpetual futures exchanges in one chart. It is designed for traders who want a broader perspective on buying and selling pressure without switching between multiple charts or relying on a single exchange feed.
What It Does
Combines volume delta data from Binance, Bybit, OKX, Bitget, and Coinbase into a unified representation.
Displays CVD as candlesticks, where each candle reflects the open, high, low, and close of cumulative delta for the selected period.
Offers a clear visual of how buying and selling pressure evolves across markets in a structured, familiar candle format.
Key Features
✔ Exchange Aggregation: Incorporates data from several top futures markets available on TradingView.
✔ Anchor Reset: Allows you to set an anchor timeframe (e.g., daily) to reset cumulative values for better readability and analysis.
✔ Unit Normalization: Since exchanges report volumes in different units, the indicator normalizes all data and outputs values denominated in the base currency (coins) for consistency.
✔ Hidden OHLC Outputs: Provides open, high, low, and close values as hidden plots for use with other indicators or strategies.
✔ Lightweight Design: Optimized for efficiency while handling multiple real-time data requests.
Why It’s Different
Unlike standard single-exchange CVD tools, this indicator aggregates the majority of perpetual volume data available on TradingView, offering a more representative view of market sentiment. The candle-based representation of CVD introduces an additional layer of structure, helping traders identify shifts in momentum and pressure with more context than a simple cumulative line.
Use Cases
- Spotting aggregated buy/sell pressure trends across multiple exchanges.
- Confirming breakout or reversal signals with broader volume delta context.
- Serving as a custom data source for other indicators or algorithmic strategies.

NSDT Bearish-Bullish CandlesThis is another interesting take on candlesticks . These Bearish-Bullish Candles do not show the wicks. Instead, the upper wick is made into a Red body and the lower wick is made into a Green body. If you match the candle body color in the chart settings (or turn off the candles completely), you get a unique way of seeing how Bearish or how Bullish a candle is because the wick will now match the body size and color.
This indicator is very similar to our NSDT Special High-Low Candles.

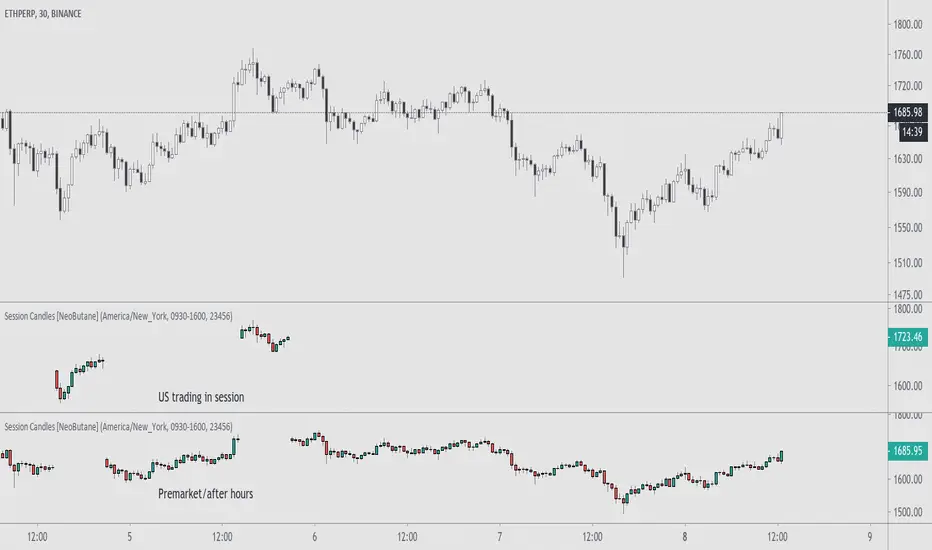
Trading Session Candles [NeoButane]█ OVERVIEW
Display candlesticks for the selected session, regular or extended.
█ CONFIGURATION
Options to change include displaying the regular or extended session, timezone, session hours, and session days.
█ CONCEPTS
Meant for charts with longer trading sessions or to view only extended hours trading action on US stocks that have afterhours available.
█ Notes
For trading days, '23456' refers to Monday to Friday.
Rate ConverterThis is a simple rate converter that can convert almost anything into almost anything else. It supports cryptocurrencies, currencies and most commodities.
On the chart we see the following:
USD (US Dollar) into EUR (Euro) as a candle stick chart
WTICO (West Texas Intermediate Crude Oil) into ISK (Icelandic Krona) as a bar chart
ADA (Cardano) into JMD (Jamaican Dollar) as a line chart
XPT (Platinum) into XAG (Silver) as a scatter plot
It supports plotting the rates as japanese candlesticks, bars, lines, or as a scatter plot.

.BXBT IndexThe current .BXBT index weighted as close as possible to BitMEX's with updates as BitMEX refreshes their index.
Difference between this and the script titled '2020 March 27 .BXBT Index': this one will receive updates because it doesn't have a date in its title.
Methodology
www.bitmex.com
"BitMEX Index Weights, assuming no constituent exchanges have been excluded due to Index Protection Rules, last updated 27 December 2019 at 12:00:05 UTC."
Binance: -
Bitstamp: 10.61%
Bittrex: 2.53%
Coinbase: 52.30%
Gemini: 6.89%
Huobi: -
Itbit: 4.21%
Kraken: 23.46%
Poloniex: -
ItBit's weight is combined with Gemini's due to ItBit not being on TradingView as of now. BITTREX:BTCUSD substituted with BITTREX:BTCUSDT*POLONIEX:USDTUSD to backfill because Bittrex only recently (late 2018) started to offer a fiat BTC/USD pair. Not that it matters since the index used in 2018 didn't include Bittrex if I remember correctly.
What is actually used for 27/12/2019 to 27/03/2020:
Binance: -
Bitstamp: 10.61%
Bittrex: 2.53%
Coinbase: 52.30%
Gemini: 11.10%
Huobi: -
Itbit: -
Kraken: 23.46%
Poloniex: -
Options:
Toggle candlesticks or close line
Change price source to be used for indicators
To be added: Change quarter to show indexes for different times, with labels that apply to the appropriate index used
Reasons to use this vs. the index itself: (not many)
It is helpful as a reference for other indicators or creation of an index.

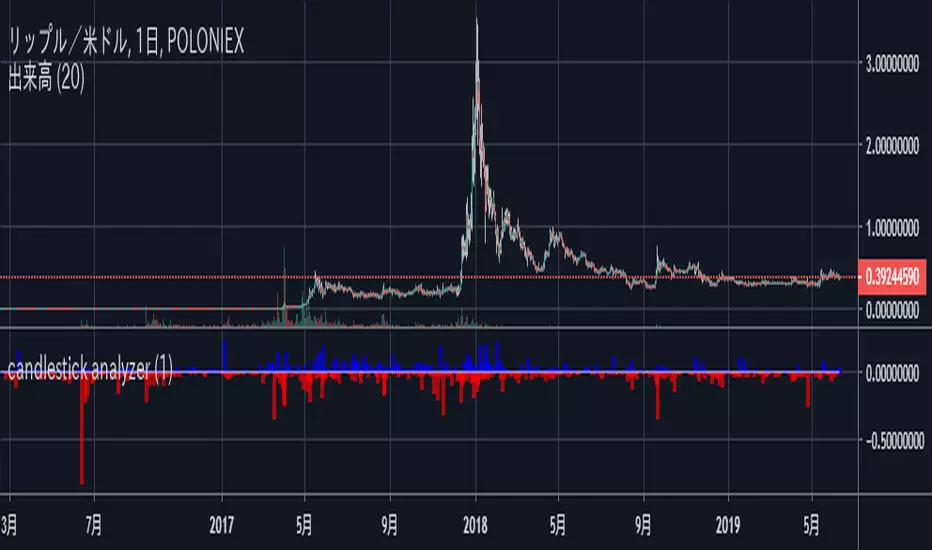
candlestick analyzerThis indicator measures lengths of shadows of candlesticks, which is defined as "(close - open+high - max(open,close))/(close - open+low - min(open,close))*(high-low) "
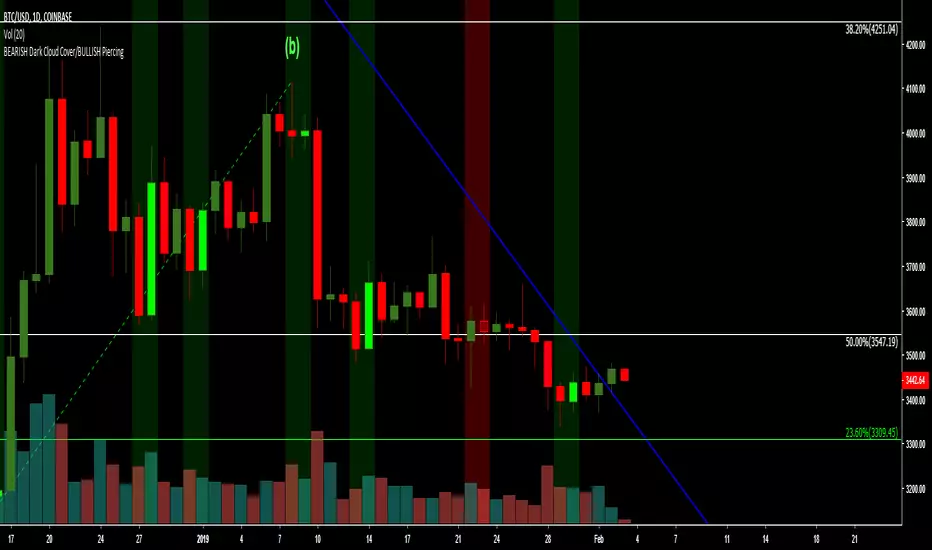
BEARISH Dark Cloud Cover/BULLISH PiercingThe script highlights the 2 candlesticks pattern: BEARISH Dark Cloud Cover/BULLISH Piercing on the main chart screen, and has a preset alert condition. Please use an oscillator that shows oversold and overbought conditions with this script (i.e. StochRSI oscillator).
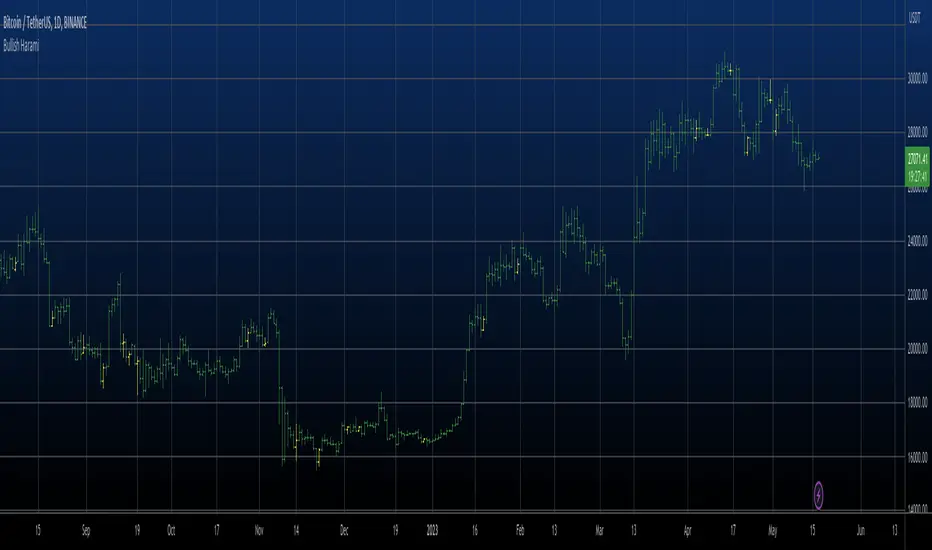
Bullish Harami Backtest This is a bullish reversal pattern formed by two candlesticks in which a small
real body is contained within the prior session's unusually large real body.
Usually the second real body is the opposite color of the first real body.
The Harami pattern is the reverse of the Engulfing pattern.
WARNING:
- For purpose educate only
- This script to change bars colors.

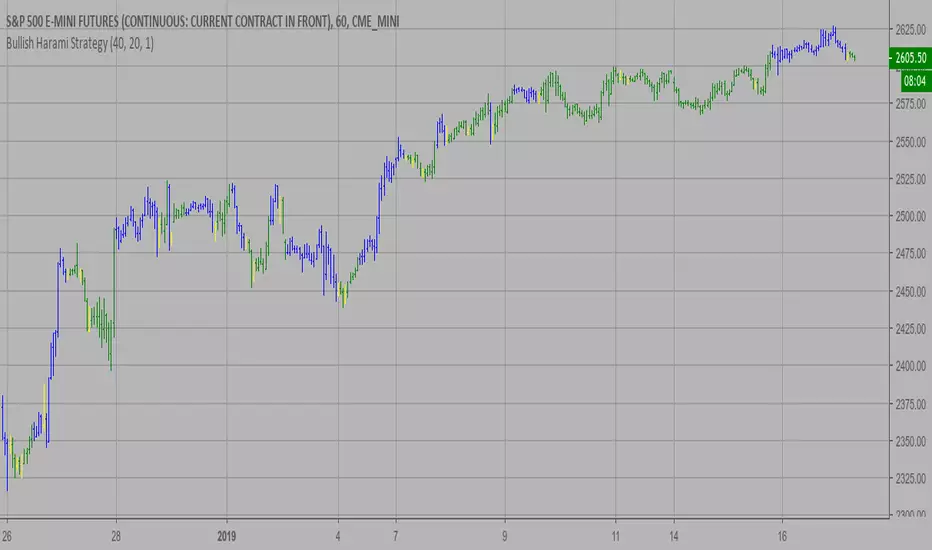
Bullish Harami Strategy This is a bullish reversal pattern formed by two candlesticks in which a small
real body is contained within the prior session's unusually large real body.
Usually the second real body is the opposite color of the first real body.
The Harami pattern is the reverse of the Engulfing pattern.
WARNING:
- This script to change bars colors.
Bearish Harami Backtest This is a bearish reversal pattern formed by two candlesticks in which a short
real body is contained within the prior session's long real body. Usually the
second real body is the opposite color of the first real body. The Harami pattern
is the reverse of the Engulfing pattern.
WARNING:
- For purpose educate only
- This script to change bars colors.

MA CandlesOHLC calculated with a moving average.
You can replace sma with anything. EMA, Hull, sma(sma(sma(sma(close, etc.
You could also make it look clean like Heikin Ashi candlesticks if you include min/max for low/high wicks on candles.

Bithumb Ticker USD/BTC PairConverts Bithumb tickers into USD or bitcoin pairings from KRW.
This currently uses the FX pair to convert. There is an option to toggle between candlesticks and line.


Bullish Harami automatic finding script Hi
Let me introduce my Bullish Harami automatic finding script.
This is a bullish reversal pattern formed by two candlesticks in which a small
real body is contained within the prior session's unusually large real body.
Usually the second real body is the opposite color of the first real body.
The Harami pattern is the reverse of the Engulfing pattern.
This pattern marked as yellow.
Full Dashboard V21 - Time Left Color LogicTable (Multi timefram)
- show Trend
- show rsi
- show Stoch
- show prev candle (default hide)
- show curr candle (default hide)
- shows the time when the candlestick will close.
--can config show/hide all column
Graph
- show rsi 89/21
Signal
- show signal with tp/sl (default hide)

Full Dashboard V20 - Pro PA & Stoch OVB/OVS StatusTable (Multi timefram)
- show Trend
- show rsi
- show Stoch
- show prev candle (default hide)
- show curr candle (default hide)
- shows the time when the candlestick will close.
--can config show/hide all column
Graph
- show rsi 89/21
Signal
- show signal with tp/sl (default hide)
