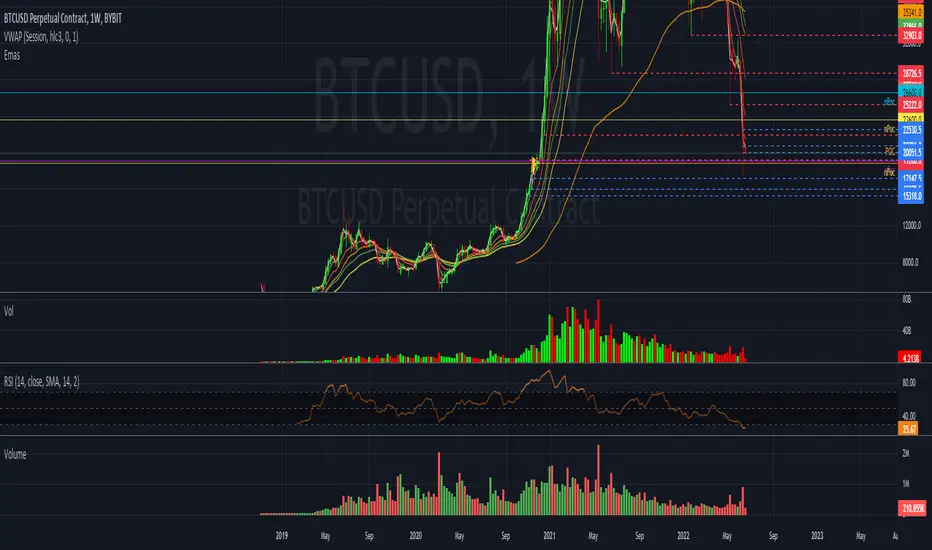
Volume Value per UnitThis script will plot the result of Volume / Close.
This is meant to normalize the volume of tickers with exponential growth, for example a ticker like $BTC that went from $1 to $50k. Having the volume divided by the close will normalize the volume for when the price was $1 and $50k.
Tìm kiếm tập lệnh với "Exponential"
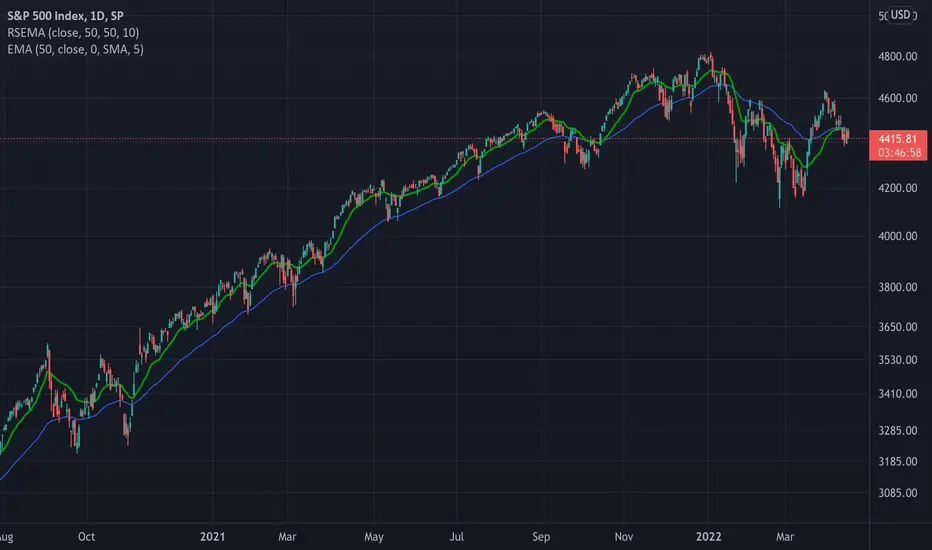
TASC 2022.05 Relative Strength Exponential Moving Average█ OVERVIEW
TASC's May 2022 edition Traders' Tips includes the "Relative Strength Moving Averages" article authored by Vitali Apirine. This is the code implementing the Relative Strength Exponential Moving Average (RS EMA) indicator introduced in this publication.
█ CONCEPTS
RS EMA is an adaptive trend-following indicator with reduced lag characteristics. By design, this was made possible by harnessing the relative strength of price. It operates in a similar fashion to a traditional EMA, but it has an improved response to price fluctuations. In a trading strategy, RS EMA can be used in conjunction with an EMA of the same length to identify the overall trend (see the preview chart). Alternatively, RS EMAs with different lengths can define turning points and filter price movements.
RS EMA is an adaptive trend-following indicator with reduced lag characteristics. By design, this was made possible by harnessing the relative strength of price. It operates in a similar fashion to a traditional EMA, but it has an improved response to price fluctuations.
█ CALCULATIONS
The following steps are used in the calculation process:
• Calculate the relative strength (RS) of a given length.
• Multiply RS by a chosen coefficient (multiplier) to adapt the EMA filtering the original time series. Calculate the EMA of the resulting time series.
The author recommends RS EMA(10,10,10) as typical settings, where the first parameter is the EMA length, the second parameter is the RS length, and the third parameter is the RS multiplier. Other values may be substituted depending on your trading style and goals.
Moving Average Exponential 100/200/400The most important exponential moving averages combined in a single indicator to save sapce on charts

Moving Average exponential by krishnam 200this is 200 ma exponential this can be used for large frame dynamic support and resistance in a trending market
Ehlers Error Correcting Exponential Moving Average [CC]The Error Correcting Exponential Moving Average was created by John Ehlers and Ric Way (Stocks & Commodities V. 28:11 (30-35)) and this is an excellent moving average that accurately identifies the trend and sticks with the price during trends or choppy periods pretty well. It looks back to find the best gain setting for each day that returns the smallest difference between the current price and the ema based on the gain setting and uses that day's info in it's total calculations and if there is a zero gain for the day then it is just a classic ema. I have included strong buy and sell signals in addition to normal ones so lighter colors are normal and darker colors are strong. Buy when the line turns green and sell when it turns red.
Let me know if there are any other indicators you would like to see me publish!

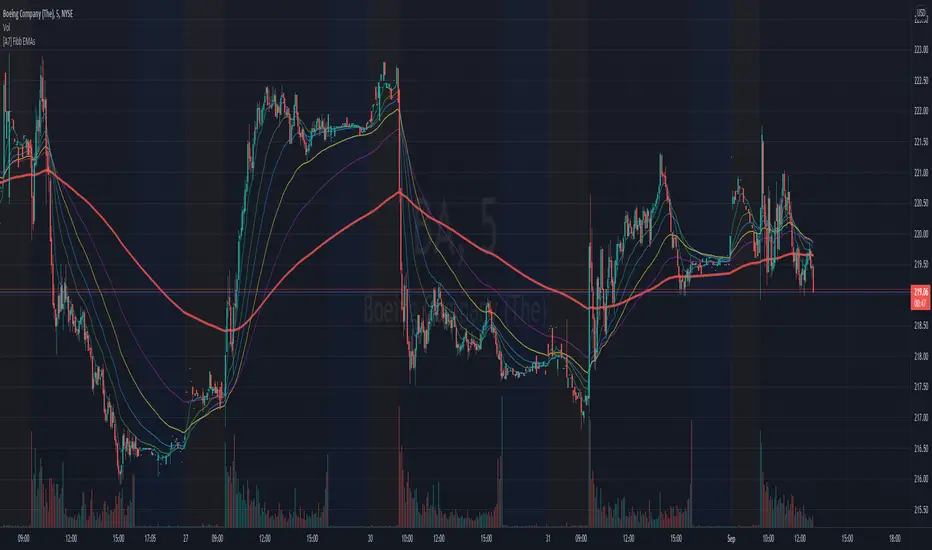
[A7] Fibonacci EMAs (8,21,34,55,89,233) Fibonacci EMAs (8,21,34,55,89,233)
Fibonacci Exponential Moving Averages
8 - aqua
21 - green
34 - blue
55 - yellow
89 - purple
233 - red
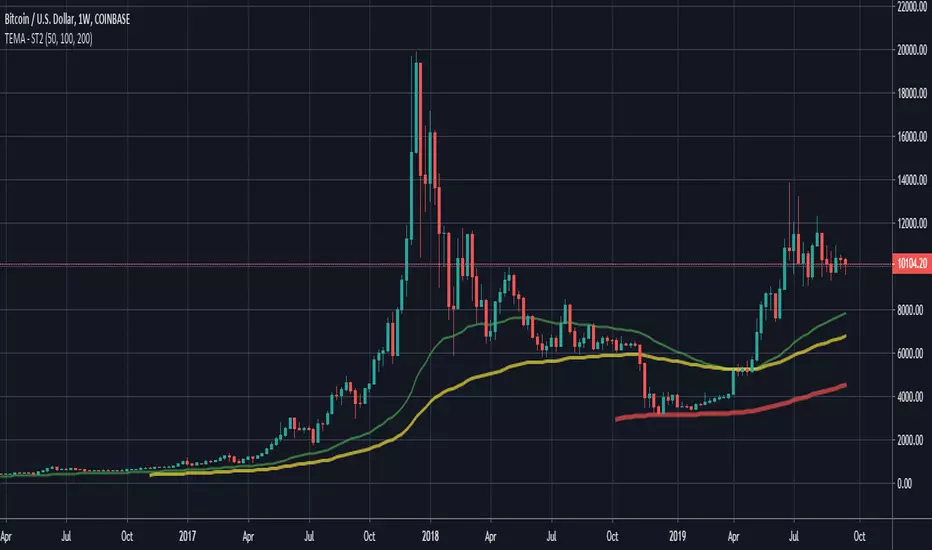
[bjb] tEMAs - Triple Exponential Moving Averages, by BlueJayBirdIs it not a pain in the butt not to find a simple script like this one in TV? I didn't find one, so I made it.
Features:
- Simple script with 3 simple Exponential Moving Averages.
Special features:
- Settable time resolution.
- Colored fill between EMA20/50 pair, and between EMA50/200 pair.
More useful than you think:
- I've found it specially useful for detecting Elliot Wave patterns. The fill colors make them stand out. Use EMA20/50 pair for this.
- The resolution change makes EMAs studies from higher timeframes, at lower time frames, more accurate. Try from 1m timeframe, setting the tEMAs resolution to 1h.
Like, follow and comment. 💯

Combo Backtest 123 Reversal & 2/20 Exponential MA This is combo strategies for get a cumulative signal.
First strategy
This System was created from the Book "How I Tripled My Money In The
Futures Market" by Ulf Jensen, Page 183. This is reverse type of strategies.
The strategy buys at market, if close price is higher than the previous close
during 2 days and the meaning of 9-days Stochastic Slow Oscillator is lower than 50.
The strategy sells at market, if close price is lower than the previous close price
during 2 days and the meaning of 9-days Stochastic Fast Oscillator is higher than 50.
Second strategy
This indicator plots 2/20 exponential moving average. For the Mov
Avg X 2/20 Indicator, the EMA bar will be painted when the Alert criteria is met.
WARNING:
- For purpose educate only
- This script to change bars colors.


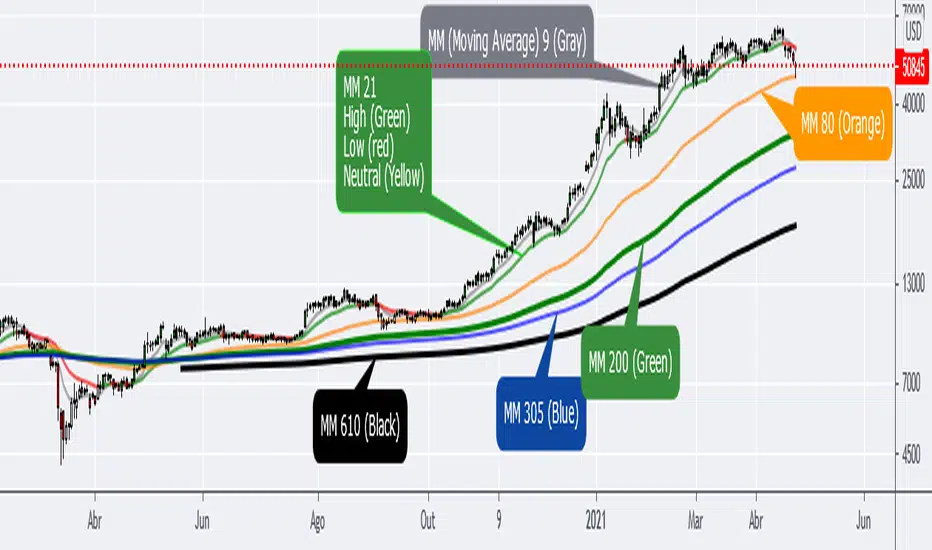
Devilpool Operational Moving Average ExponentialThis indicator contains the main exponential moving averages (9, 21, 80, 200, 305 and 610), which I use in my operational.
It was developed by my friend Giovani, who is a 10 note guy!
I hope he can help you on your journey to becoming a Professional Trader.
You can modify it the way you prefer, it is very simple.
Neste indicador estão reunidas as principais médias móveis exponenciais (9, 21, 80, 200, 305 e 610), que uso em meu operacional.
Ele foi desenvolvido por meu amigo Giovani, que é um cara nota 10!
Espero que ele possa ajudar a você na jornada para se tornar um Trader Profissional.
Você pode modifica-la do jeito que preferir, é muito simples.
Two Exponential Moving Average CrossUsed to track up and down trends by crossing two 9- and 72-period exponential moving averages


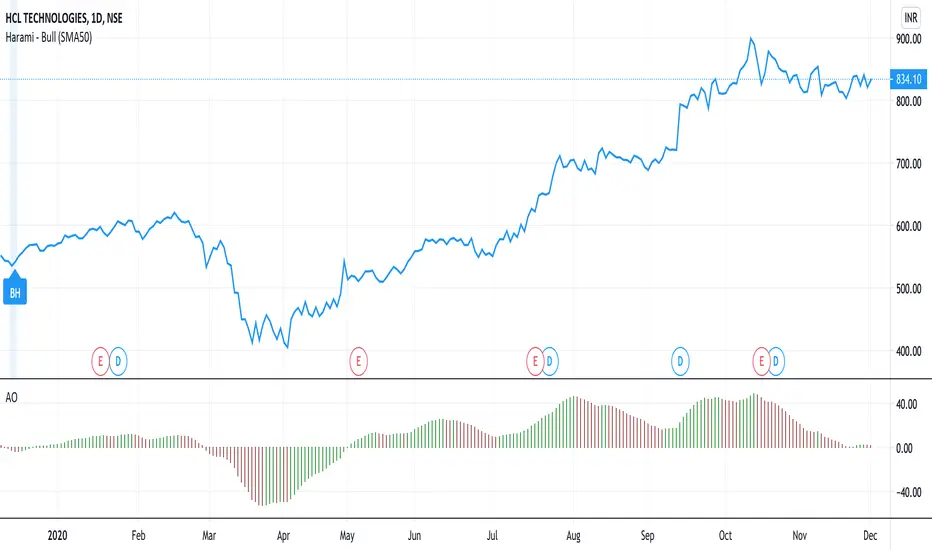
Awesome Oscillator - Exponential Moving AverageStandard Awesome Oscillator is SMA. I have created this with Exponential Moving Average
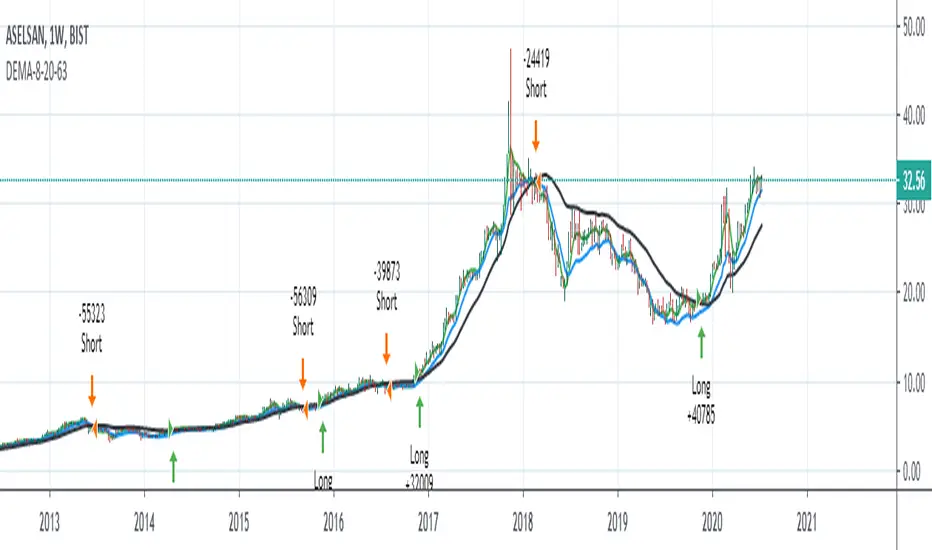
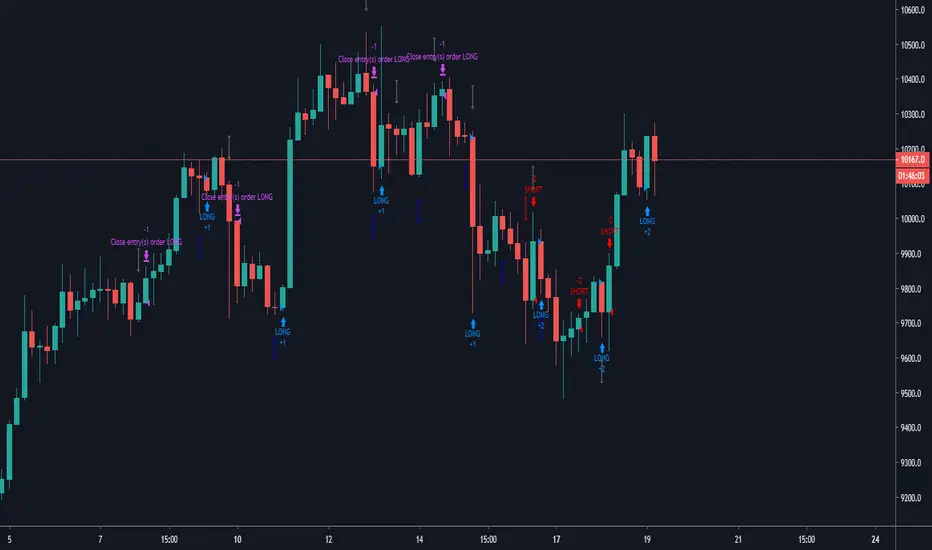
Double Exponential Moving Average 8-20-63 StrategyHello, this script was made upon the request of aliergin63, one of my followers.
I do not know exactly from whom it is quoted. (It may be author HighProfit.)
Long position when 8 dema is over 20 dema and 63 dema,
it opens a short position for the vice versa.
Alarms have been added.
%0.1 comission added.
Regards.
Note : DEMA = Double Exponential Moving Average
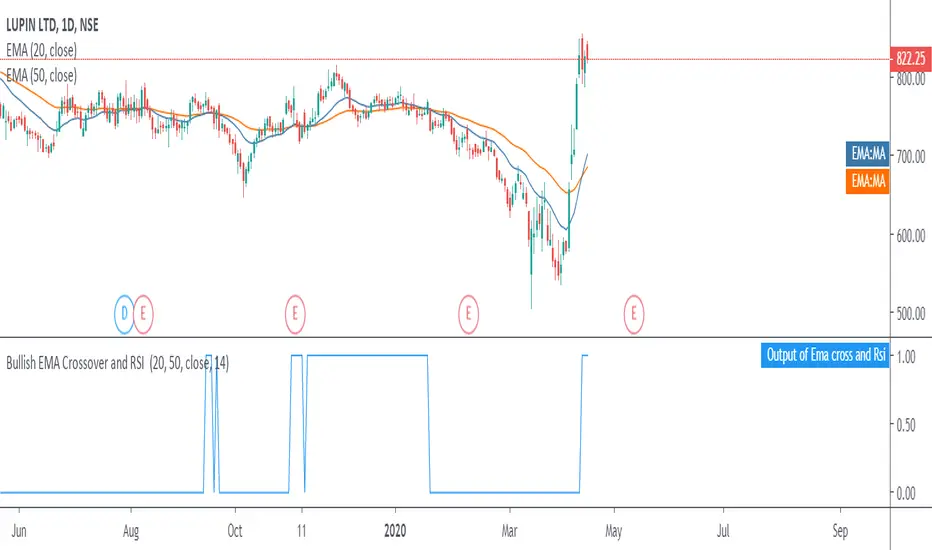
Moving Average Exponential crossover with bullish RSI signalsWhen the market is giving the signals for bullish trend, which shows the shorter period exponential(20) moving average crossing the longer period moving average(50), with a strength shown in the market i.e. RSI greater than 40.
So when all these conditions are met a buy signal is generated in output (Output of Ema cross and Rsi) having value as 1.
So a trader can enter into a long position when the value is 1 and exits a stock when value is 0.
This script is not to be used for selling the stocks in downtrend
Slow Heiken Ashi and Exponential Moving average Strategy 2.2Strategy using Slow Heiken Ashi by Glaz and Exponential moving averages. Looking for someone to help me turn the strategy into non-reoccuring alerts as I am having trouble doing so.
$0 Exponential & Simple MAs with HigherTFMultiple Moving Averages (Simple/SMA & Exponential/EMA) in one indicator
Support for a fixed time frame for the MAs
MAs default period length are key ones, provided by experienced traders in crypto, greetings to xpressive
Live update or Non-repainting modes support: with the non-repainting mode the previous candle's close is considered instead of latest/current bar's changing close
Features:
7 EMAs with editable length
4 SMAs with editable length
Choice of the price/data source from a predefined list
Activate or not the usage of an higher TF
Target Higher time frame resolution. Not using the predefined lists for more possibilities, e.g M1="M", H12="720", D3="3D", 5M="5"
Configurable lines' width in one setting. Hide or change the MAs color from the indicator's style settings

4 Exponential Moving Averages With Colors(100,300,600,1000)4 Exponential Moving Averages With Colors(100,300,600,1000) With Colors
To play with Scalper,Swing, intraday

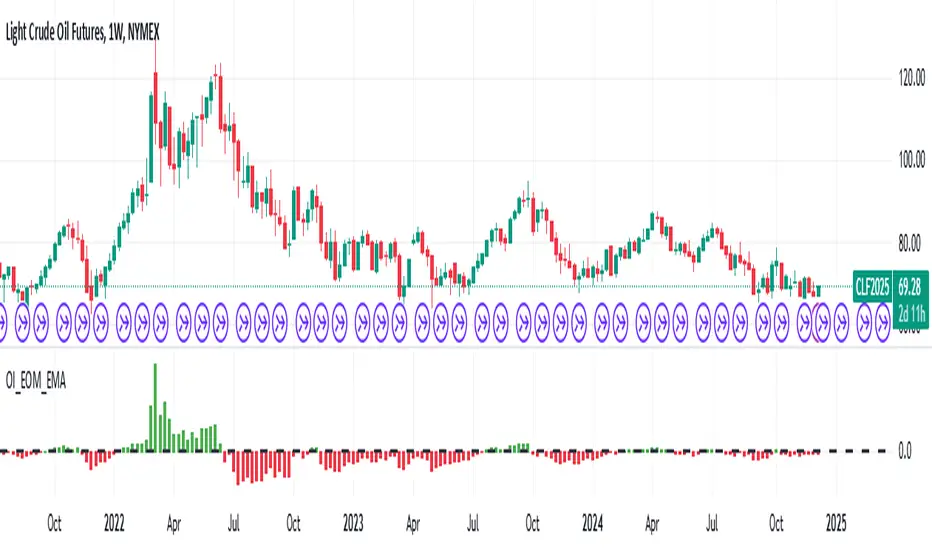
Open Interest Exponential Ease of MovementModified Ease of Movement :
* Open Interests used on Futures instead of Volume (Includes Bitcoin)
* Exponential Moving Average used instead of Simple Moving Average
* Division Number cancelled. (Division Number gives wrong signals inside strong trends.)
NOTE : This code is open source under the MIT License. If you have any improvements or corrections to suggest, please send me a pull request via the github repository github.com
Stay tuned. Best regards !
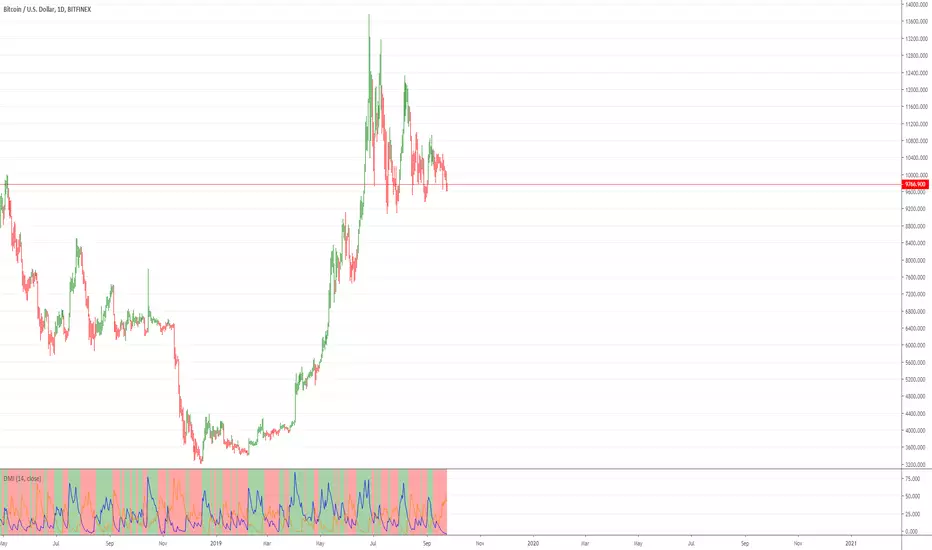
Directional Movement Index with double exponential moving averagThe Directional system is a trend-following method developed by J. Welles Wilder,
in the mid-1970s. It identifies trends and shows
when a trend is moving fast enough to make it worth following. It helps traders to
profit by taking chunks out of the middle of important trends.
Trading Rules
1. Trade only from the long side when the positive Directional line is above the
negative one. Trade only from the short side when the negative Directional line
is above the positive one. The best time to trade is when the ADX is rising, show-
ing that the dominant group is getting stronger.
2. When ADX declines, it shows that the market is becoming less directional. There
are likely to be many whipsaws. When ADX points down, it is better not to use
a trend-following method.
3. When ADX falls below both Directional lines, it identifies a flat, sleepy mar-
ket. Do not use a trend-following system but get ready to trade, because major
trends emerge from such lulls.
4. The single best signal of the Directional system comes after ADX falls below
both Directional lines. The longer it stays there, the stronger the base for the
next move. When ADX rallies from below both Directional lines, it shows that
the market is waking up from a lull. When ADX rises by four steps
from its lowest point below both Directional lines, it “rings a bell” on a
new trend . It shows that a new bull market or bear market is being
born, depending on what Directional line is on top.
5. When ADX rallies above both Directional lines, it identifies an overheated mar-
ket. When ADX turns down from above both Directional lines, it shows that the
major trend has stumbled. It is a good time to take profits on a directional trade.
If you trade large positions, you definitely want to take partial profits.
This particular version uses DEMA (double exponential moving averages) in attempt to catch moves sooner.
Scripting Tutorial 2 - Triple Exponential Moving AveragesThis script is for a triple exponential moving average indicator. It is meant as an educational script with well formatted styling, and references for specific functions.
Alpha-Decreasing Exponential Moving AverageThe alpha parameter of this moving average decreases with every new bar on the chart, so it will become more slowly and slowly in course of time. Can act like additional support/resistance line but works in an acceptable way on weekly and monthly timeframes only.

