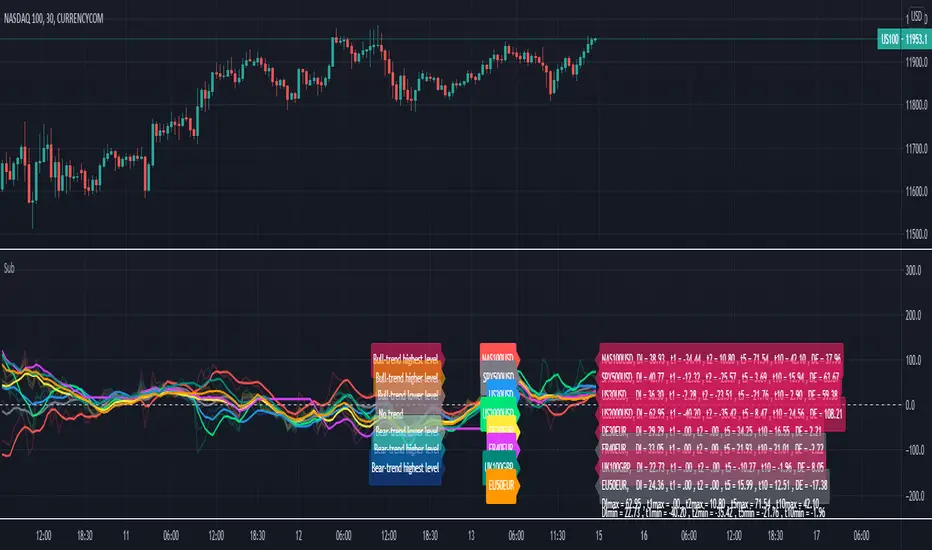
Relative Strength Index of EU and US Stock Index Trends quality//Relative Strength Index of European and US Stock Index Trends quality
//This indicator reveals the relative strength of European and US stock index futures.
//take Bull trend as an example , the current closed price>EMA20 value and the current closed price >20th previous bar closed price( deduction price),
//it's defined as a lower level bull trend .If the current price EMA20>EMA60, it's defined as a higher level bull trend .If the EMA20>EMA60>EMA120,it's defined as the highest level bull trend.
//You can choose to draw the curve with the deviation rate of the original major indexes to 20EMA, or draw the deviation rate with the average value (default value is 5 bars).
//In addition, a more technical method is added to analyze the deviation changes of the major indexes.The deviation rate changing velocity value, parameter tan (abbreviated by t) of 1, 2, 5, 10 is introduced.
//You can have the option of calculate the tan using average value of 5 candlesticks or original value.
//Taking tan1 as an example, it indicates how much the deviation rate between the current price and the previous candlestick has changed.
//The indicator of the index color and the description of the trend quality color can be switched off in option.
//In addition, this code color scheme is only suitable for black background (the code color needs to be changed by yourself if you use white background).
Tìm kiếm tập lệnh với "Futures"
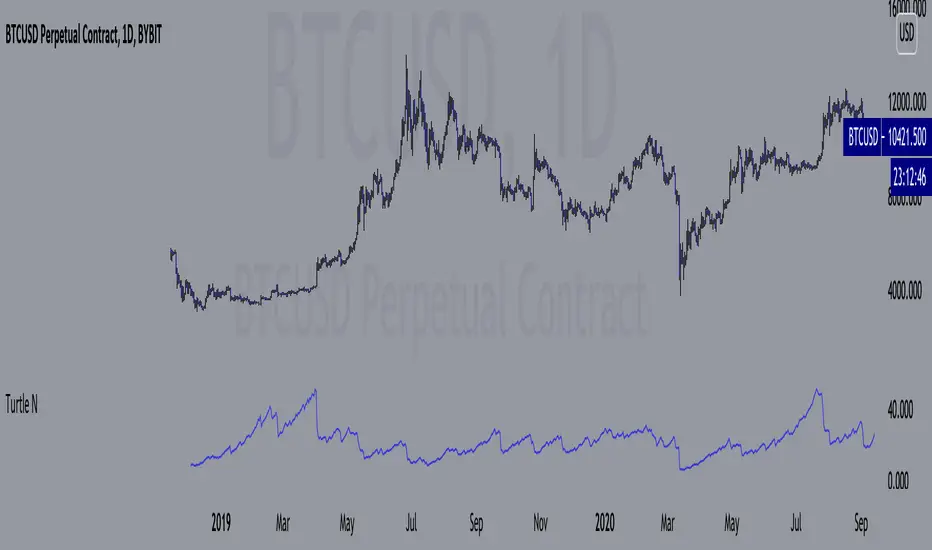
Turtle N NormalizedSimple script that calculates the normalized value of N. Rules taken from an online PDF containing the original Turtle system:
"The Turtles used a volatility-based constant percentage risk position sizing algorithm. The Turtles used a concept that Richard Dennis and Bill Eckhardt called N to represent the underlying volatility of a particular market.
N is simply the 20-day exponential moving average of the True Range, which is now more commonly known as the ATR. Conceptually, N represents the average range in price movement that a particular market makes in a single day, accounting for opening gaps. N was measured in the same points as the underlying contract.
The Turtles built positions in pieces which we called Units. Units were sized so that 1 N represented 1% of the account equity. Thus, a unit for a given market or commodity can be calculated using the following formula:
Unit = 1% of Account/(N x Dollars per Point)"
To normalize the Unit formula, this script instead takes the value of (close/N). Dollars per point = 1 for stocks and crypto, but will change depending on the contract specifications for individual futures.
"Since the Turtles used the Unit as the base measure for position size, and since those units were volatility risk adjusted, the Unit was a measure of both the risk of a position, and of the entire portfolio of positions."
When the value of N is high, volatility is low and you should be more risk-on.
When the value of N is low, volatility is high and you should be more risk-off.
Donchian Channel Strategy [for free bot]
I present to you a script for testing the Donchian channel breakout strategy for the Binance_exchange.
This strategy is trending, and is especially effective for trading cryptocurrency futures.
This strategy is very flexible, and you can configure virtually all possible parameters, moreover, separately for longs and separately for shorts.
In the script, you can configure the parameters of the channel for entry and exit, the exit method, enable or disable purchases / sales, specify take profit and stop loss, and more.
On the example of optimization, only 20% of the deposit is used. This is done for diversification, since there are 37 contracts on binance_futures (at the time of writing the script description). That is, by optimizing the parameters for different currencies, you can very well reduce risks.
Представляю Вам скрипт для тестирования стратегии пробоя канала Дончиана для биржи Бинанс.
Данная стратегия относится к трендовым, и особенно эффективная на торговли криптовалютных фьючерсов.
Данная стратегия очень гибкая, и можно настроить фактически все возможные параметры, при чем, отдельно для покупок и отдельно для продаж.
В скрипте можно настроить параметры канала на вход и на выход, метод выхода, разрешить или запретить покупки/проаджи, указать тейк-профит и стоп-лосс и другое.
На примере оптимизации используется всего 20% от депозита. Это сделано для диверсификации, так как на фьючерсах бинансе присутсвует 37 контрактов (на момент написания описания скрипта). Т.е., оптимизировав параметры под разные валюты, можно очень хорошо снизить риски.

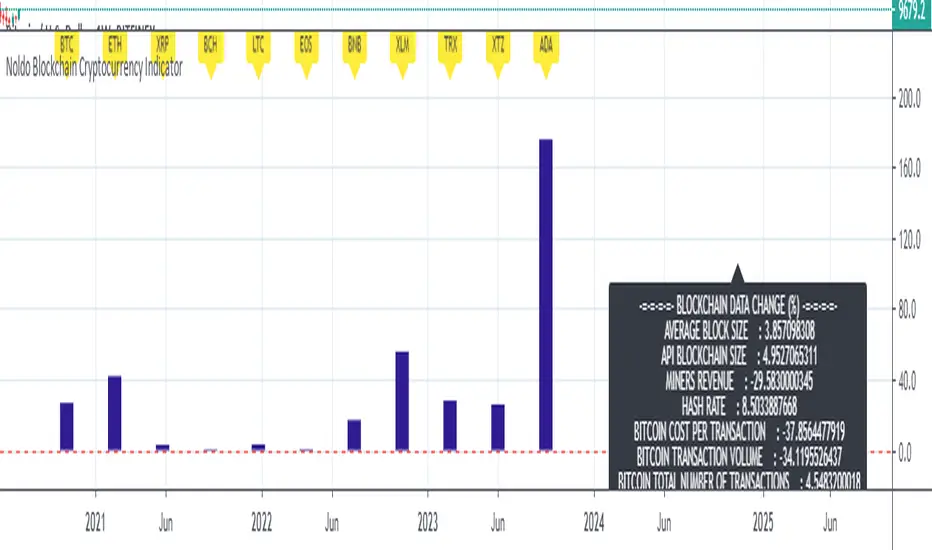
Noldo Blockchain Cryptocurrency Indicator
Hello, this script has the same logic as Noldo CFTC COT Forex Indicator :
And Noldo CFTC COT Commodities Indicator :
*
Script briefly calculates the period length between two signals of Pivot Reversal Strategy when new signal arrives and allows us to see relative Blockchain data and price changes of Major Cryptocurrencies over that automatic length.
This saves us from the hassle and time wasting of searching for a reference point.
Usage
This script works only on all Bitcoin / U.S Dollar pairs and futures.
It only works on 1W graphics.
ICOT data are pulled via Quandl
NOTE :
Since blockchain data is very votalile, 7-day ema values are adjusted to take into account.
Regards.

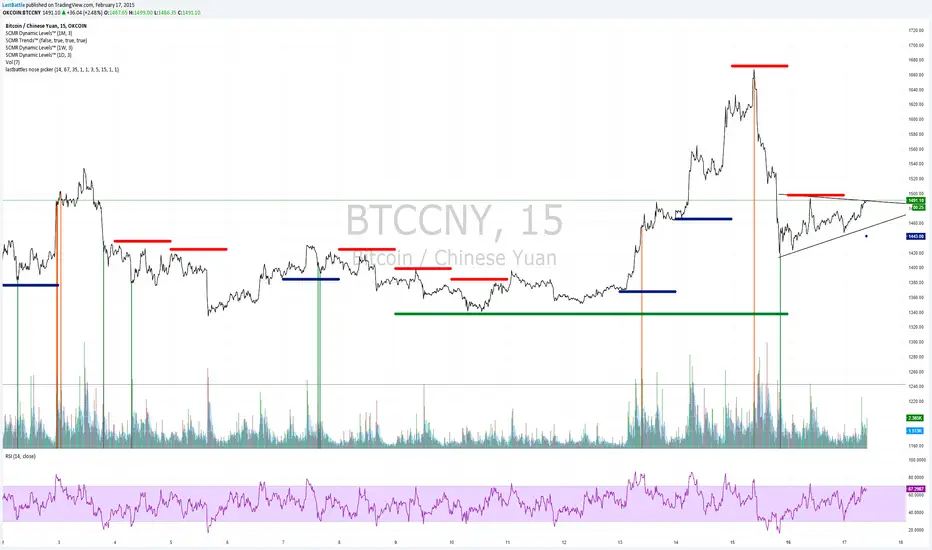
[Bitcoin] Lastbattle's nose pickerI've been working on a top and bottom picker script over the past couple of weeks, based on RSI of multiple timeframe closing price. It've been a pretty good trading system that's tested over the last meteoric rise from 220~270 and back down to 230 right now, and I think it should be released to the community.
Sure, I'm not worried about this strategy not working anymore after it is being used by the majority. Everyone have a different view of the market, and this is more towards psychology. It'll likely to hold for as long as there are still humans trading Bitcoins. Bitcoin market is full of emotions, you'll never run out of it.
So why does it work?
If you take a look at the live charts offered by Bitcoinwisdom and Cryptowatch, they only offer 1, 3, 5, and 15 minute timeframe by default with no other option to switch.
Naturally more traders will look at these levels for oversold and overbought condition.
The same indicator does not work for the broader commodities market such as Gold and Silver.
How does it work?
As long as the RSI levels of 1, 3, 5, and 15 minute fulfills the oversold/overbought level, a signal will be given.
The overbought/oversold level gets compensated the higher volatility the market is in.
Note: **
-This is only for exit strategy. If you're on long, consider reducing or exiting your position when it displays a red. On the other hand if you're short, consider reducing or covering your shorts if it shows a green.
-It may give false signal in a trending market, use your trading experience and judgement to filter them out. (eg: uptrend usually have more than 1 legs AND after a long consolidation, RSI gets to oversold/overbought easily... the market will tend to test the support/resistance again.)
-This is tuned for the 15m interval, the script won't work beyond this. I use it for scalping futures. Feel free to change or remove this line 'plot(interval == 15 and '
-Even if it shows a signal, it may not be the true top/bottom. Sometimes there may be a weak diverged leg aka 'last fart', so that's one reason I dont use this for entry until more confirmation is given via other indicators.
** If your chart is zooming all the way down to 0, right click on the price at the right and select 'Scale price only'
Go ahead and try this out with willy, etc and see what works better :D
Credits:
-LazyBear for the volatility switcher script
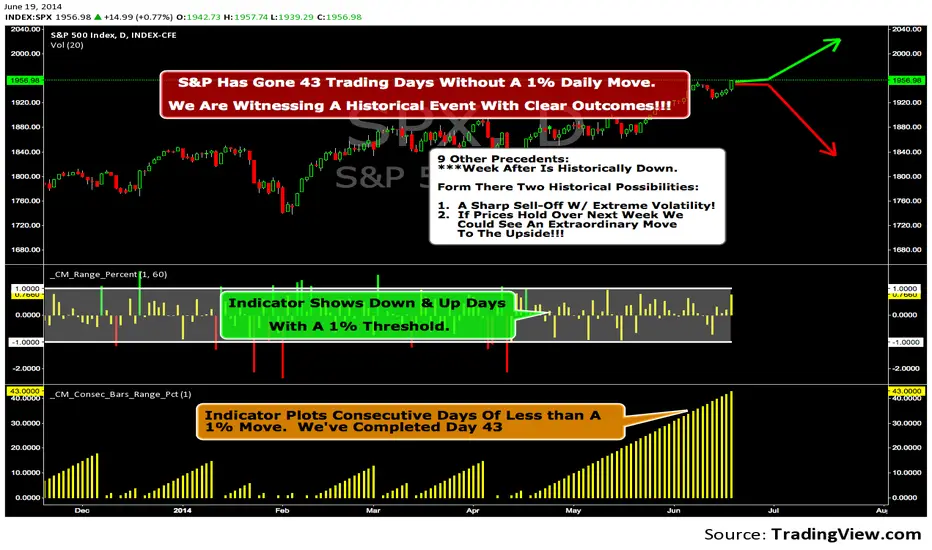
We Are Witnessing A Historical Event With A Clear Outcome!!!"Full Disclosure: I came across this information from www.SentimenTrader.com
I have no financial affiliation…They provide incredible statistical facts on
The General Market, Currencies, and Futures. They offer a two week free trial.
I Highly Recommend.
The S&P 500 has gone 43 trading days without a 1% daily move, up or down.
which is the equivalent of two months and one day in trading days.
During this stretch, the S&P has gained more than 4%,
and it has notched a 52-week high recently as well.
Since 1952, there were nine other precedents. All of
these went 42 trading days without a 1% move, all of
them saw the S&P gain at least 4% during their streaks,
and all of them saw the S&P close at a 52-week highs.
***There was consistent weakness a week later, with only three
gainers, and all below +0.5%.
***After that, stocks did better, often continuing an Extraordinary move higher.
Charts can sometimes give us a better nuance than
numbers from a table, and from the charts we can see a
general pattern -
***if stocks held up well in the following
weeks, then they tended to do extremely well in the
months ahead.
***If stocks started to stumble after this two-
month period of calm, however, then the following months
tended to show a lot more volatility.
We already know we're seeing an exceptional market
environment at the moment, going against a large number
of precedents that argued for weakness here, instead of
the rally we've seen. If we continue to head higher in
spite of everything, these precedents would suggest that
we're in the midst of something that could be TRULY EXTRAORDINARY.
Retail Forex Sentiment Fear/Greed CurrencyPairsRetail Forex Sentiment Fear/Greed CurrencyPairs
Overview
The Retail Forex Sentiment Indicator provides sentiment data for major and cross currency pairs. This indicator displays retail trader positioning using retail brokers data, showing what percentage of retail traders are long or short on each forex pair.
Important: Indicator Split Notice
---------------------------------
Due to TradingView's limitation of 40 data requests per indicator, the original Retail Sentiment Indicator has been split into TWO separate indicators you will find on TradingView:
1. This indicator - Specialized for Forex currency pairs (30+ pairs)
[2. Retail Sentiment Indicator - Multi-Asset CFD & Fear/Greed Index - For indices, commodities, cryptocurrencies, and Fear/Greed indices
Please look at both indicators to access all available sentiment data.
Methodology and Scale Calculation
---------------------------------
This indicator operates on a **-50 to +50 scale** with zero representing perfect market equilibrium.
Scale Interpretation:
- **Zero (0)**: Market balance - exactly 50% of traders long, 50% short
- **Positive values**: Majority long (buying) pressure
- Example: If 63% of traders are long, the indicator shows +13 (63 - 50 = +13)
- **Negative values**: Majority short (selling) pressure
- Example: If 92% of traders are short, the indicator shows -42 (50 - 92 = -42)
Features
--------
- **Auto-Detection**: Automatically loads sentiment data based on the current chart symbol
- **Manual Selection**: Choose from 30+ supported currency pairs when auto-detection is unavailable
- **Visual Zones**: Clear greed/fear zones with color-coded backgrounds (green for fear zone, red for greed zone - contrarian colors)
- **Daily Updates**: Live sentiment data from retail CFD providers
Supported Currency Pairs
========================
Major Pairs
-----------
- EURUSD (most traded pair globally)
- GBPUSD (Cable)
USD Pairs
---------
- USDJPY, USDCHF, USDCAD
- USDPLN
PLN (Polish Zloty) Pairs
------------------------
- USDPLN, EURPLN, GBPPLN, CHFPLN
EUR Cross Pairs
---------------
- EURJPY, EURCHF, EURCAD, EURAUD, EURNZD, EURGBP
GBP Cross Pairs
---------------
- GBPJPY, GBPCHF, GBPCAD, GBPAUD, GBPNZD
AUD (Australian Dollar) Pairs
-----------------------------
- AUDUSD, AUDJPY, AUDCHF, AUDNZD, AUDCAD
NZD (New Zealand Dollar) Pairs
------------------------------
- NZDUSD, NZDJPY, NZDCHF, NZDCAD
CAD Cross Pairs
---------------
- CADJPY, CADCHF
CHF Cross Pairs
---------------
- CHFJPY
How to Use
----------
1. **Auto Mode** (Default): Enable "Auto-load Sentiment Data" checkbox to automatically display sentiment for the current chart's currency pair
2. **Manual Mode**: Disable auto-load and select from the dropdown menu for specific currency pairs
3. **Interpretation**:
- Values above 0 (green line) indicate retail traders are net long (greed/bullish sentiment)
- Values below 0 (red line) indicate retail traders are net short (fear/bearish sentiment)
- Extreme zones (+35 to +50 and -35 to -50) indicate strong positioning
Trading Strategy & Market Philosophy
====================================
Contrarian Trading Approach
---------------------------
The primary purpose of this indicator is based on the fundamental market principle that **the majority of retail forex traders are wrong most of the time**, and currency pairs typically move opposite to the positions held by the majority of retail participants.
Key Strategy Guidelines:
- **Contrarian Signal**: When the majority of retail traders are positioned on one side, consider opportunities in the opposite direction
- **Trend Exhaustion Signal**: When retail traders finally flip to trade WITH an established trend after being wrong for extended period, this often signals trend exhaustion
Interpretation Examples:
- High greed readings (majority long) -> Consider short opportunities
- High fear readings (majority short) -> Consider long opportunities
- Sudden sentiment flip during established trends -> Potential trend reversal signal
Forex-Specific Notes
====================
Currency Correlations
---------------------
When analyzing forex sentiment, consider that:
- USD pairs often move together (if retail is long EURUSD, they're often short USDJPY)
- Cross pairs can provide confirmation signals
- Comparing sentiment across related pairs can reveal broader positioning
Auto-Detection Support
----------------------
The indicator supports automatic detection of various broker ticker formats including:
- Standard pairs (EURUSD, GBPUSD, etc.)
- CME Futures symbols (6E, 6B, JY, etc.)
- Micro futures (M6E, M6B, MJY, etc.)
This functionality is powered by regex pattern matching. However, for some CME futures pairs—particularly those involving JPY, CAD, and CHF—auto-detection may not work properly. In such cases, disable the auto-load checkbox and manually select the ticker from the dropdown menu.
Technical Notes
---------------
- Built with PineScript v6
- Dynamic symbol detection with fallback options
- Optimized for performance with minimal resource usage
- Color-coded visualization with customizable zones
Data Sources
------------
This indicator uses curated sentiment data from retail CFD providers. Data is updated regularly and sourced from reputable financial data providers.
Data Infrastructure Status
--------------------------
Current Data Upload Process:
Please note that sentiment data uploads may occasionally experience minor interruptions. However, this should not pose significant issues as sentiment data typically changes gradually rather than rapidly.
Acknowledgments
---------------
We extend our gratitude to **TradingView** for enabling the use of custom data feeds based on GitHub repositories, making this comprehensive forex sentiment analysis possible.
Disclaimer
----------
This indicator is for educational and informational purposes only. Sentiment data should be used as part of a comprehensive trading strategy and not as the sole basis for trading decisions. Past performance does not guarantee future results. The contrarian approach described is a market theory and may not always produce profitable results. Forex trading involves significant risk of loss.

BTC Fundamental Value Hypothesis [OmegaTools]BTC Fundamental Value Hypothesis is a macro-valuation and regime-detection model designed to contextualize Bitcoin’s price through relative market-cap comparisons against major capital reservoirs: Gold, Silver, the Altcoin market, and large-cap equities. Instead of relying on traditional on-chain metrics or purely technical signals, this tool frames BTC as an asset competing for global liquidity and “store-of-value mindshare”, then estimates an implied fair value based on how BTC historically coexists (or diverges) from these benchmark universes.
Core concept: relative market-cap anchoring
The indicator builds a reference-based fair price by translating external market capitalizations into implied BTC valuation using a dominance framework. In practice, you choose one or more reference universes (Gold, Silver, Altcoins, Stocks). For each selected universe, the script computes how large BTC “should be” relative to that universe (dominance ratio), and converts that into an implied BTC price. The final fair price is the average of the implied prices from the enabled universes.
Two dominance modes: automatic vs manual
1. Automatic Dominance % (default)
When enabled, the model estimates dominance ratios dynamically using a 252-period simple moving average of BTC market cap divided by each reference market cap. This produces an adaptive baseline that follows structural changes over time and reduces sensitivity to short-term spikes.
2. Manual Dominance %
If you prefer a discretionary macro thesis, you can directly input dominance parameters for each reference universe. This is useful when you want to stress-test scenarios (e.g., “BTC should converge toward X% of Gold’s market cap”) or align the model with a specific long-term adoption narrative.
Reference universes and data construction
- BTC market cap: pulled from CRYPTOCAP:BTC.
- Gold and Silver market caps: derived from the corresponding futures symbols (GC1!, SI1!) multiplied by an assumed total above-ground quantity (constant tonnage converted to troy ounces). This provides a practical and tradable proxy for spot valuation context.
- Altcoin market cap: pulled from CRYPTOCAP:TOTAL2 (total crypto market excluding BTC).
- Stocks market cap proxy (Σ3): a deliberately conservative equity benchmark built from three mega-cap stocks (AAPL, MSFT, AMZN) using total shares outstanding (request.financial) multiplied by price. This avoids index licensing complexity while still tracking a meaningful slice of global equity beta/liquidity.
Valuation output: overvalued vs undervalued (log-based)
The valuation readout is expressed as a percentage derived from the logarithmic distance between BTC price and the model’s fair price. This choice makes valuation comparable across long time horizons and reduces distortion during exponential growth phases. A positive valuation indicates BTC trading below the model’s implied value (undervalued), while a negative valuation indicates trading above it (overvalued).
Oscillator: relative momentum and regime confirmation
In addition to fair value, the indicator includes a momentum differential oscillator built from RSI(50):
- BTC RSI is compared to the average RSI of the selected reference universes.
- The oscillator highlights when BTC strength is leading or lagging the broader macro benchmarks.
- Color is rendered through a gradient to provide immediate regime readability (risk-on vs risk-off behavior, expansion vs contraction phases).
Visualization and UI components
- Fair Price overlay: the computed fair price is plotted directly on the BTC chart for immediate comparison with spot price action.
- Valuation shading: the area between price and fair price is filled to visually emphasize dislocation and potential mean-reversion zones.
- Oscillator panel: a zero-centered oscillator with filled bands helps you identify persistent trend regimes versus transitional conditions.
- Summary table: a right-side table displays the current valuation (over/under) and, when Automatic mode is enabled, the live dominance ratios used in the model (BTC/GOLD, BTC/SILVER, BTC/ALTC, BTC/STOCKS).
How to use it (practical workflows)
- Macro valuation context: use fair price as a structural anchor to assess whether BTC is trading at a premium or discount relative to external liquidity baselines.
- Regime filtering: combine valuation with the oscillator to distinguish “cheap but weak” from “cheap and strengthening” (and the inverse for tops).
- Mean-reversion mapping: large, persistent deviations from fair value often highlight speculative extremes or capitulation zones; this can support systematic entries/exits, position sizing, or hedging decisions.
- Scenario analysis: switch to Manual Dominance % to model adoption outcomes, policy-driven shifts, or multi-year re-rating assumptions.
Important notes and limitations (read before use)
- This is a hypothesis-driven macro model, not a literal intrinsic value calculation. Results depend on dominance assumptions, proxies, and data availability.
- Gold/Silver market caps are approximations based on futures pricing and fixed supply constants; real-world supply dynamics, above-ground estimates, and spot/futures basis can differ.
- The Stocks (Σ3) benchmark is a proxy and intentionally not “the whole market”. It is designed to represent a large-cap liquidity reference, not total equity capitalization.
- Always validate signals with additional context (market structure, volatility regime, risk management rules). This indicator is best used as a macro layer in a broader decision framework.
Designed for clarity, macro discipline, and repeatability
BTC Fundamental Value Hypothesis by OmegaTools is built for traders and investors who want a clean, data-driven way to interpret BTC through the lens of competing asset classes and capital flows. It is particularly effective on higher timeframes (Daily/Weekly) where macro relationships are more stable and valuation signals are less noisy.
© OmegaTools, Eros

Weekly High/Low Day StatisticsThis indicator analyzes historical price data to determine which day of the week (Monday through Friday) most frequently hosts the weekly high and low prices. It provides overall counts, percentages, and the total number of weeks analyzed. Ideal for traders studying seasonal or day-of-week patterns in markets like futures (e.g., ES1!, NQ1!) or stocks (e.g., SPY).
Key Features:
Overall Statistics: Aggregates data across all available history, including the current partial week if applicable.
High/Low Tracking: Counts how many times each day was the weekly high or low, with percentages calculated over the total weeks.
Tie Handling: Uses the first occurrence in case of price ties (e.g., if multiple days hit the same high, the earliest day is credited).
Futures-Friendly: Utilizes time_tradingday for accurate day-of-week detection on continuous contracts like ES1!, accounting for session timings in UTC.
Table Display: Results are presented in a clean, semi-transparent table in the top-right corner, with columns for counts, percentages, and a total weeks summary.
Dynamic Updates: Processes all available historical bars on daily (1D) charts, supporting deep history (e.g., back to 2001 for ES1!). Note: On intraday timeframes, historical depth may be limited by TradingView's bar constraints.
How It Works:
The script iterates through daily bars, identifying the start of each new week via ta.change(time("W")). It tracks the highest and lowest prices within each week and assigns them to the corresponding trading day. At the end of each complete week, it tallies the results. The current incomplete week is included for real-time relevance.
Percentages are calculated as: (Count / Total Weeks) * 100, rounded to one decimal place.
Usage Tips:
Recommended Timeframe: Daily (1D) for maximum historical analysis. Works on intraday charts but with shallower data.
Symbols: Best for markets trading Monday-Friday, like indices, futures, or equities. Sunday/Saturday data is ignored as it's typically non-trading.
Customization: If ties should favor the last day instead, modify the comparison operators from >/< to >=/<= in the update logic.
Performance: Efficient for large datasets; no max_bars_back needed as it avoids deep historical references.
This tool can help uncover patterns, such as whether Fridays tend to be highs in bullish markets or Mondays lows during volatility. Use it alongside other indicators for comprehensive strategy building. Feedback welcome—feel free to suggest improvements!

Daily Inputs - The Prometheus InitiativeDaily ES inputs from the Prometheus Initiative is a clean, customizable overlay indicator designed specifically for ES (S&P 500 E-mini futures) day traders who rely on manually selected key price levels each session.
Instead of spending time manually drawing horizontal lines every day, this tool lets you quickly input the daily price levels directly in the settings and instantly see them plotted as horizontal lines across your chart.
Key Features:
• 15 fully editable price inputs with customizable settings.
Why this indicator was created:
Manually drawing 10–15 lines each morning is time-consuming. This indicator was developed to eliminate that friction — allowing fast, accurate plotting of levels so you can focus on execution rather than drawing tools. The largest benefit is that you can toggle the indicator on/off to keep a clean chart as to not interfere with your existing visual levels.
Perfect for:
- ES / NQ futures traders
- Anyone who wants a clean, no-nonsense way to visualize custom horizontal levels
How to use:
1. Add to your chart
2. Open Settings → Enter the daily levels provided
3. Watch price interact with the levels!
Note: This is a manual input tool. Levels do NOT auto-calculate. It's meant to reflect the exact levels posted each day.
Happy trading! 📈
Feel free to leave feedback or suggestions in the comments.
Disclaimer: This indicator is for educational/visual purposes only. Trading futures involves substantial risk of loss and is not suitable for all investors.

RS Score (1-100) vs NQ/ES/YM - TP# RS Score (1–100) vs NQ/ES/YM — How to Use & Interpret
## What this indicator is doing
It gives you a **single score from 1 to 100** that tells you whether a stock is acting like a **leader** or a **laggard** compared to the **overall U.S. market** (Nasdaq + S&P + Dow), using about **1 year of data**.
---
## The core idea: “Is this stock beating the market?”
This script compares your stock to a blended benchmark of:
* **Nasdaq futures (NQ)**
* **S&P futures (ES)**
* **Dow futures (YM)**
### Why that matters
A stock can be going up, but if the market is going up faster, the stock is **not a leader**.
This tool answers:
* “Is this stock outperforming the big market?”
* “Is it doing it consistently, or is it just wild and noisy?”
---
## What the 1–100 score means
Think of **50** as the “middle line.”
### The most important rule
* **Above 50 = outperforming the market blend**
* **Below 50 = underperforming**
* **Around 50 = roughly market-like**
### Easy interpretation bands
* **80–100 (Strong Leader):** stock is outperforming the market clearly and consistently
* **60–80 (Healthy):** generally outperforming, decent leadership
* **45–60 (Neutral-ish):** not special, close to market performance
* **30–45 (Weak):** lagging the market
* **1–30 (Very Weak):** strong underperformance
**Think “leaders live above 50,” and “real leaders tend to stay 70+.”**
---
## Why this score is “smarter” than just comparing returns
This script doesn’t just ask *“did it outperform?”*
It also asks *“did it outperform in a clean, steady way?”*
So it penalizes:
* choppy, unstable performance
* “one lucky spike” moves
That’s why it’s great for finding **higher-quality leadership**.
---
## Timeframe consistency: why it works on Daily, Weekly, Monthly
You added **Lock to last completed Daily bar**.
That means:
* it uses the **same daily reference point** no matter what chart timeframe you switch to
* your RS score won’t “walk around” just because the current day/week/month is still forming
**Practical meaning:**
If your score says 72, it should be 72 whether you’re looking at Daily, Weekly, or Monthly (as of the last completed day).
---
## The “RS New High” marker (NH) — what it’s telling you
The marker shows when your RS score hits a **new high** over your chosen lookback period (default ~252 trading days).
### In plain terms:
> “This stock is now showing its strongest relative performance vs the market (in about a year).”
### Why it’s powerful
A lot of the best leaders:
* show RS new highs **before** price breaks out
* or show RS new highs **during** breakouts
**So NH is a “leadership confirmation” signal.**
### How to use NH in real life
* **Best case:** RS hits a new high **while price is near breakout levels**
→ this often means institutions are accumulating and the stock is acting like a leader
* **Okay case:** price makes new highs but RS does not
→ stock is rising, but it’s not leading (could still work, but less attractive)
---
## Divergences: when RS and price disagree
This is one of the most useful ways to use RS.
### Bearish divergence (warning)
**Price makes a higher high, but RS makes a lower high.**
In simple terms:
> “The stock is still going up, but it’s losing leadership versus the market.”
This often shows up before:
* pullbacks
* breakout failures
* trend weakening
* rotation into stronger names
**It’s a caution sign, not an automatic sell.**
### Bullish divergence (early strength)
**Price makes a lower low, but RS makes a higher low.**
In simple terms:
> “The stock is holding up better than the market — strength is building underneath.”
This can happen before:
* reversals
* strong bounce setups
* early leadership emergence
---
## How to use this indicator in a simple trading workflow
### 1) Screening (finding leaders)
When scanning charts:
* Prefer stocks **above 50**
* Strong candidates are typically **70+**
* Bonus points if you see **NH markers** recently
**Quick rule:**
If RS < 50, it’s usually not worth your time unless you’re hunting deep value turnarounds.
---
### 2) Breakouts (confirming quality)
When a stock is near a breakout point:
* You want RS to be **rising**
* Ideally RS is near highs or prints **NH**
If price breaks out but RS is weak:
* it’s more likely to be a “meh breakout”
* sometimes it works, but it’s less “leader-like”
---
### 3) Managing positions (leadership health check)
If you’re already holding:
* RS staying high and rising = healthy leadership
* RS rolling over while price still rises = **possible early warning**
* RS plunging under 50 = the stock is now **lagging the market** (big red flag)
---
## Common “mistakes” and how to avoid them
### Mistake 1: Thinking RS > 50 means “guaranteed winner”
No — it means it’s acting **stronger than the market**, but price action still matters.
Use it with:
* trend structure
* volume/accumulation
* breakout levels
### Mistake 2: Overreacting to one divergence
One divergence is a warning.
You want confirmation like:
* failed breakout
* heavy sell volume
* loss of key moving averages
* repeated RS lower highs
### Mistake 3: Comparing RS values across totally different markets without context
RS works best when:
* comparing stocks within the same broad market environment
* keeping the same benchmark blend and same lookback
---
## Simple cheat sheet
* **RS > 50:** outperforming market (good)
* **RS 70–100:** leader zone
* **NH marker:** strongest relative strength in lookback window (leadership confirmation)
* **Price HH + RS LH:** bearish divergence (leadership weakening)
* **Price LL + RS HL:** bullish divergence (strength building)
Thank you!

STAX# STAX - MapleStax Candle by Candle Automation
## Overview
STAX is a trend-following indicator that automates the "MapleStax Candle by Candle (CBC)" methodology for futures and equity trading. This system uses a higher timeframe anchor trend combined with lower timeframe execution filters to identify high-probability pullback entries in the direction of the prevailing trend.
## How It Works
### 1. Anchor Trend Detection (10-Minute CBC Flip)
The core of this system is the CBC (Candle by Candle) flip logic on the anchor timeframe (default: 10 minutes):
- **Bullish Flip**: Occurs when a 10m candle closes ABOVE the high of the previous 10m candle
- **Bearish Flip**: Occurs when a 10m candle closes BELOW the low of the previous 10m candle
- Once a flip occurs, the trend remains in that direction until an opposite flip happens
The anchor trend is calculated using `request.security()` with `lookahead=barmerge.lookahead_off` and indexed historical data ` ` to ensure non-repainting behavior. This means signals will not change or disappear after they appear.
### 2. Execution Filters (Current Timeframe)
On your current chart timeframe (recommended: 3 minutes), the indicator applies two key filters:
**EMA Confirmation**:
- For LONG signals: 9-period EMA must be greater than 20-period EMA
- For SHORT signals: 9-period EMA must be less than 20-period EMA
**VWAP Filter** (Strict or Target mode):
- **Strict Mode** (default): Only shows signals when price is on the correct side of VWAP
- LONG signals only above VWAP
- SHORT signals only below VWAP
- **Target Mode**: Shows all valid signals but uses VWAP as the take profit target when price is on the "wrong" side
### 3. Entry Signal Logic
The indicator looks for pullback entries:
- **BUY Signal**: 10m trend is Bullish + EMA 9 > 20 + Current 3m candle is RED (close < open)
- Logic: Wait for a red pullback candle in a bullish trend with bullish EMA alignment
- **SELL Signal**: 10m trend is Bearish + EMA 9 < 20 + Current 3m candle is GREEN (close > open)
- Logic: Wait for a green retracement candle in a bearish trend with bearish EMA alignment
This pullback logic helps you enter after a brief counter-trend move, improving risk/reward compared to chasing breakouts.
### 4. Risk Management
**Stop Loss**: Automatically set at the previous 10-minute candle's low (for longs) or high (for shorts). This represents the last swing point that would invalidate the trend structure.
**Take Profit**:
- When aligned with VWAP: Fixed tick-based target (default: 20 ticks, adjustable)
- When counter to VWAP: Target is VWAP itself, providing a logical profit target
The indicator displays TP and SL levels visually and alerts when they are hit.
### 5. Signal Management
To prevent over-trading, the indicator includes a **cooldown period** (default: 10 bars minimum between signals). This stops signal spam in choppy conditions and forces you to wait for the market to develop before taking another trade.
### 6. Time Session Filters
Two separate trading sessions can be configured with 12-hour clock inputs:
- **Session 1**: Default 9:30 AM - 4:00 PM (New York regular hours)
- **Session 2**: Optional second session for extended hours or different time zones
Signals only appear during enabled sessions, helping you trade during liquid market hours.
## What Makes This Original
This indicator automates a specific methodology (MapleStax CBC) that combines multiple proven concepts:
1. Higher timeframe trend structure (CBC flip logic)
2. Lower timeframe execution timing (EMA filters)
3. Pullback entry strategy (counter-colored candles)
4. Volume-based target selection (VWAP integration)
5. Swing-based stop placement (previous anchor swing points)
The combination of these elements into an automated system with visual feedback and alert functionality is what provides value beyond using these indicators separately.
## How to Use
1. **Choose Your Timeframes**:
- Anchor timeframe: 10 minutes (adjustable) for trend direction
- Execution timeframe: 3-5 minutes recommended for entries
2. **Select VWAP Mode**:
- **Strict Mode**: More conservative, only trades with VWAP bias
- **Target Mode**: More aggressive, uses VWAP as profit target
3. **Configure Sessions**: Enable Session 1 and optionally Session 2 to match your trading hours
4. **Set Risk Parameters**: Adjust take profit ticks based on your instrument and risk tolerance
5. **Watch for Signals**:
- Green "BUY" label below bars = Long entry
- Red "SELL" label above bars = Short entry
- Dashed red line = Stop loss level
- Green "TP ✓" or Red "SL ✗" labels show exit points
6. **Monitor the Status Table**: The table in the top-right shows:
- Current 10m trend direction
- EMA alignment status
- VWAP position
- Active session status
- Current signal state
- Active trade information
7. **Set Alerts**: Use TradingView's alert system with the built-in alert conditions:
- BUY Signal
- SELL Signal
- Take Profit Hit
- Stop Loss Hit
## Best Practices
- **Recommended Timeframes**: 3m execution chart with 10m anchor works well for active trading
- **Instrument Selection**: Works best on liquid futures contracts (ES, NQ, CL, etc.) and major forex pairs
- **Session Trading**: Enable Session 1 for New York hours; avoid low-volume periods
- **Backtest First**: Always backtest the settings on your specific instrument before live trading
- **Use Realistic Parameters**: Default 20-tick TP is conservative; adjust based on instrument volatility
## Limitations and Warnings
**This indicator does NOT**:
- Guarantee profitable trades (past performance does not indicate future results)
- Account for slippage, commissions, or real-world execution challenges
- Work equally well in all market conditions (performs poorly in low-volume, range-bound markets)
- Replace proper risk management and position sizing
- Provide financial advice
**Repainting**: This indicator is designed to be non-repainting. Signals use indexed historical data from the anchor timeframe, meaning they will not change or disappear after they appear. However, the current bar's status will update in real-time until it closes.
**Market Conditions**: This trend-following pullback system performs best in trending markets with clear directional bias. In choppy, range-bound conditions, expect more false signals despite the cooldown filter.
**Stop Loss Execution**: The stop loss levels shown are theoretical. In fast-moving markets, actual fills may occur at worse prices due to slippage.
## Input Parameters
**Anchor Settings**:
- Anchor Timeframe: Higher timeframe for trend detection (default: 10 minutes)
**EMA Settings**:
- Fast EMA: Short-period EMA for execution bias (default: 9)
- Slow EMA: Long-period EMA for execution bias (default: 20)
**VWAP Settings**:
- Strict VWAP Filter: Toggle between strict filtering and target mode
**Signal Management**:
- Min Bars Between Signals: Cooldown period to prevent spam (default: 10 bars)
**Time Filters**:
- Session 1 & 2: Configure up to two trading sessions with start/end times in 12-hour format
**Risk Management**:
- Take Profit (Ticks): Fixed tick target when aligned with VWAP (default: 20)
**Visual Settings**:
- Show Trend Background: Background color based on 10m trend
- Show Stop Loss Lines: Display SL levels on chart
- Show EMAs: Display 9/20 EMAs on chart
- Show VWAP: Display daily VWAP on chart
## Technical Notes
- Uses Pine Script v5
- Non-repainting implementation via `request.security()` with `lookahead_off` and indexed data
- Suitable for alerts and automated trading integration
- Maximum 50 labels and 50 lines to maintain performance
- Status table updates on each bar close
## Credits
This indicator automates the MapleStax Candle by Candle methodology. The CBC flip logic and pullback entry concept are part of the MapleStax trading education system.
---
**Disclaimer**: This indicator is for educational and informational purposes only. It is not financial advice. Trading futures, forex, and equities carries substantial risk of loss. Past performance is not indicative of future results. Always trade with risk capital you can afford to lose and use proper position sizing.

Ranked Exchange Volume (REV)📊 Ranked Exchange Volume (REV) - Multi-Venue Volume Distribution Visualizer
## Stop Guessing Where the Real Volume Is. See It.
Most traders look at aggregate volume and miss the critical story: **where** that volume actually traded. Ranked Exchange Volume (REV) solves this by revealing the complete liquidity landscape across multiple trading venues in a single, elegant visualization.
This isn't just another volume indicator—it's a **dynamic stratified histogram** that automatically reorganizes exchange layers by magnitude on every bar, showing you **instant market dominance** at a glance.
---
## 🎯 The Core Innovation: Self-Organizing Volume Layers
REV displays volume from up to 10 different exchanges as **stacked, color-coded bars** where the largest volume source literally rises to the top. Watch as exchanges compete for dominance in real-time:
- **Largest volume = Top of the bar** (most visible position)
- **Smallest volume = Bottom of the bar** (foundation layer)
- **Everything in between = Automatically sorted on every candle**
This visual hierarchy makes it instantly obvious which venues are leading the market—no mental math required.
---
## ✨ Key Features
### 🔄 **Dynamic Layer Sorting**
Unlike static stacked charts, REV uses real-time stratification. If Binance had 60% of volume last bar but Coinbase takes 70% this bar, you'll see Coinbase jump to the top. The hierarchy reflects current reality, not a fixed order.
### 🎨 **10 Fully Customizable Exchange Slots**
Each exchange slot offers complete control:
- **Enable/Disable toggle** - Turn exchanges on/off without losing your configuration
- **Custom prefix** - Track ANY exchange on TradingView (BINANCE, KRAKEN, OANDA, FXCM, etc.)
- **Custom suffix** - Specify quote currency (USDT, USD, EUR, or leave blank for stocks/forex)
- **Display name** - Control how exchanges appear in the rankings table
- **Color selection** - Match your chart theme or use brand colors for instant recognition
### 📊 **Live Rankings Table**
A real-time leaderboard shows:
- **Rank** - Current position (1 = highest volume)
- **Exchange name** - With color-coded background
- **Volume** - Intelligently formatted with K/M/B units
- **Percentage** - Exact market share
**Table positioning:** Choose from 9 screen positions (top/middle/bottom × left/center/right) to keep your chart clean.
### 🧮 **Intelligent Volume Formatting**
REV automatically detects volume magnitude and applies the appropriate scale:
- **Billions** - Displays as "1.5B" for readability
- **Millions** - Displays as "342.8M"
- **Thousands** - Displays as "45.2K"
- **Full numbers option** - Toggle to see complete values (23,456,789)
The scale adjusts per-bar, so you always see the clearest representation.
### 🚨 **Three Built-In Alert Conditions**
1. **Exchange Dominance Alert (>50%)**
- Triggers when a single venue controls majority of volume
- Signals potential liquidity concentration risk or exchange-specific events
2. **Volume Spike Alert (>2x average)**
- Detects unusual aggregate activity across all venues
- Catches breakouts, news events, or institutional flow
3. **Liquidity Migration Alert**
- Fires when market leadership shifts between exchanges
- Reveals arbitrage opportunities or changing market structure
### 📈 **Optional Total Volume Line**
Display aggregate volume from all exchanges as a reference overlay with customizable color.
---
## 🌍 Market Compatibility: Beyond Crypto
While optimized for cryptocurrency (its primary design), REV works across multiple asset classes:
### ✅ **Cryptocurrency (Perfect Fit)**
**Why it excels:** Crypto trades 24/7 across dozens of global exchanges simultaneously. REV reveals true price discovery.
**Example configurations:**
- **BTC/USDT:** Compare Binance, Coinbase, OKX, Bybit, Kraken, Bitget
- **ETH/USD:** Track institutional venues (Coinbase, Kraken, Gemini) vs retail (Binance, Gate.io)
- **Altcoins:** Identify which exchanges have the deepest liquidity before placing large orders
**Trading applications:**
- **Arbitrage detection** - Spot when volume migrates between venues (price differential opportunities)
- **Exchange risk** - Don't trade on exchanges with suspiciously low volume
- **Whale tracking** - Sudden Coinbase dominance often signals institutional activity
- **Market maker identification** - Consistent Binance leadership suggests MM concentration
### ✅ **Forex (Excellent Fit)**
**Why it works:** Forex doesn't have centralized exchanges—it trades OTC across multiple broker feeds. REV shows which data providers are seeing the action.
**Example configurations:**
- **EUR/USD:** Compare OANDA, FXCM, FOREX.COM, FX_IDC, CAPITALCOM
- **GBP/JPY:** Track volatility across broker feeds
- **Exotics:** Verify liquidity before trading thin pairs
**Setup notes:**
- Leave **suffix field blank** for forex
- Use broker prefixes: OANDA, FXCM, FOREXCOM, FX_IDC, SAXO
- Symbol constructs as "OANDA:EURUSD"
**Trading applications:**
- **Spread verification** - Higher volume feeds typically offer tighter spreads
- **News event tracking** - See which brokers capture the most flow during announcements
- **Session analysis** - Watch London/NY volume shifts across different providers
### ⚠️ **Stocks (Limited But Useful)**
**Where it works:**
- **Dual-listed stocks** - Canadian companies on TSX and NYSE
- **International ADRs** - Same company, different exchanges
- **ETF arbitrage** - Compare volume across regional listings
**Example configurations:**
- **Shopify (SHOP):** Compare TSX vs NYSE volume
- **Alibaba (BABA):** NYSE vs HKEX volume
- **European stocks:** Compare primary exchange vs secondary listings
**Setup notes:**
- Leave **suffix field blank**
- Use exchange prefixes: NYSE, NASDAQ, TSX, LSE, XETRA
- Note: TradingView doesn't show per-venue volume for U.S. equities (NYSE vs BATS vs ARCA all aggregate)
**Limitations:** Most stocks trade primarily on one exchange, so REV is less valuable than in crypto/forex.
### ❌ **Futures (Not Recommended)**
Futures contracts differ by exchange (CME's ES ≠ EUREX's FESX), so volume isn't comparable.
---
## 📚 Practical Use Cases
### 1. **Pre-Trade Liquidity Analysis**
Before entering a large position, check which exchanges have sufficient volume to fill your order without slippage.
**Example:** You want to sell 50 BTC. REV shows Binance has 2,340 BTC volume this hour while a smaller exchange has only 87 BTC. Route your order to Binance for better execution.
### 2. **Exchange Risk Management**
Identify "fake volume" or wash trading by comparing venues.
**Red flag pattern:** An exchange consistently shows 10x the volume of competitors but with minimal price impact—likely artificial.
### 3. **Arbitrage Opportunity Detection**
When volume suddenly concentrates on one exchange, price premiums/discounts often appear.
**Alert pattern:** Liquidity Migration alert fires → Check price differences → Execute arb if spread exceeds fees.
### 4. **Institutional Flow Tracking**
In crypto, institutions typically use regulated exchanges (Coinbase, Kraken, Gemini).
**Pattern to watch:** Coinbase volume spikes to 60%+ dominance → Often precedes directional moves as institutions position.
### 5. **Market Structure Analysis**
Watch long-term trends in exchange dominance to understand market evolution.
**Example insight:** "Binance's market share has dropped from 70% to 45% over 6 months as traders diversify to OKX and Bybit."
### 6. **Event Response Comparison**
During major news events, see which exchanges react first.
**Analysis:** If one exchange shows volume spike 5 minutes before others, that feed may have faster news incorporation.
---
## ⚙️ Technical Specifications
- **Maximum exchanges:** 10 simultaneous venues
- **Sorting algorithm:** Bubble sort (O(n²) but optimal for n=10, prioritizes stability)
- **Update frequency:** Real-time, every bar
- **Data handling:** Gracefully ignores invalid symbols, treats NA as zero
- **Chart type:** Non-overlay (separate pane below price)
- **Performance:** Lightweight, no lag on any timeframe
---
## 🚀 Getting Started
### Quick Setup (5 Minutes)
**For Crypto Traders (Default Configuration):**
1. Add indicator to any crypto chart (BTC, ETH, SOL, etc.)
2. Works immediately—top 10 exchanges pre-configured
3. Customize colors if desired
4. Position table to your preference
**For Forex Traders:**
1. Open any forex pair (EUR/USD, GBP/JPY, etc.)
2. Go to Exchange 1 settings
3. Change prefix to "OANDA" (or your preferred broker)
4. **Clear the suffix field** (leave it blank)
5. Repeat for other exchanges (FXCM, FOREXCOM, FX_IDC, etc.)
6. Disable any unused exchange slots
**For Stock Traders (Dual-Listed):**
1. Open a dual-listed stock (e.g., SHOP on TSX)
2. Exchange 1: Prefix = "TSX", Suffix = blank, Name = "Toronto"
3. Exchange 2: Prefix = "NYSE", Suffix = blank, Name = "New York"
4. Disable exchanges 3-10
5. Compare volume distribution
### Advanced Customization
**Tracking Regional Markets:**
Want to compare Korean vs Japanese crypto exchanges?
- Exchange 1: UPBIT (Korean)
- Exchange 2: BITHUMB (Korean)
- Exchange 3: BITFLYER (Japanese)
- Exchange 4: COINCHECK (Japanese)
**Isolating Institutional Volume:**
Focus only on regulated U.S. exchanges:
- Enable: Coinbase, Kraken, Gemini
- Disable: All others
- Watch for >50% dominance alerts
---
## 👥 Who Is This For?
### ✅ **Perfect for:**
- **Crypto day traders** - Need to know where liquidity actually is
- **Arbitrage traders** - Spot cross-exchange inefficiencies
- **Institutional traders** - Validate execution venues before large orders
- **Forex scalpers** - Compare broker feeds for best execution
- **Market structure analysts** - Track long-term exchange dominance trends
### ❌ **Less useful for:**
- **Long-term investors** who don't care about short-term liquidity
- **Single-exchange traders** who never compare venues
- **Futures traders** (contracts differ by exchange)
---
## 🎓 Understanding the Visualization
**What each colored segment means:**
Each horizontal stripe represents one exchange's volume contribution. The **height** of each stripe shows that exchange's volume relative to others.
**Reading the pattern:**
- **Dominant top layer** (50%+ of bar) = Clear market leader
- **Evenly distributed layers** (10-15% each) = Fragmented liquidity
- **Sudden layer reorganization** = Liquidity migration event
- **Shrinking bottom layers** = Exchanges losing market share
**Color coding strategy:**
The indicator defaults to exchange brand colors for instant recognition:
- Yellow = Binance (their signature gold)
- Blue = Coinbase (their brand blue)
- Purple = Kraken (their brand purple)
- etc.
You can customize all colors to match your chart theme.
---
## 🔧 Configuration Tips
### **Best Practices:**
1. **Start with defaults** - Test on BTC/USDT to understand behavior
2. **Disable unused exchanges** - Cleaner visualization, faster computation
3. **Match your trading venues** - Only track exchanges you actually use
4. **Use brand colors initially** - Helps build visual pattern recognition
5. **Enable alerts strategically** - Don't spam yourself; focus on actionable signals
### **Common Mistakes to Avoid:**
❌ Tracking too many irrelevant exchanges (creates visual noise)
❌ Forgetting to clear suffix for forex/stocks (symbol won't construct properly)
❌ Using the same color for multiple exchanges (defeats instant recognition)
❌ Hiding the table permanently (you lose the percentage data)
---
## 📊 Performance Notes
- **Lightweight computation** - No impact on chart performance
- **Works on all timeframes** - 1-minute to monthly
- **Historical analysis** - Full bar history available (max_bars_back=5000)
- **Multi-monitor friendly** - Table positioning adapts to any screen layout
---
## 🆕 Future Enhancements (Planned)
While the current version is feature-complete, potential additions include:
- Volume-weighted average price (VWAP) overlay per exchange
- Historical dominance charts (which exchange led most this week/month)
- Correlation matrix (do exchanges move together or independently?)
**User feedback shapes development** - Comment with your requests!
---
## 💡 Pro Tips
### **Tip 1: The "Whale Exchange" Filter**
In crypto, institutions use Coinbase/Kraken. Enable ONLY these two exchanges to isolate professional flow and ignore retail noise.
### **Tip 2: The "Arbitrage Scanner"**
Set Liquidity Migration alert on 1-minute timeframe. When it fires, check price across exchanges—often there's a temporary premium/discount.
### **Tip 3: The "Liquidity Gauge"**
Before placing a large market order, switch to 5-minute timeframe and check last 10 bars. If your target exchange consistently has <20% of volume, you'll face slippage.
### **Tip 4: The "Market Structure Tracker"**
Take screenshots of the table weekly. Over time, you'll see exchange market share trends that reveal fundamental shifts in trader preferences.
### **Tip 5: The "News Event Validator"**
During major announcements (Fed decisions, earnings, etc.), watch which exchange shows volume first. That's where informed traders are positioned.
---
## 🎯 Summary
**Ranked Exchange Volume (REV) transforms volume analysis from a single number into a complete market microstructure view.**
Instead of seeing "1.2M volume," you see:
- Binance: 640K (53%)
- Coinbase: 280K (23%)
- OKX: 180K (15%)
- Bybit: 100K (9%)
**That's actionable intelligence.**
Whether you're executing a large crypto trade, arbitraging forex across brokers, or validating liquidity before buying a dual-listed stock, REV shows you **where the market actually is**—not where you assume it is.
---
## 📖 Quick Reference Card
| Feature | What It Does | Why It Matters |
|---------|-------------|----------------|
| **Dynamic Sorting** | Largest volume rises to top | Instant dominance identification |
| **10 Custom Slots** | Track any exchanges | Works for YOUR trading venues |
| **Live Rankings** | Real-time leaderboard | Precise market share data |
| **Smart Formatting** | Auto K/M/B scaling | Always readable, never cluttered |
| **Dominance Alert** | Warns at >50% concentration | Risk management for large orders |
| **Migration Alert** | Fires on leadership change | Arbitrage opportunity signal |
| **Spike Alert** | Detects 2x volume surges | Breakout/news confirmation |
| **Total Line** | Shows aggregate volume | Reference for overall activity |
| **Table Positioning** | 9 screen locations | Adapts to your layout |
| **Full/Short Toggle** | Complete vs abbreviated numbers | Flexibility for different assets |
---
## ✅ Installation & Support
**Install:** Add to your TradingView favorites, apply to any chart
**Updates:** Automatic through TradingView
**Support:** Comment with questions—active developer community
**Like this indicator?** Leave a ⭐ rating and share with fellow traders who need better volume intelligence.
---
**🚀 Start seeing the complete volume picture. Add Ranked Exchange Volume to your charts today.**

SHFE Silver Price Discovery (USD/oz)This indicator converts Shanghai Futures Exchange (SHFE) silver futures into USD per troy ounce and optionally overlays COMEX silver futures for direct, same-unit comparison.
SHFE silver is quoted in CNY per kilogram, while COMEX is quoted in USD per troy ounce. To make SHFE prices comparable on the same chart, the script:
pulls SHFE:AG1! close (CNY/kg)
pulls USD/CNY FX rate
converts to USD/oz using the exact kg → troy oz factor (32.1507466)
Why this is useful:
SHFE pricing often reflects different drivers than Western paper markets (currency effects, local liquidity, industrial demand, and regional availability). Normalizing SHFE into USD/oz lets traders and investors monitor inter-market alignment and spot periods where Eastern pricing diverges from COMEX.
How to use:
Use the SHFE USD/oz line as a “physical-demand-sensitive” reference.
Overlay COMEX to compare regional pricing and identify multi-week divergence regimes.
For the premium/discount histogram, use the companion indicator: “SHFE Silver Premium vs COMEX (USD/oz)”.
This indicator is designed for macro and inter-market analysis rather than short-term scalping.

Liquidation Bubbles [OmegaTools]🔴🟢 Liquidation Bubbles — Advanced Volume & Price Stress Detector
Liquidation Bubbles is a professional-grade analytical tool designed to identify forced positioning events, stop-runs, and liquidation clusters by combining price displacement and volume imbalance into a single, statistically normalized framework.
This indicator is not a repainting signal tool and not a simple volume spike detector. It is a contextual market stress mapper, built to highlight areas where one-sided positioning becomes unstable and the probability of forced order execution (liquidations, stops, margin calls) materially increases.
---
## 🔬 Core Concept
Market liquidations do not occur randomly.
They emerge when price deviates aggressively from its volume-weighted equilibrium while volume itself becomes abnormal.
Liquidation Bubbles detects exactly this condition by:
* Estimating a **dynamic equilibrium price** using an *inverted volume-weighted moving average*
* Measuring **directional price stress** relative to that equilibrium
* Measuring **volume stress** relative to its own adaptive baseline
* Normalizing both into **Z-score–like metrics**
* Highlighting only **statistically extreme, asymmetric events**
The result is a clear visual map of stress points where market participants are most vulnerable.
---
⚙️ Methodology (How It Works)
1️⃣ Advanced Inverted VWMA (Equilibrium Engine)
The script uses a custom Advanced VWMA, where:
* High volume bars receive less weight
* Low volume bars receive more weight
This produces a **robust equilibrium level**, resistant to manipulation and volume bursts.
This equilibrium is used for **both price and volume normalization**, creating a consistent statistical framework.
---
2️⃣ Price Stress (Directional)
Price stress is calculated as:
* The **maximum deviation** between high/low and equilibrium
* Directionally signed (upside vs downside)
* Normalized by its own historical volatility
This allows the script to distinguish:
* Aggressive upside exhaustion
* Aggressive downside capitulation
---
3️⃣ Volume Stress
Volume stress is measured as:
* Deviation from volume equilibrium
* Normalized by historical volume dispersion
This filters out:
* Normal high-volume sessions
* Illiquid noise
And isolates abnormal participation imbalance.
---
4️⃣ Liquidation Logic
A liquidation event is flagged when:
* Both price stress and volume stress exceed adaptive thresholds
* The imbalance is directional and statistically extreme
Optional Combined Score Mode allows aggregation of price & volume stress into a single composite metric for smoother signals.
---
🔵 Bubble System (Signal Hierarchy)
The indicator plots **two tiers of bubbles**:
🟢🔴 Small Bubbles
* Early warning stress points
* Localized stop-runs
* Micro-liquidations
* Often precede reactions or short-term reversals
🟢🔴 Big Bubbles
* Full liquidation clusters
* Forced unwinds
* High probability exhaustion zones
* Frequently align with:
* Intraday extremes
* Range boundaries
* Reversal pivots
* Volatility expansions
Bubble color:
* **Green** → Downside liquidation (sell-side exhaustion)
* **Red** → Upside liquidation (buy-side exhaustion)
Bubble placement is **ATR-adjusted**, ensuring visual clarity without overlapping price.
---
🔄 Cross-Market Volume Analysis
The script allows optional **external volume sourcing**, enabling:
* Futures volume applied to CFDs
* Index volume applied to ETFs
* Spot volume applied to derivatives
This is critical when:
* Your traded instrument has unreliable volume
* You want **institutional-grade confirmation**
---
🧠 How to Use Liquidation Bubbles
This indicator is **not meant to be traded alone**.
Best use cases:
* 🔹 Confluence with support & resistance
* 🔹 Contextual confirmation for reversals
* 🔹 Identifying fake breakouts
* 🔹 Liquidity sweep detection
* 🔹 Risk management (avoid entering into liquidation zones)
Ideal for:
* Futures
* Indices
* Crypto
* High-liquidity FX pairs
* Intraday & swing trading
---
🎯 Who This Tool Is For
Liquidation Bubbles is designed for:
* Advanced discretionary traders
* Order-flow & liquidity-based traders
* Macro & index traders
* Professionals seeking **context**, not signals
If you want **where the market is fragile**, not just where price moved — this tool was built for you.
---
📌 Key Characteristics
✔ Non-repainting
✔ Statistically normalized
✔ Adaptive to volatility
✔ Works on all timeframes
✔ Futures & crypto ready
✔ No lagging indicators
✔ No moving average crosses
---
Liquidation Bubbles does not predict the future.
It shows you where the market is most likely to break.
— OmegaTools

Breakeven LECAPs BONCAPsEN
Breakeven LECAPs & BONCAPs (ARS → USD) + Futures Curve
This indicator plots the breakeven USD/ARS exchange rate for Argentine fixed-rate Treasury instruments LECAPs (S tickers) and BONCAPs (T tickers), showing the USD/ARS level at each maturity where holding the peso instrument would match the performance of holding dollars.
What you get
• Breakeven labels at (Maturity Date, Breakeven Dollar)
• Automatic FX benchmarks:
• Dólar MEP: BCBA:AL30 / BCBA:AL30D
• Dólar Cable (CCL): BCBA:AL30 / BCBA:AL30C
• Optional Custom Dollar input (1000–10000 ARS)
• Optional MatbaRofex USD futures labels at their expiry dates
• Optional polynomial regression curves for LECAPs, BONCAPs, and Futures (degree 1–4), with independent toggles, colors, and smoothness points
Core calculations
• Direct Return = (Maturity Price / Last Price) - 1
• TNA (Annualized Rate) = Direct Return × 365 / Days to Maturity
• Breakeven Dollar = Current Dollar × (1 + Direct Return)
Tooltip (hover labels)
Ticker/type, maturity date, days to maturity, current price, maturity price (px_finish), direct return, TNA, and breakeven value.
⸻
ES
Breakeven LECAPs & BONCAPs (ARS → USD) + Curva de Futuros
Este indicador grafica el tipo de cambio USD/ARS de equilibrio (breakeven) para instrumentos de tasa fija del Tesoro argentino LECAPs (tickers S) y BONCAPs (tickers T). Te muestra a qué nivel de dólar, en cada vencimiento, una inversión en pesos igualaría el rendimiento de quedarse en dólares.
Qué muestra
• Etiquetas de breakeven en (Fecha de vencimiento, Dólar breakeven)
• Referencias automáticas de tipo de cambio:
• Dólar MEP: BCBA:AL30 / BCBA:AL30D
• Dólar Cable (CCL): BCBA:AL30 / BCBA:AL30C
• Opción de Dólar Custom (1000–10000 ARS)
• Opción de mostrar futuros de USD MatbaRofex en sus vencimientos
• Curvas de regresión polinómica opcionales para LECAPs, BONCAPs y Futuros (grado 1–4), con toggle, color y suavizado configurables por separado
Cálculos principales
• Retorno Directo = (Precio de vencimiento / Último precio) - 1
• TNA = Retorno Directo × 365 / Días al vencimiento
• Dólar Breakeven = Dólar actual × (1 + Retorno Directo)
Tooltip (pasar el mouse por las etiquetas)
Ticker/tipo, fecha de vencimiento, días restantes, precio actual, precio de vencimiento (px_finish), retorno directo, TNA y valor de breakeven.
==================== DISCLAIMER / AVISO LEGAL ====================
This indicator is for informational and educational purposes only.
Eco Valores S.A. does NOT provide investment advice or recommendations.
Consult a qualified financial advisor before making investment decisions.
Este indicador es solo para fines informativos y educativos.
Eco Valores S.A. NO brinda asesoramiento ni recomendaciones de inversion.
Consulte con un asesor financiero calificado antes de invertir.
===================================================================

Mongoose Capital: WTI Execution Overlay v1Overview
The WTI Execution Overlay v1 is a decision-support overlay designed to improve execution quality in crude oil markets by filtering when trades are allowed, not what to trade.
It integrates macro confirmation, volatility regime awareness, demand pressure, and flow confirmation into a single execution gate. The goal is simple:
reduce false breakouts, avoid low-quality conditions, and prioritize trades when macro and flow are aligned.
This tool is intended for CL / WTI futures, CFDs, and related energy instruments, and works best alongside an existing technical or order-flow strategy.
How to Use
Apply the indicator to a WTI / CL chart.
Use your existing setup (levels, structure, order flow, strategy logic).
Treat this overlay as an execution permission layer:
When the overlay is ON, conditions are favorable for breakout or continuation trades.
When the overlay is OFF, risk of failed moves is elevated.
Practical guidance:
ON → Normal execution allowed.
OFF → Reduce size, wait for confirmation, or stand aside.
Best used on 15m–4H timeframes, but adapts across horizons.
This indicator does not generate buy/sell signals and does not predict price direction.
Methodology (High Level)
The overlay evaluates execution quality through a composite framework:
1. Macro & Regime Confirmation
Identifies whether price action aligns with a supportive macro regime.
Prevents breakout participation when broader conditions are hostile.
2. Volatility & Flow Confirmation
Uses volatility expansion and momentum behavior to confirm participation.
Rising volatility is treated as confirmation, not a trigger.
3. Demand & Impact Filters
Incorporates demand pressure and impact weighting to distinguish:
Real participation vs. low-liquidity noise.
Acts as a reminder that not all breakouts are created equal.
4. Execution Gating Logic
Trades are allowed only when:
Macro regime is permissive or
Breakout conditions are confirmed and not vetoed by risk filters.
Prevents “technical breakouts” that lack macro or flow support.
What This Indicator Is
An execution filter
A risk management overlay
A confirmation layer for discretionary or systematic traders
What This Indicator Is Not
Not a trading strategy
Not a signal generator
Not predictive or forward-looking
Intended Audience
Active discretionary traders
Futures and macro traders
Energy market participants
Traders who already understand structure, levels, or order flow
If you rely solely on indicators for entries, this tool is not designed for that use case.
Credits
Developed by Mongoose Labs, a research arm of Mongoose Capital, focused on:
Macro-aware execution frameworks
Regime-based risk management
Institutional-style confirmation logic
This script is provided for educational and analytical purposes only.
Disclaimer
This indicator does not constitute financial advice. Trading futures and leveraged products involves substantial risk. Past behavior does not guarantee future results. Use at your own discretion.

Delta Volume EMA Strategy
================================================================================
DELTA VOLUME EMA STRATEGY - STRATEGY GUIDE 📊
================================================================================
💡 COLLABORATION & SUPPORT
---------------------------
If you want to collaborate, have an idea for a strategy, or need help writing
or customizing code, send an email to burdytrader@gmail.com or send me a
message. Suggestions, ideas, and comments are always welcome! 🤝
================================================================================
⚠️ IMPORTANT: INSTRUMENT SELECTION 📈
-------------------------------------
This strategy performs BEST with instruments that have a centralized data flow,
such as Futures contracts. Centralized markets provide more accurate and
reliable volume data, which is essential for Volume Delta analysis to work
effectively.
Why Futures? 🎯
- Centralized exchange = Accurate volume data
- All trades flow through a single exchange
- Volume reflects true buying/selling pressure
- Better correlation between volume and price movements
While the strategy can work with other instruments (stocks, forex, etc.),
volume data quality may vary, which can affect the reliability of Volume Delta
signals. For optimal performance, use Futures contracts or other instruments
with centralized, high-quality volume data.
================================================================================
WHAT DOES THIS STRATEGY DO? 🎯
---------------------------
This strategy uses Volume Delta analysis combined with Exponential Moving
Averages (EMA) to identify high-probability trading opportunities. The Volume
Delta measures the difference between buying and selling pressure, helping to
identify when strong institutional or smart money movements occur. The strategy
automatically enters trades when volume delta reaches extreme levels, indicating
potential trend continuation or reversal points.
HOW IT WORKS? ⚙️
---------------
1. VOLUME DELTA CALCULATION 📈
The strategy calculates the Volume Delta using the following formula:
- Volume Ratio (v) = Current Volume / Previous Volume
- EMA of Close (mac) = EMA(Close, MA Length) × Volume Ratio
- EMA of Open (mao) = EMA(Open, MA Length) × Volume Ratio
- Volume Delta (vd) = mac - mao
The Volume Delta shows:
- Positive values (green) = Buying pressure (buyers are more active)
- Negative values (red) = Selling pressure (sellers are more active)
2. VOLUME DELTA MOVING AVERAGE 📊
The strategy calculates an EMA of the Volume Delta (vdma) to smooth out
fluctuations and identify the overall trend of buying/selling pressure:
- vdma = EMA(Volume Delta, EMA Length)
- When vdma is above zero = Overall buying pressure
- When vdma is below zero = Overall selling pressure
3. PERCENTILE-BASED ENTRY CONDITIONS 🎲
Instead of using fixed thresholds, the strategy uses percentile analysis to
identify extreme volume delta movements:
For LONG entries:
- Analyzes seller volumes (negative volume delta) over the lookback period
- Calculates the percentile threshold (default: 80th percentile)
- Enters LONG when volume delta becomes positive AND exceeds the threshold
- This indicates a strong shift from selling to buying pressure
For SHORT entries:
- Analyzes buyer volumes (positive volume delta) over the lookback period
- Calculates the percentile threshold (default: 80th percentile)
- Enters SHORT when volume delta becomes negative AND exceeds the threshold
- This indicates a strong shift from buying to selling pressure
4. POSITION SIZING 💰
The strategy offers two position sizing methods:
a) RISK VALUE (Fixed Risk in Dollars):
- Calculates position size based on a fixed dollar risk amount
- Formula: Position Size = Risk Amount / (Entry Price × Stop Loss %)
- Ensures consistent risk per trade regardless of price level
b) LOTS SIZE:
- Uses a fixed lot size for all trades
- Simple and straightforward approach
- Useful when you want consistent position sizes
5. TAKE PROFIT & STOP LOSS SETTINGS 🎯
The strategy offers flexible TP/SL configuration in three modes:
a) PERCENTAGE (%):
- TP/SL calculated as a percentage of entry price
- Example: 2% TP means entry price × 1.02 (for LONG) or × 0.98 (for SHORT)
- Adapts automatically to different price levels
b) CURRENCY:
- TP/SL set as a fixed currency amount
- Example: $100 TP means entry price + $100 (for LONG) or - $100 (for SHORT)
- Useful for instruments with consistent price movements
c) PIPS:
- TP/SL set as a fixed number of pips
- Automatically converts pips to price using the instrument's minimum tick
- Ideal for forex and other pip-based instruments
6. AUTOMATIC TRADE EXECUTION ⚡
When entry conditions are met:
- Opens a position (LONG or SHORT) at market price
- Automatically sets Take Profit and Stop Loss based on selected mode
- Sends an alert with all trade information
- Only one position at a time (waits for current position to close)
AVAILABLE PARAMETERS ⚙️
----------------------
1. MA LENGTH (Default: 10)
- Length of the Exponential Moving Average used for close and open prices
- Lower values = More sensitive to recent price action
- Higher values = More smoothed, less sensitive
2. EMA LENGTH (Default: 20)
- Length of the EMA applied to Volume Delta
- Controls the smoothing of the volume delta signal
- Lower values = Faster signals, more trades
- Higher values = Slower signals, fewer but potentially more reliable trades
3. POSITION SIZE MODE
- "Risk Value": Calculate position size based on fixed dollar risk
- "Lots Size": Use fixed lot size for all trades
4. FIXED RISK IN $ (Default: 50)
- Only used when Position Size Mode = "Risk Value"
- The dollar amount you're willing to risk per trade
- Strategy calculates position size automatically
5. LOT SIZE (Default: 0.01)
- Only used when Position Size Mode = "Lots Size"
- Fixed lot size for all trades
6. TAKE PROFIT MODE
- "%": Percentage of entry price
- "Currency": Fixed currency amount
- "Pips": Fixed number of pips
7. STOP LOSS MODE
- "%": Percentage of entry price
- "Currency": Fixed currency amount
- "Pips": Fixed number of pips
8. TAKE PROFIT / STOP LOSS VALUES
- Different input fields appear based on selected mode
- Configure TP and SL independently
9. VOLUME LOOKBACK PERIOD (Default: 20)
- Number of bars used to calculate percentile thresholds
- Lower values = More sensitive, adapts faster to recent conditions
- Higher values = More stable, uses longer-term statistics
10. PERCENTILE THRESHOLD (Default: 80%)
- The percentile level used to identify extreme volume delta movements
- 80% means: only enter when volume delta exceeds 80% of recent values
- Higher values = Fewer but potentially stronger signals
- Lower values = More frequent signals
VISUALIZATION 📊
---------------
The strategy displays on the chart:
1. VOLUME DELTA COLUMNS
- Green columns = Positive volume delta (buying pressure)
- Red columns = Negative volume delta (selling pressure)
- Height represents the magnitude of buying/selling pressure
2. VOLUME DELTA MA AREA
- Two overlapping area plots showing the smoothed volume delta
- Black area (base layer) for overall visualization
- Green area (when positive) = Overall buying pressure trend
- Red area (when negative) = Overall selling pressure trend
- Helps identify the dominant market sentiment
3. ZERO LINE
- Horizontal line at zero
- Helps visualize when buying/selling pressure crosses the neutral point
ALERTS 🔔
--------
When enabled, the strategy sends alerts when a trade is opened. The alert
message includes:
- Direction: "Buy" for LONG positions or "Sell" for SHORT positions
- Entry Price: The price at which the position was opened
- TP (Take Profit): The target profit price
- SL (Stop Loss): The stop loss price
Example alert message:
"Buy | Entry: 1.2050 | TP: 1.2250 | SL: 1.1950"
Alerts can be configured in TradingView to send notifications via email,
SMS, webhooks, or other platforms.
RECOMMENDED SETTINGS 🎯
-----------------------
To get started, you can use these settings:
STRATEGY PARAMETERS:
- MA Length: 10 (default)
- EMA Length: 20 (default)
- Volume Lookback Period: 20 (default)
- Percentile Threshold: 80% (default)
POSITION SIZING:
- Position Size Mode: "Risk Value" (for risk management)
- Fixed Risk in $: Adjust based on your account size (e.g., 1-2% of account)
- OR use "Lots Size" with 0.01 lots for small accounts
TAKE PROFIT & STOP LOSS:
- TP Mode: "%" (recommended for most instruments)
- SL Mode: "%" (recommended for most instruments)
- Take Profit (%): 2.0% (adjust based on your risk/reward preference)
- Stop Loss (%): 1.0% (adjust based on your risk tolerance)
For Forex:
- Consider using "Pips" mode for TP/SL
- Typical values: 20-50 pips TP, 10-30 pips SL
For Stocks/Indices:
- Use "%" mode for TP/SL
- Typical values: 2-5% TP, 1-2% SL
PRACTICAL EXAMPLE 📝
-------------------
Scenario: LONG Entry on EUR/USD
1. Market conditions:
- Price: 1.1000
- Volume Delta becomes strongly positive
- Volume Delta exceeds 80th percentile of recent seller volumes
2. Strategy calculates:
- Entry Price: 1.1000 (current close)
- Position Size Mode: "Risk Value"
- Fixed Risk: $50
- Stop Loss Mode: "%"
- Stop Loss: 1.0%
- Position Size = $50 / (1.1000 × 0.01) = 4.55 lots
3. Strategy opens position:
- Direction: LONG (Buy)
- Entry: 1.1000
- Take Profit: 1.1220 (2% above entry)
- Stop Loss: 1.0890 (1% below entry)
- Alert sent: "Buy | Entry: 1.1000 | TP: 1.1220 | SL: 1.0890"
4. Outcome scenarios:
- If price rises to 1.1220 → Take Profit hit (profit)
- If price falls to 1.0890 → Stop Loss hit (loss limited to $50)
IMPORTANT NOTE ⚠️
-----------------
This strategy is a technical analysis tool based on volume delta analysis.
Like all trading strategies, it does NOT guarantee profits. Trading involves
significant risks and you can lose money, including your entire investment.
Past performance does not guarantee future results.
Always:
- Use appropriate risk management
- Never risk more than you can afford to lose
- Test the strategy on historical data (backtesting) before using real money
- Start with small position sizes or paper trading
- Understand that no strategy works 100% of the time
- Consider market conditions, news events, and other factors
- Keep a trading journal to learn and improve
The author and contributors are NOT responsible for any losses incurred from
using this strategy. Trading decisions are your own responsibility. Profits
are NOT guaranteed, and losses are possible.
LICENSE 📄
---------
This code is open source and available for modification. You are free to use,
modify, and distribute this strategy. If you republish or share a modified
version, please kindly mention the original author.
================================================================================

CME Quarterly ShiftsCME Quarterly Shifts - Institutional Quarter Levels
Overview:
The CME Quarterly Shifts indicator tracks price action based on actual CME futures contract rollover dates, not calendar quarters. This indicator plots the Open, High, Low, and Close (OHLC) for each quarter, with quarters defined by the third Friday of March, June, September, and December - the exact dates when CME quarterly futures contracts expire and roll over.
Why CME Contract Dates Matter:
Institutional traders, hedge funds, and large market participants typically structure their positions around futures contract expiration cycles. By tracking quarters based on CME rollover dates rather than calendar months, this indicator aligns with how major institutional players view quarterly timeframes and position their capital.
Key Features:
✓ Automatic CME contract rollover date calculation (3rd Friday of Mar/Jun/Sep/Dec)
✓ Displays Quarter Open, High, Low, and Close levels
✓ Vertical break lines marking the start of each new quarter
✓ Quarter labels (Q1, Q2, Q3, Q4) for easy identification
✓ Adjustable history - show up to 20 previous quarters
✓ Fully customizable colors and line widths
✓ Works on any instrument and timeframe
✓ Toggle individual OHLC levels on/off
How to Use:
Quarter Open: The opening price when the new quarter begins (at CME rollover)
Quarter High: The highest price reached during the current quarter
Quarter Low: The lowest price reached during the current quarter
Quarter Close: The closing price from the previous quarter
These levels often act as key support/resistance zones as institutions reference them for quarterly performance, rebalancing, and position management.
Settings:
Display Options: Toggle quarterly break lines, OHLC levels, and labels
Max Quarters: Control how many historical quarters to display (1-20)
Colors: Customize colors for each level and break lines
Styles: Adjust line widths for OHLC levels and quarterly breaks
Best Practices:
Combine with other Smart Money Concepts (liquidity, order blocks, FVGs)
Watch for price reactions at quarterly Open levels
Monitor quarterly highs/lows as potential targets or stop levels
Use on higher timeframes (4H, Daily, Weekly) for clearer institutional perspective
Pairs well with monthly and yearly levels for multi-timeframe confluence
Perfect For:
ICT (Inner Circle Trader) methodology followers
Smart Money Concepts traders
Swing and position traders
Institutional-focused technical analysis
Traders tracking quarterly performance levels
Works on all markets: Forex, Indices, Commodities, Crypto, Stocks

Statistcal Daily Profile & Ranges# Statistical Daily Profile & Ranges - TradingView Publication Guide
## Overview
The **Statistical Daily Profile & Ranges** indicator is a comprehensive tool designed to analyze intraday session behavior and daily range characteristics. It combines Average Daily Range (ADR) projection levels with detailed session-by-session statistics and probability-based trading insights derived from historical price action patterns.
## What This Indicator Does
This indicator provides traders with three core analytical components:
1. **ADR Projection Levels** - Dynamic support/resistance levels based on historical daily ranges
2. **Session Range Analysis** - Visual boxes and statistical breakdowns for four key trading sessions
3. **Dynamic Probability Display** - Real-time probability statistics based on overnight session relationships
## How It Works
### Average Daily Range (ADR) Calculation
The indicator calculates the average daily range over a user-defined lookback period (default: 10 days) and projects this range from each day's opening price. This creates two key levels:
- **ADR High**: Opening price + average daily range
- **ADR Low**: Opening price - average daily range
- **ADR Median**: The opening price (middle of the projected range)
These levels are recalculated at the start of each trading day and extend forward, providing dynamic support and resistance zones based on recent volatility characteristics.
### Session Tracking & Statistics
The indicator monitors four distinct trading sessions (times in Eastern Time):
1. **Asia Session** (8:00 PM - 2:00 AM)
2. **London Session** (2:00 AM - 8:00 AM)
3. **NY Open** (8:00 AM - 9:00 AM)
4. **NY Initial Balance** (9:30 AM - 10:30 AM)
For each session, the indicator:
- Draws a colored box showing the session's high-to-low range
- Tracks the opening price, high, and low
- Stores historical data for statistical analysis
- Calculates average ranges by day of week (Monday through Friday)
The session statistics are displayed in a customizable table showing average point ranges for each session across different weekdays, helping traders identify which sessions and days typically produce the most movement.
### Dynamic Probability System
The indicator analyzes the relationship between the Asia and London sessions to determine the current market setup. After the London session closes, it automatically detects one of four possible conditions:
**1. London Engulfs Asia**
- London session breaks both above Asia's high AND below Asia's low
- This indicates strong momentum during the European session
- Most common occurrence pattern
**2. Asia Engulfs London**
- Asia session range completely contains the London session range
- Indicates consolidation during London hours
- Relatively rare pattern (occurs approximately 5.36% of the time)
**3. London Partially Engulfs Upwards**
- London breaks above Asia's high but stays above Asia's low
- Suggests bullish momentum continuation from Asia into London
**4. London Partially Engulfs Downwards**
- London breaks below Asia's low but stays below Asia's high
- Suggests bearish momentum continuation from Asia into London
Once a condition is detected, the indicator displays a probability table showing historically observed outcomes for that specific setup, including:
- Probability of NY session taking out key levels (Asia high/low, London high/low)
- Probability of NY session engulfing the entire overnight range
- Directional bias for NY Cash session (9:30 AM - 4:00 PM)
## How to Use This Indicator
### Initial Setup
1. Add the indicator to your chart (works on any intraday timeframe below Daily)
2. Adjust the **ADR Days** setting (default: 10) to control the lookback period for range calculation
3. Adjust the **Session Lookback Days** setting (default: 50) to determine how much historical data feeds the statistics tables
### Reading the ADR Levels
- Use the **ADR High** and **ADR Low** lines as potential profit targets or areas where price may encounter resistance
- The **ADR Median** line represents the opening price and can act as a pivot point for intraday directional bias
- If price reaches the ADR High early in the session, it suggests strong bullish momentum; conversely for ADR Low
- These levels adapt daily based on recent volatility, making them more responsive than static levels
### Interpreting Session Boxes
- **Session boxes** visually highlight when each trading session is active and its price range
- Larger boxes indicate higher volatility during that session
- Compare current session ranges to the statistical averages shown in the table
- Sessions that are unusually quiet or active relative to historical averages may signal compression or expansion
### Using the Session Statistics Table
- The table shows average point ranges for each session broken down by weekday
- Identify which sessions typically produce the most movement on specific days
- For example, if London on Thursdays averages 40 points while Mondays average 25 points, you can adjust position sizing or expectations accordingly
- The **Total** column shows the overall average across all days
- Sample sizes (shown in brackets if enabled) indicate data reliability
### Trading with the Probability Table
The probability table updates dynamically after the London session closes and shows statistically probable outcomes based on 12 years of NQ futures data.
**Important Limitations:**
- **These probabilities are derived from NQ (Nasdaq E-mini futures) data only**
- **Do NOT apply these probability statistics to other instruments** (ES, stocks, forex, etc.)
- The probabilities represent historical frequencies, not guarantees
- Always combine with your own analysis, risk management, and market context
**How to Apply the Probabilities:**
When **London Engulfs Asia**:
- Watch for NY session to take out London's extremes (72.33% probability for high, 71.12% for low)
- Slight bullish bias in NY Cash session (54.80% vs 45.20%)
- Lower probability of complete overnight engulfment (44.13%)
When **Asia Engulfs London** (rare - 5.36% occurrence):
- Higher probability NY takes Asia's high (75.86%)
- Moderately high probability NY takes Asia's low (65.52%)
- Slight increase in bullish bias (58.42% vs 41.58%)
- Recognize this as an unusual setup
When **London Partially Engulfs Upwards**:
- Very high probability NY takes London high (81.51%)
- Strong probability NY takes London low (64.45%)
- Moderate probability NY takes Asian low (53.16%)
- Slight bullish bias (55.52%)
When **London Partially Engulfs Downwards**:
- Very high probability NY takes London low (75.29%)
- Strong probability NY takes London high (68.80%)
- Moderate probability NY takes Asian high (56.44%)
- Slight bullish bias maintained (52.99%)
### Practical Trading Applications
**Scenario 1: Range Projection**
If the ADR is 500 points and the market opens at 25,000:
- ADR High: 25,500 (potential resistance/target)
- ADR Low: 24,500 (potential support/target)
- Monitor how price interacts with these levels throughout the day
**Scenario 2: Session-Based Trading**
Using the statistics table, you notice London on Wednesdays averages 35 points. During a Wednesday London session:
- If London has already moved 30 points, the session may be exhausting its typical range
- If London has only moved 15 points with an hour remaining, there may be expansion potential
- Adjust stop losses and targets based on typical session behavior
**Scenario 3: Probability-Based Setup**
It's 8:05 AM ET and the indicator shows "London Partially Engulfs Upwards":
- You now know there's an 81.51% historical probability NY will take out London's high
- There's a 53.16% probability NY will reach down to Asia's low
- The NY Cash session has a slight bullish bias (55.52%)
- Consider this alongside your technical analysis for directional bias and level targeting
## Customization Options
### Visual Settings
- **Line Width**: Adjust thickness of ADR levels
- **ADR Color/Style**: Customize appearance of ADR projection lines (solid, dashed, dotted)
- **Median Line**: Toggle visibility and customize appearance separately
- **Session Box Colors**: Customize each session's box color independently
- **Show Session Boxes**: Toggle session box visibility on/off
### Label Settings
- **ADR Labels**: Show/hide labels for ADR High and ADR Low, adjust size
- **Median Label**: Separate control for median line label
- **Session Labels**: Show/hide session name labels, adjust size
- **Label Colors**: Customize text colors for all labels
### Table Settings
- **Session Stats Table**: Position (9 locations available), size (Tiny to Huge), toggle on/off
- **Sample Sizes**: Show/hide the number of historical samples used for each calculation
- **Probabilities Table**: Separate position and size controls, toggle on/off
### Session Times
- Each session's time range can be customized to fit different markets or preferences
- All times are in Eastern Time (America/New_York timezone)
## Technical Notes
### Data Requirements
- The indicator requires sufficient historical data based on your lookback settings
- Minimum recommended: 50+ days of intraday data for reliable statistics
- Works on any timeframe below Daily (1-minute, 5-minute, 15-minute, etc.)
### Calculation Methodology
- **ADR Calculation**: Simple average of absolute daily high-low ranges
- **Session Statistics**: Mean average of ranges for each session filtered by day of week
- **Condition Detection**: Boolean logic comparing session high/low relationships
- All calculations update in real-time as new bars form
### Probability Data Source
The probability statistics displayed in the dynamic table are derived from:
- **Dataset**: 12 years of NQ (Nasdaq E-mini futures) historical data
- **Methodology**: Frequency analysis of outcomes following specific setup conditions
- **Time Period**: Multiple market cycles including various volatility regimes
**Critical Warning**: These probabilities are specific to NQ and reflect that instrument's behavior patterns. Market microstructure, participant behavior, and volatility characteristics differ significantly across instruments. Do not apply these NQ-derived probabilities to other markets (ES, RTY, YM, individual stocks, forex, commodities, etc.).
## Best Practices
1. **Combine with Other Analysis**: Use this indicator as one component of a complete trading methodology, not a standalone system
2. **Respect Risk Management**: Probabilities are not certainties; always use proper position sizing and stop losses
3. **Context Matters**: High-impact news events, holiday trading, and extreme volatility can invalidate typical patterns
4. **Verify Statistics**: Monitor your own results and compare to the displayed probabilities
5. **Adapt Session Times**: If trading instruments with different active hours, adjust session times accordingly
6. **Regular Calibration**: Periodically review if the session averages and probabilities remain relevant to current market conditions
## Understanding Originality
This indicator is original in its approach to combining three analytical frameworks into a single tool:
1. **Dynamic ADR Projection**: Unlike static pivot points, these levels adapt daily based on recent volatility
2. **Session-Specific Statistics**: Goes beyond simple volume profiles by quantifying average ranges for specific time windows across weekdays
3. **Conditional Probability Display**: Automatically detects overnight session relationships and displays relevant probability data rather than showing all scenarios simultaneously
The conditional logic system that determines which probability set to display is a key differentiator—traders only see the statistics relevant to the current market setup, reducing information overload and improving decision-making clarity.
## Summary
The **Statistical Daily Profile & Ranges** indicator provides traders with a comprehensive framework for understanding daily range potential, session-specific behavior patterns, and probability-based setup analysis. By combining ADR projection levels with detailed session statistics and dynamic probability displays, traders gain multiple perspectives on potential price movement within the trading day.
The indicator is most effective when used to:
- Set realistic profit targets based on average daily range
- Identify which sessions typically produce movement on specific weekdays
- Understand probability-weighted outcomes for different overnight setup conditions (NQ only)
- Visualize session ranges and compare them to historical averages
Remember that all statistical analysis reflects historical patterns, and market behavior can change. Always combine indicator signals with sound risk management, proper position sizing, and your own market analysis.

Liquidity Sweep Guardian (Universal % or point based)
Liquidity Sweep Guardian - Complete User Guide
## Overview
The **Liquidity Sweep Guardian** is a visual warning system designed to prevent premature counter-trend trades (fades) near Previous Day High (PDH) and Previous Day Low (PDL) levels. This indicator helps you avoid one of the most common trading mistakes: fading too early before liquidity sweeps complete.
---
## 🎯 Core Trading Principle
### **THE GOLDEN RULE: Don't Fade Until It's Unlocked**
Price often **accelerates into key levels** to sweep liquidity before reversing. Trading against this momentum is extremely dangerous.
**The Process:**
1. **Danger Zone** (Red/White Box) = ⚠️ **DO NOT FADE** - Sweep likely incoming
2. **Sweep Occurs** (Triangle marker appears) = Price penetrates the level
3. **Reclaim Happens** (Price returns above/below level) = Level is tested
4. **🔓 UNLOCKED** (Gold border, green label) = **NOW you may CONSIDER a fade**
> **Important:** "UNLOCKED" means you may now *consider* a fade setup. It is NOT a trade signal itself. You still need your entry confirmation, risk management, and trade plan.
---
## 📊 Visual Elements Explained
### 1. **Danger Zone Boxes (Red Border by Default)**
**Two types of zones around PDH/PDL:**
- **Outer Danger Zone** (White fill): ±75pts (or 0.30%) around the level
- Indicates proximity to a key level where sweeps commonly occur
- Yellow/cautious trading zone
- **Inner Critical Zone** (Black fill): ±25pts (or 0.10%) around the level
- Highest probability area for liquidity sweep traps
- Avoid fading here at all costs
**What to do:**
- When price enters these zones, **wait and watch**
- Do not initiate counter-trend positions
- Allow the sweep to play out
### 2. **Unlocked Zones (Gold Border #ffeb3b)**
When a zone turns **gold/yellow** with green fill:
- The level has been swept AND reclaimed
- The liquidity grab is complete
- You may now look for fade opportunities with proper confirmation
### 3. **PDH/PDL Lines**
- **PDH Line** (Red): Previous Day High with price label
- **PDL Line** (Green): Previous Day Low with price label
- These are your key reference levels for the session
### 4. **Sweep Labels**
**Triangle Markers (SWEEP):**
- **Green Triangle** = Clean sweep (10-25pts penetration)
- **Orange Triangle** = Extended sweep (25-50pts penetration)
- **Red Triangle** = Deep penetration (50+ pts) - likely continuation, not reversal
**Warning Labels:**
- **⚠️ DEEP CONTINUATION?** = Penetration too deep, probably NOT a reversal setup
**Unlock Labels:**
- **🔓 LONG UNLOCKED** = PDL swept and reclaimed, may consider long fades
- **🔓 SHORT UNLOCKED** = PDH swept and reclaimed, may consider short fades
---
## ⚙️ Settings Guide
### **Calculation Mode**
**Use Percentage Mode (Default: ON)**
- ✅ **Enabled**: Universal mode - works on NQ, ES, RTY, stocks, crypto, forex
- ❌ **Disabled**: Fixed points mode - for specific instruments only
**When to use each:**
- **Percentage Mode**: Trading multiple instruments, or instruments with varying price levels
- **Fixed Points Mode**: Single instrument focus (e.g., only trading NQ at current levels)
### **Danger Zone Settings**
**Percentage Mode (Default for Universal Use):**
- **Danger Zone**: 0.30% each side (≈75pts on NQ@25,000)
- **Critical Zone**: 0.10% each side (≈25pts on NQ@25,000)
**Fixed Points Mode (For NQ Specifically):**
- **Danger Zone**: 75 points each side
- **Critical Zone**: 25 points each side
**Adjustment Tips:**
- For more volatile instruments: Increase percentages/points
- For less volatile instruments: Decrease percentages/points
- For higher timeframes: Use wider zones
- For lower timeframes: Use tighter zones
### **Sweep Classification**
**What defines a "real" sweep:**
- **Minimum**: 10pts / 0.04% - Shallow penetration may not grab enough liquidity
- **Optimal**: 10-25pts / 0.04-0.10% - "Goldilocks zone" for reversal setups
- **Extended**: 25-50pts / 0.10-0.20% - Deeper sweep, less reliable
- **Continuation**: 50+pts / 0.20%+ - Too deep, likely NOT reversing
**Max Bars for Reclaim**: 5 bars (default)
- Price should reclaim the level relatively quickly
- If it takes too long, the sweep may have failed
### **Visual Customization**
**Box Settings:**
- **Left Extension**: 60 bars (how far back the box extends)
- **Right Extension**: 50 bars (how far forward the box extends)
**Toggle Options:**
- Show/Hide Danger Zone Boxes
- Show/Hide PDH/PDL Lines
- Show/Hide Price Labels on lines
- Show/Hide Sweep Labels
- Show/Hide Unlock Labels
### **Color Customization**
All colors are fully customizable:
- Danger Zone Fill & Border
- Critical Zone Fill & Border
- Unlocked Zone Fill & Border
- PDH/PDL Line Colors
- PDH/PDL Label Colors
- Border Widths (1-5 pixels)
- Line Widths (1-5 pixels)
---
## 🎓 Trading Strategy Examples
### **Example 1: Long Setup at PDL**
1. **Morning**: Price approaches PDL (danger zone appears)
2. **Don't Fade Yet**: Price enters critical zone - resist urge to buy
3. **Sweep**: Price drops 15pts below PDL (green triangle appears)
4. **Reclaim**: Price closes back above PDL within 3 bars
5. **🔓 UNLOCKED**: Gold border + "LONG UNLOCKED" label appears
6. **Trade Setup**: Now look for bullish confirmation (order flow, structure, etc.)
### **Example 2: Avoiding a Trap at PDH**
1. **Afternoon**: Price rallies into PDH danger zone
2. **Temptation**: You want to short here (it "looks toppy")
3. **Sweep**: Price breaks 50pts above PDH (red triangle + ⚠️ warning)
4. **Continuation**: Deep penetration suggests continuation, not reversal
5. **Result**: No unlock occurs, price keeps running higher - trap avoided!
### **Example 3: Failed Unlock (No Trade)**
1. Price sweeps PDL by 12pts (green triangle)
2. Price struggles to reclaim PDL, stays below for 10+ bars
3. No "UNLOCKED" label appears
4. **Correct Action**: Do not fade - sweep failed to reclaim
---
## 📱 Alerts
The indicator includes built-in alerts for:
- **Entering Danger Zones**: Get warned when price approaches PDH/PDL
- **Sweep Detection**: Know immediately when a level is swept
- **Unlock Signals**: Get notified when fade setups become available
- **Continuation Warnings**: Alert when penetration suggests continuation
**To Set Alerts:**
1. Right-click indicator → "Add Alert"
2. Select desired alert condition
3. Configure notification preferences
---
## ⚠️ Important Disclaimers
### **What This Indicator IS:**
✅ A visual warning system to prevent premature fades
✅ A tool to identify when liquidity sweeps have completed
✅ A framework for counter-trend trade timing
### **What This Indicator IS NOT:**
❌ A complete trading system
❌ An entry signal generator
❌ A guarantee of trade success
❌ A substitute for proper risk management
### **Always Remember:**
- "UNLOCKED" = You may CONSIDER a fade (not a signal to trade)
- You still need your own entry confirmation
- You still need proper stop placement
- You still need position sizing and risk management
- Not every unlock leads to a successful trade
- Market context and order flow still matter
---
## 🔧 Recommended Settings by Instrument
### **NQ (Nasdaq-100 E-mini Futures)**
- Mode: Percentage or Fixed Points
- Percentage: 0.30% / 0.10% (default)
- Fixed Points: 75pts / 25pts (default)
### **ES (S&P 500 E-mini Futures)**
- Mode: Percentage
- Danger: 0.25% / Critical: 0.08%
- Or Fixed Points: 15pts / 5pts
### **RTY (Russell 2000 E-mini Futures)**
- Mode: Percentage
- Danger: 0.35% / Critical: 0.12%
- Or Fixed Points: 8pts / 3pts
### **Stocks (High Volume Large Caps)**
- Mode: Percentage (recommended)
- Danger: 0.20-0.40% / Critical: 0.08-0.15%
- Adjust based on ATR and volatility
### **Crypto (BTC, ETH)**
- Mode: Percentage (essential)
- Danger: 0.40-0.60% / Critical: 0.15-0.20%
- Higher volatility requires wider zones
---
## 💡 Pro Tips
1. **Use on Higher Timeframes**: Works best on 5min, 15min, 1hr charts
2. **Combine with Order Flow**: Use with footprint/delta for confirmation
3. **Watch Volume**: Strong volume on sweep = better reversal potential
4. **Consider Time of Day**: Sweeps during RTH often more reliable
5. **Multiple Timeframes**: Check if higher TF also shows unlock
6. **Don't Force Trades**: Not every session produces clean setups
7. **Journal Results**: Track which unlock types work best for you
8. **Respect Continuation Signals**: When indicator says "too deep," listen
---
## 🆘 Troubleshooting
**Q: Box isn't showing up**
A: Check that "Show Danger Zone Boxes" is enabled in Visual Settings
**Q: No price on labels**
A: Enable "Show Price Labels on Lines" in Visual Settings
**Q: Zones seem too tight/wide**
A: Adjust Danger Zone % or points based on current volatility
**Q: Getting too many/too few unlocks**
A: Adjust sweep classification thresholds (min/max penetration)
**Q: Want thicker/thinner lines**
A: Adjust line widths in "PDH/PDL Line Colors" section
**Q: Colors not matching my chart theme**
A: Fully customize all colors in the color settings groups
---
## 📚 Additional Resources
- Study price action around PDH/PDL on your instruments
- Learn about liquidity sweeps and stop hunts
- Understand market structure and order flow
- Practice identifying setups on replay/historical data
- Keep a trading journal of unlock scenarios
---
*Remember: The best trade is often the one you don't take. This indicator helps you avoid the trades you shouldn't take, so you can focus on the ones you should.*

Unmitigated MTF High Low Pro - Cave Diving Bookmap Heatmap Plot
Unmitigated MTF High Low Pro - Cave Diving Bookmap Heatmap Plot
---
## 📖 Table of Contents
1. (#what-this-indicator-does)
2. (#core-concepts)
3. (#visual-components)
4. (#the-cave-diving-framework)
5. (#how-to-use-it-for-trading)
6. (#settings--customization)
7. (#best-practices)
8. (#common-scenarios)
---
## What This Indicator Does
The **Unmitigated MTF High Low v2.0** tracks unmitigated (untouch) high and low levels across multiple timeframes, helping you identify key support and resistance zones that the market hasn't revisited yet. Think of it as a sophisticated memory system for price action - it remembers where price has been, and more importantly, where it *hasn't been back to*.
### Why "Unmitigated" Matters
In futures trading, especially on instruments like NQ and ES, the market has a tendency to revisit levels where liquidity was left behind. An "unmitigated" level is one that hasn't been touched since it was formed. These levels often act as magnets for price, and understanding their age and proximity gives you a significant edge in:
- **Entry timing** - Waiting for price to approach tested levels
- **Exit planning** - Taking profits before ancient resistance/support
- **Risk management** - Avoiding entries when approaching multiple old levels
- **Liquidity mapping** - Visualizing where orders likely cluster
---
## Core Concepts
### 1. **Sessions & Age**
The indicator uses **New York trading sessions** (6:00 PM to 5:59 PM NY time) as the primary time measurement. This aligns with how futures markets naturally segment their activity.
**Age Categories:**
- 🟢 **New (0-1 sessions)** - Fresh levels, recently formed
- 🟡 **Medium (2-3 sessions)** - Tested by time, gaining significance
- 🔴 **Old (4-6 sessions)** - Highly significant, survived multiple days
- 🟣 **Ancient (7+ sessions)** - Extreme significance, major support/resistance
The longer a level remains unmitigated, the more significant it becomes. Think of it like compound interest - time adds weight to these zones.
### 2. **Multi-Timeframe Tracking**
You can set the indicator to track high/low levels from any timeframe (default is 15 minutes). This means you're watching for unmitigated 15-minute highs and lows while trading on, say, a 1-minute or 5-minute chart.
**Why this matters:**
- Higher timeframe levels have more weight
- You can see multiple timeframe structure simultaneously
- Helps you avoid fighting larger timeframe momentum
### 3. **Mitigation**
A level becomes "mitigated" (deactivated) when price touches it:
- **High levels** are mitigated when price reaches or exceeds them
- **Low levels** are mitigated when price reaches or goes below them
Once mitigated, the level disappears from view. The indicator only shows you the untouch levels that still matter.
---
## Visual Components
### 📊 The Dashboard Table
Located in the corner of your chart (configurable), the table shows:
```
┌─────────┬───────────┬────────┬─────┬───────┐
│ Level │ Price │ Points │ Age │ % │
├─────────┼───────────┼────────┼─────┼───────┤
│ ↑↑↑↑↑ │ 21,450.25 │ +45.50 │ 8 │ +0.21%│ ← 5th High (Ancient)
│ ↑↑↑↑ │ 21,430.00 │ +25.25 │ 5 │ +0.12%│ ← 4th High (Old)
│ ↑↑↑ │ 21,420.50 │ +15.75 │ 3 │ +0.07%│ ← 3rd High (Medium)
│ ↑↑ │ 21,412.00 │ +7.25 │ 1 │ +0.03%│ ← 2nd High (New)
│ ↑ ⚠️ │ 21,408.25 │ +3.50 │ 0 │ +0.02%│ ← 1st High (Proximity Alert!)
├─────────┼───────────┼────────┼─────┼───────┤
│ 15 mins │ 🟢 │ Δ 8.75 │ 2U │ │ ← Status Row
├─────────┼───────────┼────────┼─────┼───────┤
│ ↓ ⚠️ │ 21,399.50 │ -5.25 │ 0 │ -0.02%│ ← 1st Low (Proximity Alert!)
│ ↓↓ │ 21,395.00 │ -9.75 │ 2 │ -0.05%│ ← 2nd Low (Medium)
│ ↓↓↓ │ 21,385.25 │ -19.50 │ 4 │ -0.09%│ ← 3rd Low (Old)
│ ↓↓↓↓ │ 21,370.00 │ -34.75 │ 6 │ -0.16%│ ← 4th Low (Old)
│ ↓↓↓↓↓ │ 21,350.75 │ -54.00 │ 9 │ -0.25%│ ← 5th Low (Ancient)
├─────────┼───────────┼────────┼─────┼───────┤
│ 📊 15↑ / 12↓ │ ← Statistics (optional)
└─────────┴───────────┴────────┴─────┴───────┘
```
**Reading the Table:**
- **Level Column**: Number of arrows indicates position (1-5), color shows age
- **Price**: The actual price level
- **Points**: Distance from current price (+ for highs, - for lows)
- **Age**: Number of full sessions since creation
- **%**: Percentage distance from current price
- **⚠️**: Proximity alert - price is within threshold distance
- **Status Row**: Shows timeframe, direction (🟢 bullish/🔴 bearish), tunnel width (Δ), and Strat pattern
### 📈 Visual Elements on Chart
**1. Level Lines**
- Horizontal lines showing each unmitigated level
- **Color-coded by age**: Bright colors = new, darker = older, deep purple/teal = ancient
- **Line style**: Customizable (solid, dashed, dotted)
- Automatically turn **yellow** when price gets close (proximity alert)
**2. Price Labels**
- Show the exact price and age: "21,450.25 (8d)"
- Fixed at small size for clean readability
- Positioned with configurable offset from current bar
**3. Bands (Optional)**
- Shaded zones between pairs of unmitigated levels
- Default: Between 1st and 2nd levels (the "tunnel")
- Can switch to 1st-3rd, 2nd-3rd, or disable entirely
- **Upper band** (pink/maroon) - Between unmitigated highs
- **Lower band** (blue/teal) - Between unmitigated lows
- These represent the "no man's land" or consolidation zones
---
## The Cave Diving Framework
This indicator is designed around the **Cave Diving Trading Framework** - a psychological and technical approach that maps cave diving safety protocols to futures trading risk management.
### 🤿 The Core Metaphor
**Cave diving has clear danger zones based on depth and overhead environment. Your trading should too.**
#### Shallow Water (New Levels, 0-1 Sessions)
- **Light**: Bright colors (bright red highs, bright green lows)
- **Psychology**: Fresh territory, recently tested
- **Trading**: Be aware but not overly concerned
- **Cave Diving Parallel**: You can see the surface, easy exit
#### Penetration Depth (Medium Levels, 2-3 Sessions)
- **Light**: Medium intensity colors
- **Psychology**: Building significance, market memory forming
- **Trading**: Start respecting these levels for entries/exits
- **Cave Diving Parallel**: Deeper in, need to track your line back
#### Deep Dive Zone (Old Levels, 4-6 Sessions)
- **Light**: Dark colors (deep maroon, dark blue)
- **Psychology**: Highly tested support/resistance
- **Trading**: Major decision points, plan accordingly
- **Cave Diving Parallel**: Significant overhead, careful navigation required
#### Overhead Environment (Ancient Levels, 7+ Sessions)
- **Light**: Very dark, purple/deep teal
- **Psychology**: Extreme caution required, major liquidity zones
- **Trading**: These are your "turn back" signals - don't fight ancient levels
- **Cave Diving Parallel**: Maximum danger, no room for error
### 🎯 The Proximity Alert System
Just like a cave diver's depth gauge that warns at critical thresholds, the proximity alerts (⚠️) tell you when you're entering a danger zone. When price gets within your configured threshold (default 5 points), the indicator:
- Highlights the level in **yellow** on the chart
- Shows **⚠️** in the table
- Signals: "You're entering a high-significance zone - adjust your position accordingly"
This prevents the trading equivalent of going deeper into a cave without checking your air supply.
---
## How to Use It for Trading
### 🎯 Entry Strategies
**1. The "Bounce Setup" (Mean Reversion)**
- Wait for price to approach an old or ancient unmitigated level
- Look for confluence: multiple levels nearby, bands narrowing
- Enter when price shows rejection (reversal candle patterns)
- **Example**: Price drops to a 6-session-old low, shows bullish engulfing → Long entry
**2. The "Break and Retest" (Trend Following)**
- Wait for price to break through an unmitigated level (mitigates it)
- Enter on the retest of the newly broken level
- **Example**: Price breaks above 4-session-old high → Wait for pullback to that level → Long entry
**3. The "Tunnel Trade" (Range Trading)**
- When bands are active, trade the range between 1st-2nd levels
- Short near upper band resistance, long near lower band support
- Exit at opposite side or when bands break
### 🚨 Risk Management Rules
**The Ancient Level Rule**
> Never fight ancient levels (7+ sessions). If you're long and approaching an ancient high, take profits. If you're short and approaching an ancient low, take profits.
These levels have survived a full trading week without being touched - there's likely significant liquidity and institutional interest there.
**The Proximity Exit Rule**
> When you see ⚠️ proximity alerts on multiple levels above/below your position, tighten stops or scale out.
This is your "overhead environment" warning. You're in dangerous territory.
**The New Level Filter**
> Be cautious taking positions based solely on new levels (0-1 sessions). Wait for them to age or combine with other confluence.
Fresh levels haven't been tested by time. They're like unconfirmed support/resistance.
### 📊 Reading Market Structure
**Bullish Structure (🟢 in status row)**
- Unmitigated lows are aging and holding
- Price respecting the lower band
- Old lows below acting as strong support
- **Bias**: Look for long entries at lower levels
**Bearish Structure (🔴 in status row)**
- Unmitigated highs are aging and holding
- Price respecting the upper band
- Old highs above acting as strong resistance
- **Bias**: Look for short entries at higher levels
**The Tunnel Compression**
- When the Δ (delta) in the status row is small, levels are tight
- This often precedes a breakout
- **Trading**: Wait for breakout direction, then trade the break
### 🔄 Strat Integration
The indicator shows Strat patterns in the status row:
- **1** - Inside bar (consolidation)
- **2U** - Broke high only (bullish)
- **2D** - Broke low only (bearish)
- **3** - Broke both (wide range, volatility)
Use these with the unmitigated levels:
- **2U near old high** → Potential resistance, watch for rejection
- **2D near old low** → Potential support, watch for bounce
- **3 pattern** → High volatility, respect wider stops
---
## Settings & Customization
### 📅 Session & Timeframe Settings
**HL Interval** (Default: 15 minutes)
- The timeframe for high/low calculation
- **Lower (1m, 5m)**: More levels, more noise, good for scalping
- **Higher (30m, 1H, 4H)**: Fewer levels, stronger significance, good for swing trading
- **Recommendation for NQ/ES**: 15m or 30m for day trading, 1H for swing trading
**Session Age Threshold** (Default: 2)
- How many sessions before a level is considered "old"
- Lower = more levels classified as old
- Higher = stricter definition of significance
### 📊 Level Display Options
**Show Level Lines**
- Toggle: Display horizontal lines for each level
- **Turn off** if you prefer a cleaner chart and only want the table
**Show Level Labels**
- Toggle: Display price labels on the chart
- **Turn off** for minimal visual clutter
**Label Offset**
- Distance (in bars) from current price bar to place labels
- Increase if labels overlap with price action
**Level Line Width & Style**
- Customize visual appearance
- **Thin solid**: Minimal distraction
- **Thick dashed**: High visibility
### 🎨 Age-Based Color Coding
Customize colors for each age category (high and low separately):
- **New (0-1 sessions)**: Default bright red/green
- **Medium (2-3 sessions)**: Default medium intensity
- **Old (4+ sessions)**: Default dark red/blue
- **Ancient (7+ sessions)**: Default deep purple/teal
**Color Strategy Tips:**
- Keep ancient levels in highly contrasting colors
- Use opacity (transparency) if you want subtler lines
- Match your chart's color scheme for aesthetic coherence
### 🎯 Band Settings
**Band Mode**
- **1st-2nd** (Default): The primary "tunnel" between most recent levels
- **1st-3rd**: Wider band, more room for price action
- **2nd-3rd**: Band between less immediate levels
- **Disabled**: No bands, lines only
**Band Colors & Borders**
- Customize fill color and border separately
- **Tip**: Keep bands very transparent (90-95% transparency) to avoid obscuring price action
### ⚠️ Proximity Alert Settings
**Enable Proximity Alerts**
- Toggle: Turn on/off the warning system
- When enabled, levels within threshold distance show ⚠️ and turn yellow
**Alert Threshold** (Default: 5.0 points)
- Distance in points to trigger the alert
- **For NQ**: 5-10 points is reasonable
- **For ES**: 2-5 points is reasonable
- **For MES/MNQ**: Scale down proportionally
**Alert Highlight Color**
- The color lines/labels turn when proximity is triggered
- Default: Yellow (high visibility)
### 📋 Table Settings
**Show Table**
- Toggle: Display the dashboard table
**Table Location**
- Top Left, Top Right, Bottom Left, Bottom Right
- Choose based on your chart layout and other indicators
**Text Size**
- Tiny, Small, Normal, Large
- **Recommendation**: Normal for 1080p monitors, Small for 4K
**Show % Distance**
- Toggle: Add percentage distance column to table
- Useful for comparing relative distances across different price ranges
**Show Statistics Row**
- Toggle: Show total count of unmitigated highs/lows
- Format: "📊 15↑ / 12↓" (15 unmitigated highs, 12 unmitigated lows)
- Useful for gauging overall market structure
### ⚡ Performance Settings
**Enable Level Cleanup**
- Automatically remove very old levels to maintain performance
- **Keep on** unless you want unlimited history
**Max Lookback Levels** (Default: 10,000)
- Maximum number of levels to track
- 10,000 ≈ 6+ months of 15-minute bars
- **Increase** if you want more history
- **Decrease** if experiencing performance issues
**Max Boxes Per Band** (Default: 245)
- TradingView limit is 500 total boxes
- With 2 bands, 245 each = 490 total (safe maximum)
---
## Best Practices
### 🎯 Position Management
**1. Scaling In Near Old Levels**
```
Price approaching 5-session-old low:
- First position: 30% size at proximity alert (⚠️)
- Second position: 40% size at exact level
- Third position: 30% size if it shows strong rejection
```
**2. Scaling Out Near Ancient Levels**
```
Holding long position, approaching 8-session-old high:
- Exit 50% at proximity alert (⚠️)
- Exit 30% at exact level
- Trail stop on remaining 20%
```
### 🧠 Trading Psychology Integration
Drawing from principles in *The Mountain Is You*, this indicator helps you:
**1. Recognize Self-Sabotage Patterns**
- **The Premature Entry**: Entering before price reaches your planned level
- **Solution**: Set alerts at unmitigated levels, wait for proximity warnings
- **The Profit-Taking Problem**: Exiting too early from fear
- **Solution**: Identify the next unmitigated level and commit to holding until proximity alert
- **The Loss Holding**: Refusing to exit losing trades
- **Solution**: When price breaks through and mitigates your entry level, it's telling you the structure changed
**2. Building Better Habits**
The color-coded age system trains your brain to:
- Respect levels that have proven themselves over time
- Distinguish between noise (new levels) and structure (old levels)
- Make decisions based on objective data, not fear or greed
**3. Emotional Regulation**
The proximity alerts serve as:
- **Circuit breakers** - Forcing you to re-evaluate before dangerous zones
- **Permission to act** - Giving you objective signals to exit without second-guessing
- **Validation** - Confirming when you're in alignment with market structure
### 📝 Pre-Market Routine
**Daily Setup Checklist:**
1. ✅ Identify the 3 nearest unmitigated highs above current price
2. ✅ Identify the 3 nearest unmitigated lows below current price
3. ✅ Note which are ancient (7+) - these are your "no-go" zones
4. ✅ Check the tunnel width (Δ in status row) - tight or wide?
5. ✅ Set alerts at the 1st high and 1st low for proximity warnings
6. ✅ Plan: "If we go up, I exit at ___. If we go down, I enter at ___."
### 🔄 Timeframe Confluence
**Multi-Timeframe Strategy:**
Run the indicator on **three instances**:
- **15-minute** (short-term structure)
- **1-hour** (intermediate structure)
- **4-hour** (major structure)
**Strong Setup**: When all three timeframes show unmitigated levels converging at the same price zone.
**Example:**
- 15m: Old low at 21,400
- 1H: Ancient low at 21,398
- 4H: Ancient low at 21,395
- **Result**: 21,395-21,400 is a monster support zone
### ⚠️ What This Indicator Doesn't Do
**Not a Crystal Ball**
- It doesn't predict where price will go
- It shows you where price *hasn't been* and how long it's been avoided
- The trading decisions are still yours
**Not an Entry Signal Generator**
- It provides context and structure
- You need to combine it with your entry methodology (price action, indicators, order flow, etc.)
**Not Foolproof**
- Ancient levels get broken
- Proximity alerts can trigger early in strong trends
- The market doesn't "owe" you a reversal at any level
---
## Common Scenarios
### Scenario 1: "Level Cluster Ahead"
**Situation**: You're long at 21,400. The table shows:
- 1st High: 21,425 (2 sessions old)
- 2nd High: 21,428 (3 sessions old)
- 3rd High: 21,435 (6 sessions old)
**Interpretation**: There's a resistance cluster just 25-35 points away. The 6-session-old level is particularly significant.
**Action**:
- Set first profit target at 21,420 (before the cluster)
- Set second target at 21,426 (between 1st and 2nd)
- Trail remaining position, but be ready to exit on rejection at 21,435
**Cave Diving Analogy**: You're approaching an overhead section with limited clearance. Lighten your load (reduce position) before entering.
---
### Scenario 2: "Ancient Level Approaches"
**Situation**: The market is grinding higher. You see ⚠️ appear next to a 9-session-old high at 21,500.
**Interpretation**: This level has survived over a week without being touched. Massive potential liquidity zone.
**Action**:
- If long, this is your absolute exit zone. Take profits before or at level.
- If looking to short, wait for clear rejection (price taps and reverses)
- Don't try to buy the breakout until it clearly breaks and retests
**Cave Diving Analogy**: Your dive computer is beeping - you've reached your planned turn-back depth. No matter how interesting it looks ahead, honor your plan.
---
### Scenario 3: "Mitigated Levels Create New Structure"
**Situation**: Price breaks and mitigates the 1st High. The previous 2nd High becomes the new 1st High.
**Interpretation**: The structure just shifted. What was the 2nd level is now most relevant.
**Action**:
- Watch how price reacts to the newly-mitigated level
- If it holds below (acts as resistance), bearish
- If it reclaims and holds above (acts as support), bullish
- The NEW 1st High is your next target/resistance
**Cave Diving Analogy**: You've passed through a restriction - the cave layout ahead is different now. Update your mental map.
---
### Scenario 4: "Tight Tunnel, Upcoming Breakout"
**Situation**: The Δ in the status row shows 3.25 points (very tight). Bands are converging.
**Interpretation**: Price is consolidating between very close unmitigated levels. Breakout likely.
**Action**:
- Don't try to predict direction
- Set alerts above 1st High and below 1st Low
- When break occurs, trade the retest
- Expect volatility - use wider stops
**Cave Diving Analogy**: You're in a narrow passage. Movement will be sudden and directional once it starts.
---
### Scenario 5: "Imbalanced Structure"
**Situation**: The statistics row shows "📊 22↑ / 7↓"
**Interpretation**: There are many more unmitigated highs than lows. This suggests:
- Price has been declining (hitting lows, leaving highs behind)
- Potential bullish reversal zone (lots of overhead supply mitigated)
- Or continued bearish structure (resistance everywhere above)
**Action**:
- Look at the age of those 22 highs
- If mostly new (0-2 sessions): Just a recent downmove, not significant yet
- If many old/ancient: Strong overhead resistance, be cautious on longs
- Compare to price action: Is price respecting the remaining lows?
**Cave Diving Analogy**: You've swam deeper than your starting point - most of your markers are above you now. Are you planning the ascent or going deeper?
---
## Final Thoughts: The Philosophy
This indicator is built on a simple but powerful principle: **The market has memory, and that memory has weight.**
Every unmitigated level represents:
- Liquidity left behind
- Orders waiting to be filled
- Institutional interest potentially parked
- Psychological significance for participants
The longer a level remains unmitigated, the more "charged" it becomes. When price finally revisits it, something significant usually happens - either a strong reversal or a definitive break.
Your job as a trader isn't to predict which outcome will occur. Your job is to:
1. **Recognize** when you're approaching these charged zones
2. **Respect** them by adjusting position size and risk
3. **React** appropriately based on how price behaves at them
4. **Remember** that ancient levels (like ancient wisdom) deserve extra reverence
The Cave Diving Framework embedded in this indicator serves as a constant reminder: Trading, like cave diving, requires rigorous respect for environmental hazards, meticulous planning, and the discipline to turn back when your limits are reached.
**Every proximity alert is the market asking you**: *"Do you really want to go deeper?"*
Sometimes the answer is yes - when your setup, confluence, and risk management all align.
Often, the answer should be no - and that's the trader avoiding the accident that would have happened to the gambler.
---
### 🎯 Quick Reference Card
**Color System:**
- 🟢 Bright colors = New (0-1 sessions) = Shallow water
- 🟡 Medium colors = Medium (2-3 sessions) = Penetration depth
- 🔴 Dark colors = Old (4-6 sessions) = Deep dive zone
- 🟣 Deep dark colors = Ancient (7+ sessions) = Overhead environment
**Symbols:**
- ↑ ↑↑ ↑↑↑ ↑↑↑↑ ↑↑↑↑↑ = High levels (1st through 5th)
- ↓ ↓↓ ↓↓↓ ↓↓↓↓ ↓↓↓↓↓ = Low levels (1st through 5th)
- ⚠️ = Proximity alert (danger zone)
- 🟢 = Bullish structure
- 🔴 = Bearish structure
- Δ = Tunnel width (distance between 1st high and 1st low)
**Critical Rules:**
1. Never fight ancient levels (7+ sessions)
2. Respect proximity alerts (⚠️)
3. Scale out near old/ancient resistance
4. Wait for confluence when entering
5. Let mitigated levels prove their new role
---
**Remember**: The indicator gives you structure. The trading edge comes from your discipline in respecting that structure.
Trade safe, trade smart, and always know your exit before your entry. 🎯
---
*"You don't become your best self by denying your patterns. You become your best self by recognizing them, understanding them, and choosing differently." - Adapted from The Mountain Is You*
In trading: You don't become profitable by ignoring market structure. You become profitable by recognizing it, understanding it, and choosing your entries accordingly.
