RSI Overbought Divergence Indicator with AlertsThis indicator alerts you only if there are divergences after price was oversold or overbought
Tìm kiếm tập lệnh với "alert"

Inverse Fisher Transform on RSI for backtest w/alertsThis version of the Inverse Fisher Transform on RSI comes with support for
1) Backtesting with Gavin's backtest script
2) Bypass, you can use another indicator to pause buy signals from this indicator. Just create another indicator that plots "1" whenever you want to activate the bypass on the IFTRSI signal.
3) Independent buy and sell level thresholds. Some tokens perform better with a higher sell level, even levels as high as 0.996, sometimes the buy level can also be relaxed to even 0.6 and get incredible results on the 5 minute chart.
4) alerts for Buy and Sell signals
Make sure you add Gavin's backtest and select external signal and this indicator as the source.

Darvas box (with alerts)Darvas box by Nicholas Darvas, extended original script by KıvanÇ @fr3762 to use new PineScript v4 function box.new()
You can create alerts with this script when price break to the upside or downside from Darvas box

Smart EMA SignalsThis indicator starts by plotting each time the price action crosses above or below the EMA, of which you can tune the timeframe and duration.
It then takes it a step further and plots whether or not that indicator would have given you a profitable trade, of which you can also tune the parameters (Max wait time, and % Profit).
Once you have your EMA tuned to your liking, set up alerts to notify you of a golden opportunity.

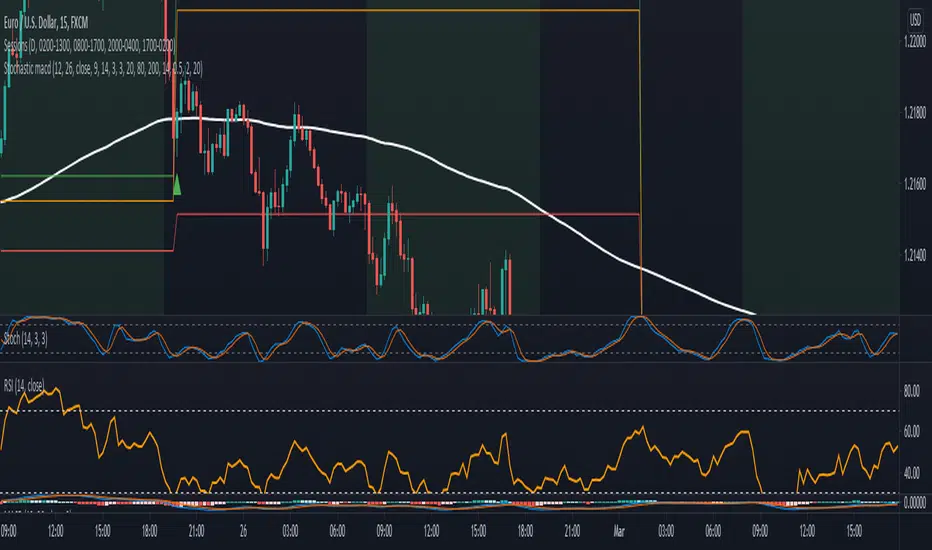
Relative Strength Index w/ 3 Levels & 0 Line Colour (by WJ)NOTE:
// RSI CODE TAKEN FROM DEFAULT INDICATOR
// I HAVE ONLY MADE SOME ADJUSTMENTS FOR VISUAL AID
// I MADE THIS FOR MY OWN USE BUT HAVE DECIDED TO PUBLISH AND SHARE IN CASE ANYBODY WANTS TO USE IT
This is the normal default built-in RSI indicator which I have added some stuff for visual aid:
Added middle line (50)
RSI turns green when crossed above 50
RSI turns red when crossed below 50
RSI background turns green and red on crossover candle based on whether RSI just crossed over or below 50 respectively
Alert notification on the crossover candle
EMA+RSI Pump & Drop Swing Sniper (With Alerts)This is using an EMA and RSI with slightly modified settings to give good entry and exit points while looking at Bitcoin. I use this on a 4-hour chart and with other indicators to find good positions to enter a trade or exit if things are turning red.
If you click on the EMA line it will color the bars of the chart based on if they are above or below the EMA - This is just visually helpful for me to see the active trend.
Make sure you hover over or click on the EMA line to see the colors of the candles change - it's not visible by default or without doing this.

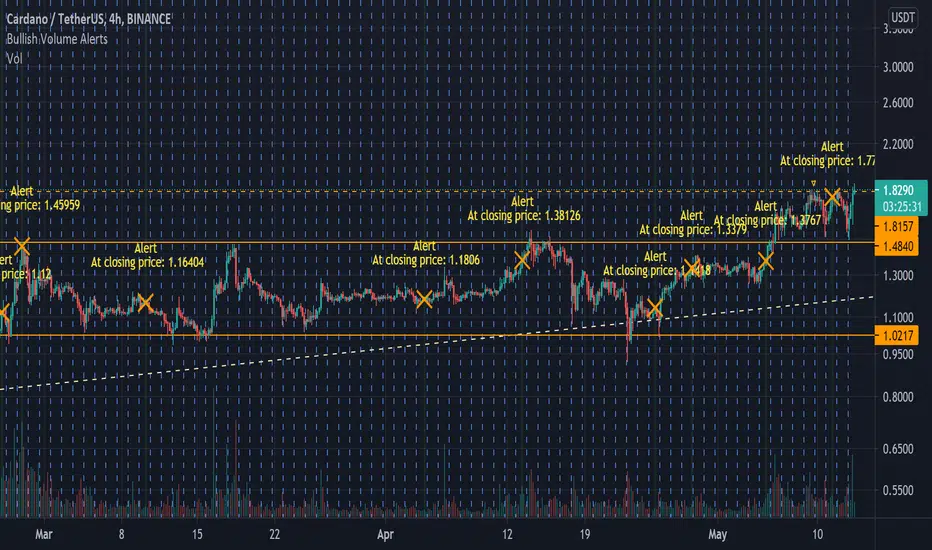
Bullish Volume [Alerts]A really simple script I made for someone, but also noticed I couldn't find anything like it that's as quick or simple (I may just be dumb)
Simply labels out and alerts you when three consequently higher volume bars appear, pretty useless on its own but for crypto, it works great to quickly notice if some important fundamentals suddenly cause the price to rocket. It works best with hour timeframes. Personally I'd use it with 4h.
I find it useful to know if something in a market is stirring attention and hope others can find it useful.
Squeeze Momentum Indicator MTF with alerts [lazy bear]MTF version of the popular squeeze momentum indicator, created and shared by Lazy Bear

Three EMA and Stochastic RSI Signals with TP and SL AlertsThis is kind of similar to one of my other scripts but I figured people might be looking for this one in a simple wrapped up package. It takes 3 EMAs, a 50, 14 and an 8 and the trade signals come from crossovers of the Stochastic RSI lines and conditions that marry up with the EMAs lining up in an uptrend or downtrend condition. I used the TP and SL lines from one of my other scripts so you can see where the winners and losers are. Includes alerts so they can be used with webhooks to automate however you wish. I have added signal confirmation with Weiss Wave Volume on side with trend. Stop and TP Levels are configurable in the settings as well as the periods for the ATR used in these calculations.

Divergence Indicator with alertsFirst time I've published a script so go easy!
All credit goes to @yatrader2 for the script, I have just made it easier to set alerts on it.
Enjoy!

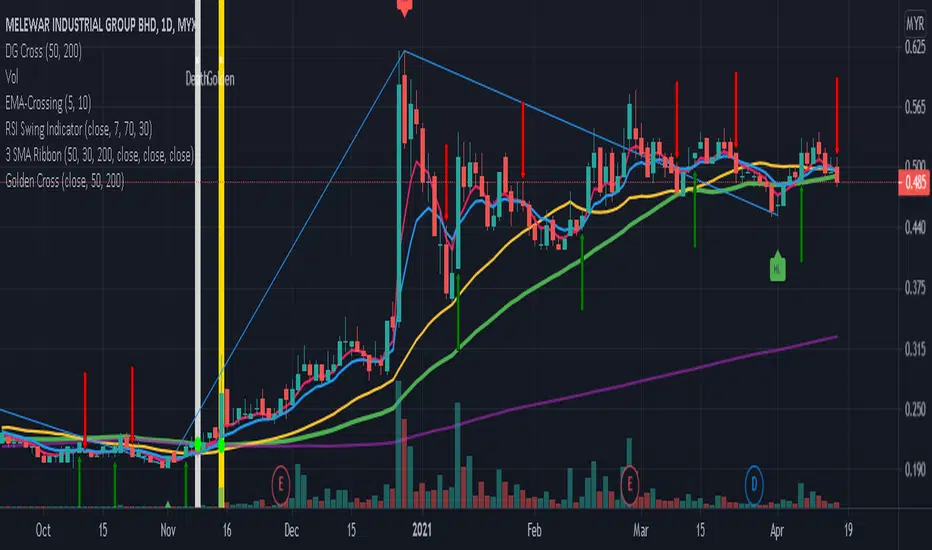
Golden & Death Cross SMA 50 Cross SMA 200 Alert by pakmanGolden & Death Cross SMA 50 Cross SMA 200 Alert by pakman
Full CRYPTO pack macd, rsi, obv, ema alert versionThis is the indicator version of a simple, yet very efficient crypto strategy, adapted to 4h time frame, on big coins like ETH and BTC . However it can be adapted to other markets, timeframes etc
For this strategy I use a combination of a trend line , an oscillator, price action and volume .
This study has alert for both long and short entries/exit.
The rules are the next ones:
Long : we check that current candle is ascending and above the moving average, the macd is in positive range, rsi is below overbought level and volume is bigger than the moving avg of volume .
For short, we have the opposite long rules.
If you have any questions, please let me know !

Stochastic with MACD filter + SL/TP + AlertsLong Arrow : close of the candle is above ema + Stochastic is oversold + MACD is below 0 + Stochastic cross up
Short Arrow : close of candle is below ema + Stochastic is overbought + MACD is above 0 + Stochastic cross down
Also added SL, 1:1 and TP where SL can be varied by ATR value and TP is set to 2:1 RR but it can be varied too.
It is not meant to take every single trade even though that might already be profitable.
For higher winrate look for the higher timeframe trend for example when trading the 15min look if the Daily 8ema is going up or down.
Also only take trades when there is either a hidden divergence on RSI or a smaller normal divergence.
The I take the normal divergenes alo when there is no higher high like an M or lower low for longs like a W these tend to work out pretty good too.
Alerts are in it too.
Have Fun :)
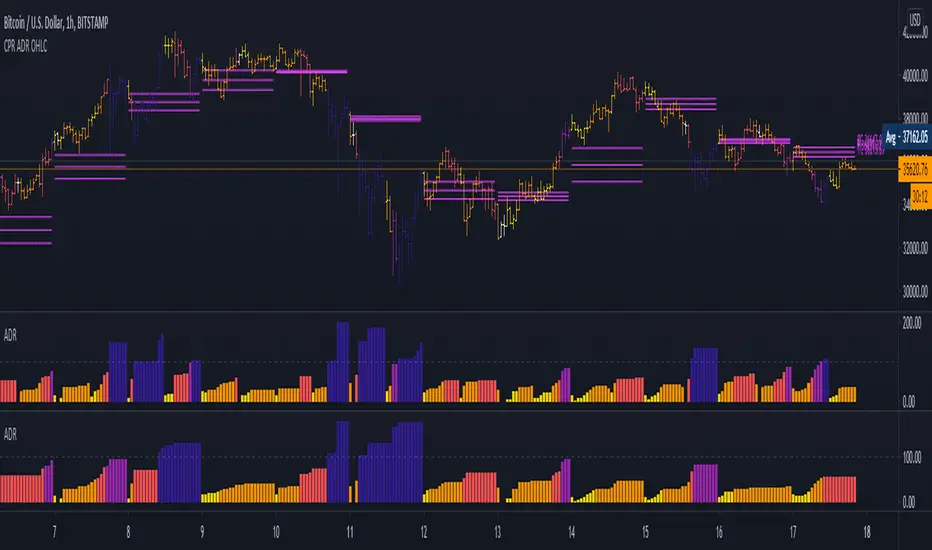
5 Day ADR ICT Intraday Tracker + Timeframes, Alerts, BarcolorsThis indicator gives you a hint on hypothetical room left for a trade by tracking todays current range as a percentage of the 5 Day ADR.
Look for entries in yellow and orange zones and exits on dark blue once the ADR is reached.
I just added a Timeframe, Alerts for High and Low Zones and an option to colorize the Bars/Candles to "5 Day ADR ICT Intraday Tracker" by BryceWH
Ichimoku Alert Indicator Buy Sell Please Take Trade as per your own risk.
Hi, this my new script which show you correct Ichimoku signals, when price exit cloud.
SELL SIGNAL:
- red line below blue
- green line below price
- price exit cloud bottom
- price below 3 EMA's!
BUY SIGNAL:
- red line above blue
- green line above price
- price exit cloud upper
- price above 3 EMA's!
You can change ichimoku parameters and input 3 EMA's. If u dont want use any of the EMA's then input 1 into them.
Comments