Ergotic MACD Strategy Backtest This is one of the techniques described by William Blau in his book
"Momentum, Direction and Divergence" (1995). If you like to learn more,
we advise you to read this book. His book focuses on three key aspects
of trading: momentum, direction and divergence. Blau, who was an electrical
engineer before becoming a trader, thoroughly examines the relationship
between price and momentum in step-by-step examples. From this grounding,
he then looks at the deficiencies in other oscillators and introduces some
innovative techniques, including a fresh twist on Stochastics. On directional
issues, he analyzes the intricacies of ADX and offers a unique approach to help
define trending and non-trending periods.
Blau`s indicator is like usual MACD, but it plots opposite of meaningof
stndard MACD indicator.
You can change long to short in the Input Settings
Please, use it only for learning or paper trading. Do not for real trading.
Tìm kiếm tập lệnh với "backtest"

Elder Ray (Bull Power) Strategy Backtest Developed by Dr Alexander Elder, the Elder-ray indicator measures buying
and selling pressure in the market. The Elder-ray is often used as part
of the Triple Screen trading system but may also be used on its own.
Dr Elder uses a 13-day exponential moving average (EMA) to indicate the
market consensus of value. Bull Power measures the ability of buyers to
drive prices above the consensus of value. Bear Power reflects the ability
of sellers to drive prices below the average consensus of value.
Bull Power is calculated by subtracting the 13-day EMA from the day's High.
Bear power subtracts the 13-day EMA from the day's Low.
You can use in the xPrice any series: Open, High, Low, Close, HL2, HLC3, OHLC4 and ect...
You can change long to short in the Input Settings
Please, use it only for learning or paper trading. Do not for real trading.

ECO Strategy Backtest We call this one the ECO for short, but it will be listed on the indicator list
at W. Blau’s Ergodic Candlestick Oscillator. The ECO is a momentum indicator.
It is based on candlestick bars, and takes into account the size and direction
of the candlestick "body". We have found it to be a very good momentum indicator,
and especially smooth, because it is unaffected by gaps in price, unlike many other
momentum indicators.
We like to use this indicator as an additional trend confirmation tool, or as an
alternate trend definition tool, in place of a weekly indicator. The simplest way
of using the indicator is simply to define the trend based on which side of the "0"
line the indicator is located on. If the indicator is above "0", then the trend is up.
If the indicator is below "0" then the trend is down. You can add an additional
qualifier by noting the "slope" of the indicator, and the crossing points of the slow
and fast lines. Some like to use the slope alone to define trend direction. If the
lines are sloping upward, the trend is up. Alternately, if the lines are sloping
downward, the trend is down. In this view, the point where the lines "cross" is the
point where the trend changes.
When the ECO is below the "0" line, the trend is down, and we are qualified only to
sell on new short signals from the Hi-Lo Activator. In other words, when the ECO is
above 0, we are not allowed to take short signals, and when the ECO is below 0, we
are not allowed to take long signals.
You can change long to short in the Input Settings
Please, use it only for learning or paper trading. Do not for real trading.

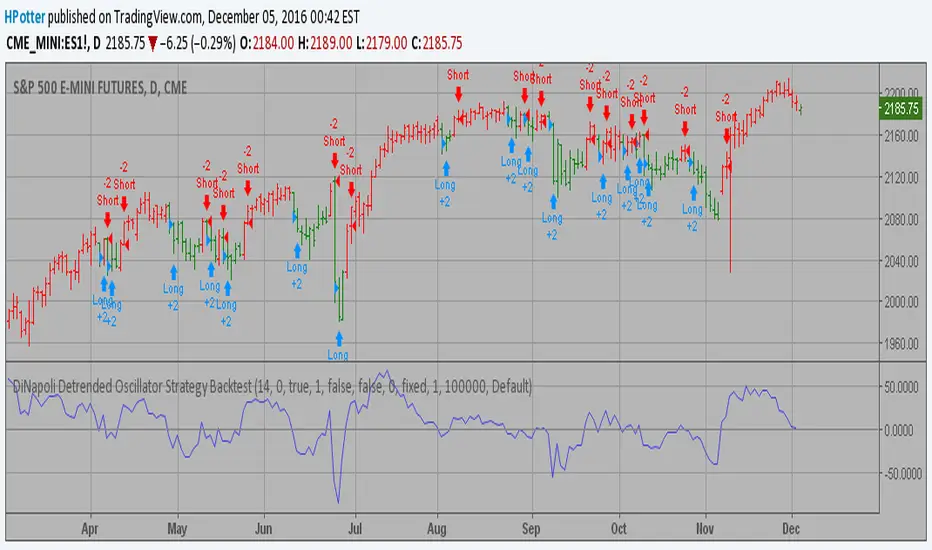
DiNapoli Detrended Oscillator Strategy Backtest DiNapoli Detrended Oscillator Strategy
You can change long to short in the Input Settings
Please, use it only for learning or paper trading. Do not for real trading.
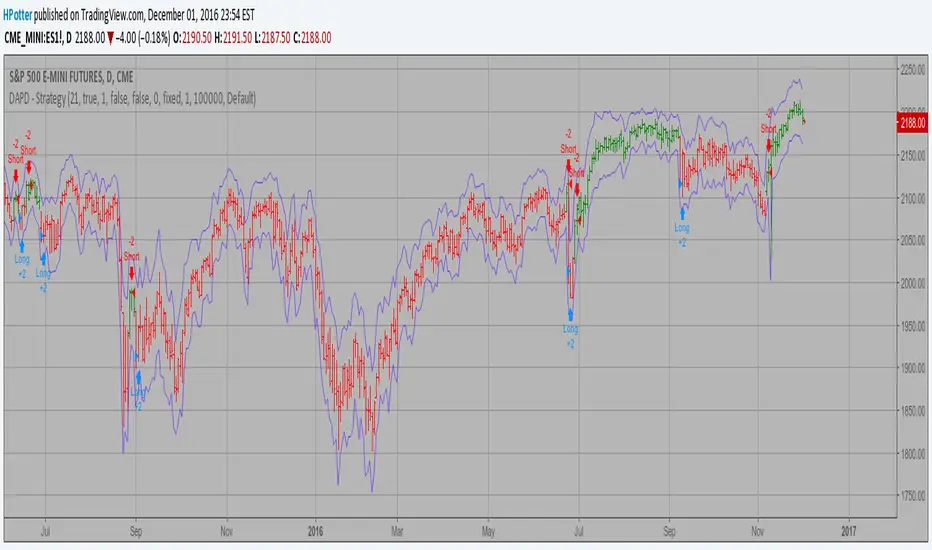
DAPD - Strategy Backtest This indicator is similar to Bollinger Bands. It based on DAPD - Daily
Average Price Delta. DAPD is based upon a summation for each of the
highs (hod) for the 21 days prior to today minus the summation for
each of the lows (lod) for the last 21 days prior to today. The result
of this calculation would then be divided by 21.
It will be buy when high above previos DAPD high and sell if low below previos DAPD low
You can change long to short in the Input Settings
Please, use it only for learning or paper trading. Do not for real trading.
Chaikin Volatility Strategy Backtest Chaikin's Volatility indicator compares the spread between a security's
high and low prices. It quantifies volatility as a widening of the range
between the high and the low price.
You can use in the xPrice1 and xPrice2 any series: Open, High, Low, Close, HL2,
HLC3, OHLC4 and ect...
You can change long to short in the Input Settings
Please, use it only for learning or paper trading. Do not for real trading.

CCI Strategy Reversed Backtest The Commodity Channel Index (CCI) is best used with markets that display cyclical or
seasonal characteristics, and is formulated to detect the beginning and ending of these
cycles by incorporating a moving average together with a divisor that reflects both possible
and actual trading ranges. The final index measures the deviation from normal, which indicates
major changes in market trend.
To put it simply, the Commodity Channel Index (CCI) value shows how the instrument is trading
relative to its mean (average) price. When the CCI value is high, it means that the prices are
high compared to the average price; when the CCI value is down, it means that the prices are low
compared to the average price. The CCI value usually does not fall outside the -300 to 300 range
and, in fact, is usually in the -100 to 100 range.
You can change long to short in the Input Settings
Please, use it only for learning or paper trading. Do not for real trading.

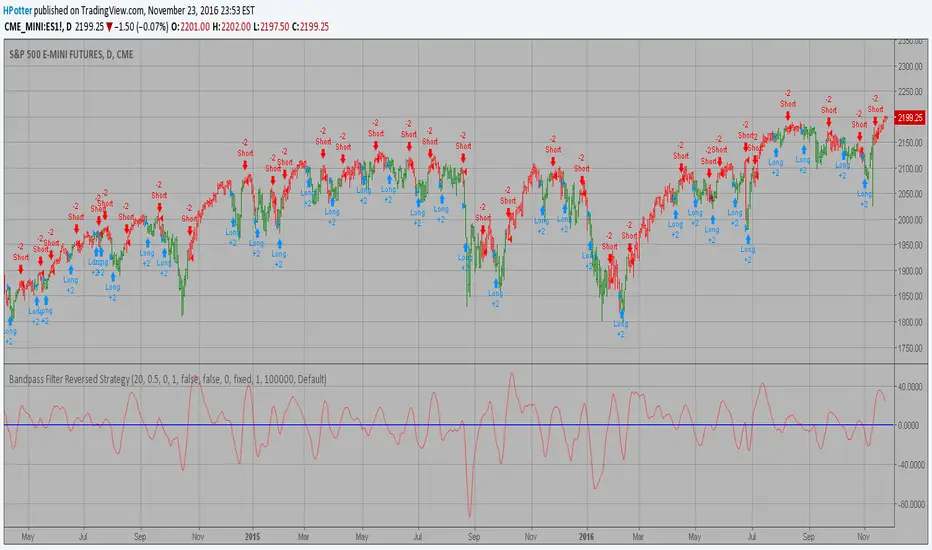
Bandpass Filter Reversed Strategy BacktestThe related article is copyrighted material from
Stocks & Commodities Mar 2010
You can use in the xPrice any series: Open, High, Low, Close, HL2, HLC3, OHLC4 and ect...
Please, use it only for learning or paper trading. Do not for real trading.
3-Bar-Reversal-Pattern Strategy Backtest This startegy based on 3-day pattern reversal described in "Are Three-Bar
Patterns Reliable For Stocks" article by Thomas Bulkowski, presented in
January, 2000 issue of Stocks&Commodities magazine.
That pattern conforms to the following rules:
- It uses daily prices, not intraday or weekly prices;
- The middle day of the three-day pattern has the lowest low of the three days, with no ties allowed;
- The last day must have a close above the prior day's high, with no ties allowed;
- Each day must have a nonzero trading range.
Please, use it only for learning or paper trading. Do not for real trading.

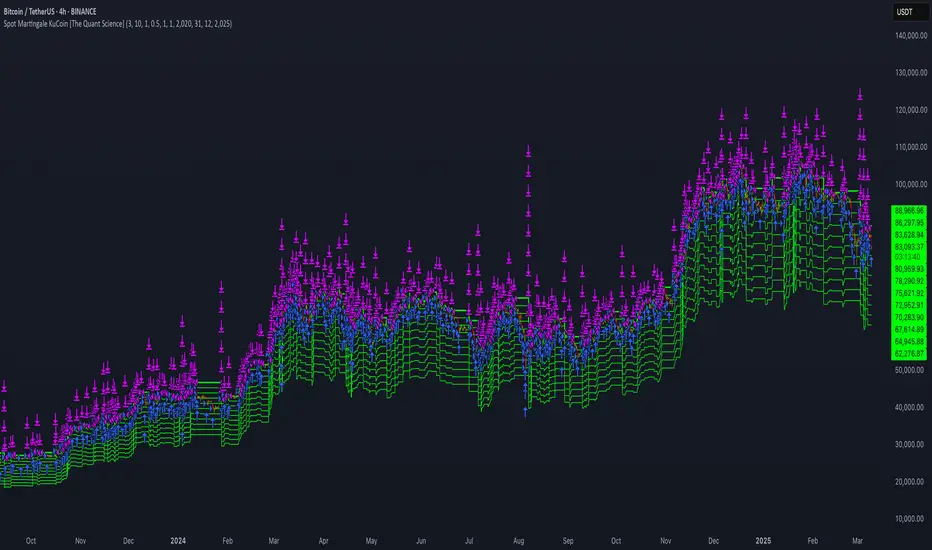
Spot Martingale KuCoin - The Quant ScienceINTRODUCTION
Backtesting software of the Spot Martingale algorithm offered by the KuCoin exchange.
This script replicates the logic used by the KuCoin bot and is useful for analyzing strategy on any cryptocurrency historical series.
It's not intended as an automatic trading algorithm and does not offer the possibility of automatic order execution.
The trader will use this software exclusively to research the best parameters with which to work on KuCoin.
LOGIC OF EXECUTION
The execution of orders is composed as follows:
1) Start Martingale: initial order
2) Martingale-Number: orders following Start Martingale
(A) The software is designed and developed to replicate trading without taking into account technical indicators or particular market conditions. The Initial Order (Start Martingale) will be executed immediately the close of the previous Martingale when the balance of market orders is zero. It will use the capital set in the Properties section for the initial order.
(B) After the first order, the software will open new orders as the price decreases. For orders following Start Martingale, the initial capital, multiplier, and number of orders in the exponential growth context are considered. The multiplier is the factor that determines the proportional increase in capital with each new order. The number of orders, indicates how many times the multiplier is applied to increase the investment.
Example
To find out the capital used in Martingale order number 5, with a Multiple For Position Increase equal to 2 and a starting capital of $100, the formula will be as follows:
Martingale Order = ($100 * (2 * 2 * 2 * 2 * 2)) = $100 * 32 = $3.200
(C) A multiplier is used for each new order that will increase the quantity purchased.
(D) All previously open orders are closed once the take profit is reached.
USER MANUAL
The user interface consists of two main sections:
1. Settings
Percentage Drop for Position Increase (0.1-15%) : percentage distance between Martingale orders. For example, if you set 5% each new order will be opened after a 5% price decrease from the previous one.
Max Position Increases (1-15) : number of Martingale orders to be executed after Start Martingale. For example, if you set 10, up to10 orders will be opened after Start Martingale.
Multiple For Position Increase (1-2x) : capital multiplier. For example, if you set 2 each for each new order, the capital involved will be doubled, order by order.
Take Profit Percentage (0.5-1000%) : percentage take profit, calculated on the average entry price.
2. Date Range Backtesting
The Date Range Backtesting section adjusts the analysis period. The user can easily adjust the UI parameters, and automatically the software will update the data.
LIMITATIONS OF THE MODEL
Although the Martingale model is widely used in position management, even this model has limitations and is subject to real risks during particular market conditions. Knowing these conditions will help you understand which asset is best to use the strategy on.
The main risks in adopting this automatic strategy are 2:
1) The price falls below our last order.
It happens during periods of strong bear-market in which the price collapses abruptly without experiencing any pullback. In this case the algorithm will enter a drawdown phase and the strategy will become a loser. The trader will then have to consider whether to wait for a price recovery or to incur a loss by manually closing the algorithm.
2) The price increases quickly.
It happens during periods of strong bull-market in which the price rises abruptly without experiencing any pullback. In this case the algorithm will not optimize order execution, working only with Start Martingale in the vast majority of trades. Given the exponential nature of the investment, the algorithm will in this case generate a profit that is always less than that of the reference market.
The best market conditions to use this strategy are characterized by high volatility such as correction phases during a bull run and/or markets that exhibit sideways price trends (such as areas of accumulation or congestion where price will generate many false signals).
FEATURES
This script was developed by including features to optimize the user experience.
Includes a dashboard at launch that allows the user to intuitively enter backtesting parameters.
Includes graphical indicator that helps the user analyze the behavior of the strategy.
Includes a date period backtesting feature that allows the user to adjust and choose custom historical periods.
DISCLAIMER
This script was released using parameters researched solely for the BTC/USDT pair, 4H timeframe, traded on the KuCoin Exchange (2017-present). Do not consider this combination of parameters as universal and usable on all assets and timeframes.
Custom XABCD Validation and Backtesting ToolOverview:
We hear a lot about Gartleys, bats, crabs and the rest of the barnyard crew, but have you ever wondered what other creatures might be lurking out there yet to be discovered? Well wonder no longer, it's time to find out for yourself! The Custom XABCD Validation and Backtesting Tool allows you to define retracement ratios and targets for your very own patterns.
Tips:
(1) Adjust the patterns entry/stop/target configuration and see how it affects the pattern's backtesting results.
(2) Adjust the weights of pattern score components (% error, PRZ confluence, Point D/PRZ confluence), along with the entry minimum score requirements ('If score is above'), and see how it affects the patterns' results.
Pattern Scoring:
The pattern's score is an attempt to represent the quality of a pattern with a single metric. This is one of the most powerful aspects of the tool because it can quickly tell you whether a trade is worth entering. The score is based on 3 components:
(1) Retracement % Accuracy - this measures how closely a pattern's retracement ratios match your defined theoretical values. You can change the "Allowed ratio error %" in Settings to be more or less inclusive.
(2) PRZ Level Confluence - Potential Reversal Zone levels are retracements of the XA, BC, and/or XC legs. These levels indicate where a potential reversal might occur (i.e. pivot point D). The PRZ Level Confluence component measures the closeness of the two closest PRZ levels, relative to the height of the of the XA leg.
(3) Point D / PRZ Confluence - this measures the closeness of point D to either of the two closest PRZ levels (identified in the PRZ Level Confluence component above), relative to the height of the XA leg. In theory, the closer together these levels are, the higher the probability of a reversal.
While the score is percentage-based, it should not be confused with a probability. A score of 96% does not imply a 96% chance of success. It simply represents the average of the three components mentioned above, weighted according to the defined weight parameters. A score of 100% would mean that (1) all leg retracements match the defined theoretical retracement ratios exactly, (2) all PRZ retracement levels are exactly the same value, and (3) pivot point D occurred exactly at the confluent PRZ level.
Pattern scoring research has been ongoing since I introduced the concept with my Harmonic Pattern Detection, Prediction and Backtesting Tool (see below). So the way that the score is calculated is subject to change based on the results of that research.

Cava Signals Backtesting/VisualizerPLEASE READ THE DESCRIPTION CAREFULLY
Trying this again, as it seems I keep violating the rules unintentionally. Moderator, please forgive me as I try to make this right.
This backtesting/visualizer script was created for me to get a visual idea of the Cava Signals indicator throughout its development time and continuous optimization.
This script is to be used on the 30-minute timeframe on supported markets, and whether I can only publish strategies on regular candles, the indicator is meant to trigger on heikin ashi candles.I understand backtesting on non-regular candles produces unrealistic results, but I emphasize that this script is more for visualization purposes rather than accurate $ amounts from the trades. The signals are used along with a dedicated bot configuration, so part of the strategy is not managed by the script, but by the bot's config.
Some behind the scenes on what we are looking at:
a combination of ema and sma crosses on different time frames (5m, 15m, 30m, 60m and 90m) - we call this the wave trend
a combination of stochastic rsi on different time frames (10m, 30m)
a combination of schaff trend cycles on different time frames (5m, 20m and 30m)
a combination of money flow index on different time frames (10m and 30m)
volume information for each supported market/pair
and a couple of other info particular to each pair
With the above combination of data points, we try to optimize our strategy for an entry, for dca'ing down in case the coin goes down as well as dca'ing up to maximize profit when a coin is going up, take profit levels when we recognize a good time to do so, and of course, a closing level. I would like to emphasize the *visualization* purpose of this script in recognizing lows, highs, and market structure to identify the important levels to signal - this script is NOT to be used for accurate backtesting, but for an idea of the overall performance of when signals are triggered.
Let me try to explain the workflow and icons you see on the chart:
The colored circles on the bottom of the chart are all buy signals; each color corresponds to a particular buy signal, we have a combination of 9 possible situations that would trigger a buy signal. Some would trigger a buy signal only in combination with other buy signals or other indicators within the script. we also display a green upwards arrow below bars when a buy signal is triggered.
The colored arrows pointing down on the top of the chart are close signals. We have a combination of 5 closing criteria each color corresponds to one, just like the buy signals do. We only close a trade in profit. If not in profit, we will look to DCA down.
DCA signals are shown by the green flag above bars. they are signals to DCA up or down depending on the trade being negative or positive. DCA'ing up or down is also managed by the bot's configuration for limits on when to accept the signal.
Take Profit levels are shown by the green diamond above bars and work in conjunction with the bot's config on when to take the signal if at all and other take profit levels. Usually, when we hit the first take profit level we move our stop loss to entry via the bot's take profit safety feature. You can see this call with the close entry named TPS .
The black bars you may see on the chart is to illustrate when the market is extended based on a particular strategy. During this period we will not trigger a buy signal unless there is a huge spike in positive volume .
The green number below the bars is the total positive delta volume on the buy candles.
On the table on the right upper corner, we show some information on the market and performance of the backtesting - for visualization purposes only!
Currently, the script is tailored to work with the following markets/pairs:
Binance Spot: ADA, ALGO, ATOM, AVAX, BNB, BTC , DOT, ETH, LINK, LUNA, MATIC, SOL, VET, XRP, XTZ
Binance Futures: BTC , ETH, ADA, ALGO, ATOM, BNB, COMP, DOT, ENJ , LINK, OCEAN, OMG, SOL, VET, XMR, XRP, XTZ, AVAX, AAVE, DOGE, LTC, LUNA, MKR , NEAR, ONT, RUNE, SUSHI, LTC, XLM , COMP, ONT, THETA, FTM , EGLD , WAVES, ONE, HTN , CHZ , HOT, MANA, CRV , RVN, BAT, ANKR, 1INCH, ALICE, ATA , AXS , CHR , COTI, NKN , RAY, REN, SRM , SXP , TLM
ByBit Inverse Perpetual: BTCUSD , ETHUSD
ByBit Futures: AAVE, ADA, ALGO, AVAX, AXS , BNB, BTC , DOT, ETH, LINK, LTC, MATIC, SOL, SUSHI, UNI , XEM, XRP, XTZ
The chosen pairs are subject to change based on the best-performing assets we are constantly analyzing.
I hope this helps to understand the script, its purpose and ideas. I hope this satisfies the community rules - it was not my intention to break them - if there's anything on the above or the script that still violates the guidelines, please let me know and accept my apologies in advance.
If anyone would like to know more, let me know in the comment section.
Thank you!

BLANK Strategy + TSL + Backtestrange- I often see ppl struggeling do the first own strategy
- this is an example, for a smooth start
- EDIT it to your needs ( DELET my EXAMPELS and add your INPUTS/CONDITIONS)
- i added also a Backtestrange, so you can test your Strategy in different marketphases
- also added a trailing-stop-loss

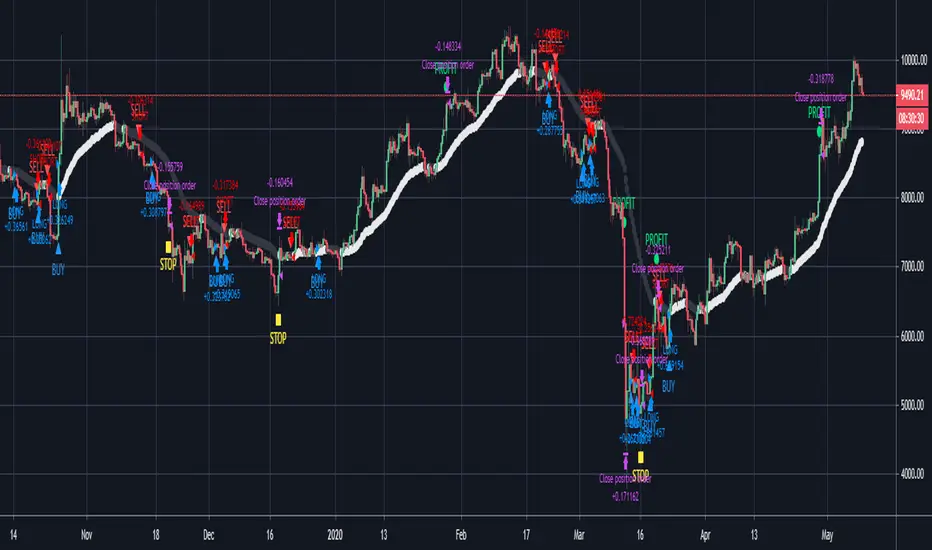
BitcoinNinjas 'Ninja Signals' Buy/Sell Alert Trading Script v3.0Bitcoin Ninjas 'Ninja Signals' Buy/Sell Alerts & Backtesting TradingView Script v3.0
(for Cryptocurrencies, Forex, GunBot, ProfitTrailer, automatic trading software, and more)
This is version 3 of our popular Ninja Signals trading script, which is similar to version 2, but with a new hard-coded calibration (resolution) setting that automatically matches candle size (period) to ensure that no repainting occurs regardless of the number or type of indicators and filters traders apply when configuring the script.
'Ninja Signals' v3.0 (SCRIPT)
'Ninja Signals' v3.0 (STRATEGY)
'Ninja Signals' v2.0 (SCRIPT)
'Ninja Signals' v2.0 (STRATEGY)
'Ninja Signals' v1.0 (SCRIPT)
'Ninja Signals' v1.0 (STRATEGY)
-Allows users to easily set automated buy and sell alerts on TradingView for use with automatic and manual trading of cryptocurrencies, Forex securities, and more (alerts are compatible with automatic trading software such as GunBot, ProfitTrailer, and more).
-Synthesizes many powerful indicators [e.g. Relative Strength Index (RSI), stochastic RSI, Money Flow Index (MFI), Moving Average Convergence Divergence (MACD), etc.) into one super script to generate very precise buy and sell signals in almost any market condition.
-Buy arrows (blue) and sell arrows (red) can be changed or hidden for ease of viewing.
-No lag EMA trendline featuring trend-reversal color-coding (white uptrend, black downtrend).
-Adjustable ‘calibration’ setting allows users to customize the script to work for any currency or security available through TradingView, on any exchange, simply by adjusting a number.
-Complete with backtesting strategy version of script which allows users to test various buy and sell strategies based on the alerts the script generates (see info and screenshots below).
-Backtesting strategy incorporates a user-defined adjustable date range, so users can estimate the script’s performance over specific periods of time, such as the last day, week, or month.
-Backtesting strategy utilizes a minimum protective gain setting to help you never sell for a loss. Simply adjust your minimum profit (%) per trade, and the test results will update.
-Backtesting strategy allows for pyramid buying to test various average down / double up buying strategies. Simply adjust the number of pyramid buys and the quantity of each buy.
- Free 7-day trial available for TradingView users who join our free BitcoinNinjas community.
-Free 24/7 support via BitcoinNinjas Telegram GunBot support group with script purchase.
-Fully compatible with GunBot automatic trading software (TradingView plugin is required).
-Special discount available for traders who purchase GunBot automatic trading software and the GunBot TradingView plugin from BitcoinNinjas, allowing for fully automatic trading.
-Contact us via Email or Telegram for more information, to request additional / custom screenshots, or to start your free trial.
DISCLAIMER: By using our BitcoinNinjas ‘Ninja Signals’ planning script, you agree to the BitcoinNinjas 'Terms of Use', as presented on our website (www.BitcoinNinjas.org) and as stated here. No sharing, copying, reselling, modifying, or any other forms of use are authorized for our documents, script / strategy, and the information published with them. This informational planning script / strategy is strictly for individual use and educational purposes only. This is not financial or investment advice. Investments are always made at your own risk and are based on your personal judgement. Bitcoin Ninjas is not responsible for any losses you may incur. Please invest wisely.

BitcoinNinjas Ninja Signals Buy/Sell Alert Trading Strategy v3.0Bitcoin Ninjas 'Ninja Signals' Buy/Sell Alerts & Backtesting TradingView Script v3.0
(for Cryptocurrencies, Forex, GunBot, ProfitTrailer, automatic trading software, and more)
This is version 3 of our popular Ninja Signals trading script, which is similar to version 2, but with a new hard-coded calibration (resolution) setting that automatically matches candle size (period) to ensure that no repainting occurs regardless of the number or type of indicators and filters traders apply when configuring the script.
'Ninja Signals' v3.0 (SCRIPT)
'Ninja Signals' v3.0 (STRATEGY)
'Ninja Signals' v2.0 (SCRIPT)
'Ninja Signals' v2.0 (STRATEGY)
'Ninja Signals' v1.0 (SCRIPT)
'Ninja Signals' v1.0 (STRATEGY)
-Allows users to easily set automated buy and sell alerts on TradingView for use with automatic and manual trading of cryptocurrencies, Forex securities, and more (alerts are compatible with automatic trading software such as GunBot, ProfitTrailer, and more).
-Synthesizes many powerful indicators [e.g. Relative Strength Index (RSI), stochastic RSI, Money Flow Index (MFI), Moving Average Convergence Divergence (MACD), etc.) into one super script to generate very precise buy and sell signals in almost any market condition.
-Buy arrows (blue) and sell arrows (red) can be changed or hidden for ease of viewing.
-No lag EMA trendline featuring trend-reversal color-coding (white uptrend, black downtrend).
-Adjustable ‘calibration’ setting allows users to customize the script to work for any currency or security available through TradingView, on any exchange, simply by adjusting a number.
-Complete with backtesting strategy version of script which allows users to test various buy and sell strategies based on the alerts the script generates (see info and screenshots below).
-Backtesting strategy incorporates a user-defined adjustable date range, so users can estimate the script’s performance over specific periods of time, such as the last day, week, or month.
-Backtesting strategy utilizes a minimum protective gain setting to help you never sell for a loss. Simply adjust your minimum profit (%) per trade, and the test results will update.
-Backtesting strategy allows for pyramid buying to test various average down / double up buying strategies. Simply adjust the number of pyramid buys and the quantity of each buy.
- Free 7-day trial available for TradingView users who join our free BitcoinNinjas community.
-Free 24/7 support via BitcoinNinjas Telegram GunBot support group with script purchase.
-Fully compatible with GunBot automatic trading software (TradingView plugin is required).
-Special discount available for traders who purchase GunBot automatic trading software and the GunBot TradingView plugin from BitcoinNinjas, allowing for fully automatic trading.
-Contact us via Email or Telegram for more information, to request additional / custom screenshots, or to start your free trial.
DISCLAIMER: By using our BitcoinNinjas ‘Ninja Signals’ planning script, you agree to the BitcoinNinjas 'Terms of Use', as presented on our website (www.BitcoinNinjas.org) and as stated here. No sharing, copying, reselling, modifying, or any other forms of use are authorized for our documents, script / strategy, and the information published with them. This informational planning script / strategy is strictly for individual use and educational purposes only. This is not financial or investment advice. Investments are always made at your own risk and are based on your personal judgement. Bitcoin Ninjas is not responsible for any losses you may incur. Please invest wisely.
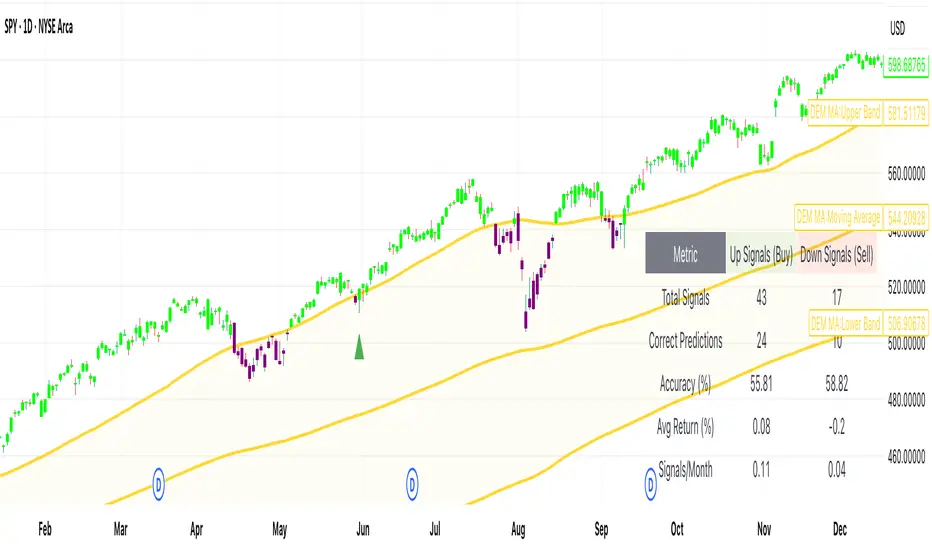
[DEM] Moving Average Signal (With Backtesting) Moving Average Signal (With Backtesting) is designed to generate buy and sell signals using a highly configurable moving average system with over 20 different moving average types (including EMA, SMA, HMA, ALMA, McGinley, TRAMA, and others) combined with dynamic upper and lower bands based on standard deviation or ATR multipliers. It also includes a comprehensive backtesting framework to evaluate the historical performance of these signals. The indicator overlays directly on the price chart, plotting the moving average with upper and lower bands while coloring bars green when price is above the upper band, red when below the lower band, and purple when between the bands. The strategy generates buy signals when price crosses above the upper band after being below it for one bar but above it for the previous three bars (indicating a breakout after brief consolidation), and sell signals under opposite conditions with the lower band, creating a momentum-based system that filters for sustained moves beyond the moving average envelope while offering extensive customization options and integrated backtesting metrics.
[DEM] Momentum Supertrend Signal (With Backtesting) Momentum Supertrend Signal (With Backtesting) is designed to generate buy and sell signals by combining SuperTrend trend analysis with consecutive price momentum patterns and timing filters to identify high-probability entry points with reduced signal frequency. It also includes a comprehensive backtesting framework to evaluate the historical performance of these signals. The indicator overlays directly on the price chart, plotting signals and displaying performance statistics in a table. The strategy generates buy signals when price shows three consecutive closes higher than the previous close while the SuperTrend indicates a bullish trend (direction = -1), with an additional requirement that at least 5 bars have passed since the last buy signal, while sell signals are triggered when price shows three consecutive lower closes during a SuperTrend bearish trend (direction = 1) with the same 5-bar spacing requirement, creating a momentum-confirmation system that filters for sustained directional movement while preventing excessive signal generation through integrated timing controls and backtesting analysis.

[DEM] Klinger Signal (With Backtesting) Klinger Signal (With Backtesting) is designed to generate buy and sell signals based on the Klinger Volume Oscillator, which combines price movement direction with volume flow to identify potential trend changes and momentum shifts. It also includes a comprehensive backtesting framework to evaluate the historical performance of these signals. The indicator overlays directly on the price chart, plotting signals and displaying performance statistics in a table. The strategy calculates signed volume (positive when HLC3 rises, negative when it falls), applies dual EMA smoothing with configurable fast and slow periods (default 34 and 55), creates a signal line using additional EMA smoothing (default 13 periods), then generates buy signals when the signal line crosses above its own EMA-smoothed version and sell signals on the opposite crossover, combining volume analysis with price momentum to identify institutional money flow changes while tracking signal accuracy, average returns, and frequency through integrated backtesting metrics.
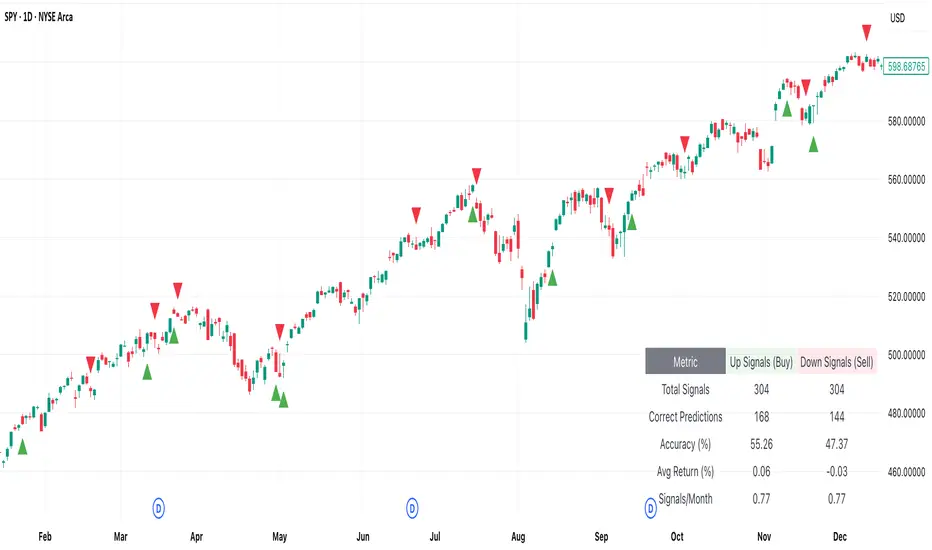
[DEM] EMA Crossover Signal (With Backtesting) EMA Crossover Signal (With Backtesting) is designed to generate buy and sell signals based on the classic exponential moving average crossover strategy using two configurable EMA periods (default 9 and 21). It also includes a comprehensive backtesting framework to evaluate the historical performance of these signals. The indicator overlays directly on the price chart, plotting signals and displaying performance statistics in a table. The strategy generates buy signals when the shorter EMA crosses above the longer EMA (indicating upward momentum shift) and sell signals when the shorter EMA crosses below the longer EMA (indicating downward momentum shift), while the integrated backtesting system tracks signal accuracy, average returns, signal frequency per month, and total correct predictions for both buy and sell signals over a configurable holding period to help traders evaluate the effectiveness of the crossover parameters.

[DEM] Confirmation Signal (With Backtesting) Confirmation Signal (With Backtesting) is designed to generate buy and sell signals by combining Aroon oscillator analysis with Parabolic SAR positioning, smoothed EMA trend confirmation, and RSI filtering to create high-confidence trading opportunities. It also includes a comprehensive backtesting framework to evaluate the historical performance of these signals. The indicator overlays directly on the price chart, plotting signals and displaying performance statistics in a table while also coloring bars based on market conditions (green for bullish confirmation, red for bearish confirmation, purple for neutral). The strategy generates buy signals when the Aroon Up reaches 100% (new highs) combined with bullish trend confirmations, proper SAR positioning, RSI filters, and adequate time spacing between signals, while sell signals are triggered under opposite conditions, emphasizing signal quality over quantity through multiple confirmation layers and integrated backtesting metrics.

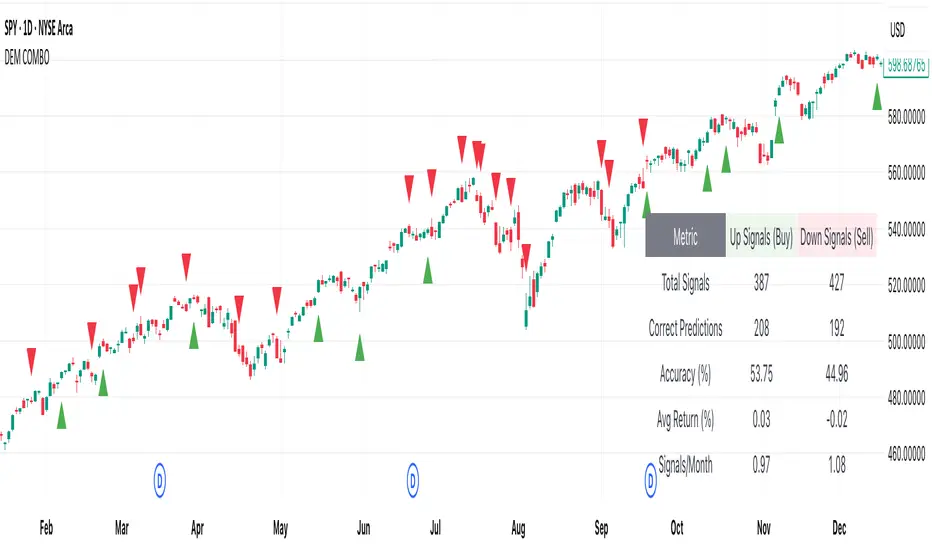
[DEM] Combo Signal (With Backtesting) Combo Signal (With Backtesting) is designed to generate buy and sell signals by combining seven different trading strategies that incorporate multiple technical indicators including SuperTrend, Parabolic SAR, MACD, and RSI. It also includes a comprehensive backtesting framework to evaluate the historical performance of these signals. The indicator overlays directly on the price chart, plotting signals and displaying performance statistics in a table. The strategy triggers buy signals when any of seven long conditions are met (including ATR-based reversal patterns, SuperTrend confirmations, RSI oversold crossovers, MACD bullish crossovers, and SuperTrend line breaks), while sell signals are generated when any of the corresponding seven short conditions occur, creating a multi-faceted approach that aims to capture various market conditions and trading opportunities while tracking signal accuracy, average returns, and signal frequency through its integrated backtesting system.
[DEM] Chande Momentum + Aroon Signal (With Backtesting) Chande Momentum + Aroon Signal (With Backtesting) is designed to generate buy and sell signals by combining the Chande Momentum Oscillator with the Aroon indicator. It also includes a comprehensive backtesting framework to evaluate the historical performance of these signals. The indicator overlays directly on the price chart, plotting signals and displaying performance statistics in a table. The strategy generates buy signals when the Aroon Up reaches 100% (indicating a new high) and the Chande Momentum Oscillator crosses above zero, while sell signals are triggered when the Aroon Down reaches 100% (indicating a new low) and the Chande Momentum Oscillator crosses below zero. The backtesting module tracks signal accuracy, average returns, signal frequency per month, and total correct predictions for both buy and sell signals across a configurable time horizon.

Uptrick: Asset Rotation SystemOverview
The Uptrick: Asset Rotation System is a high-level performance-based crypto rotation tool. It evaluates the normalized strength of selected assets and dynamically simulates capital rotation into the strongest asset while optionally sidestepping into cash when performance drops. Built to deliver an intelligent, low-noise view of where capital should move, this system is ideal for traders focused on strength-driven allocation without relying on standard technical indicators.
Purpose
The purpose of this tool is to identify outperforming assets based strictly on relative price behavior and automatically simulate how a portfolio would evolve if it consistently moved into the strongest performer. By doing so, it gives users a realistic and dynamic model for capital optimization, making it especially suitable during trending markets and major crypto cycles. Additionally, it includes an optional safety fallback mechanism into cash to preserve capital during risk-off conditions.
Originality
This system stands out due to its strict use of normalized performance as the only basis for decision-making. No RSI, no MACD, no trend oscillators. It does not rely on any traditional indicator logic. The rotation logic depends purely on how each asset is performing over a user-defined lookback period. There is a single optional moving average filter, but this is used internally for refinement, not for entry or exit logic. The system’s intelligence lies in its minimalism and precision — using normalized asset scores to continuously rotate capital with clarity and consistency.
Inputs
General
Normalization Length: Defines how many bars are used to calculate each asset’s normalized score. This score is used to compare asset performance.
Visuals: Selects between Equity Curve (show strategy growth over time) or Asset Performance (compare asset strength visually).
Detect after bar close: Ensures changes only happen after a candle closes (for safety), or allows bar-by-bar updates for quicker reactions.
Moving Average
Used internally for optional signal filtering.
MA Type: Lets you choose which moving average type to use (EMA, SMA, WMA, RMA, SMMA, TEMA, DEMA, LSMA, EWMA, SWMA).
MA Length: Sets how many bars the moving average should calculate over.
Use MA Filter: Turns the filter on or off. It doesn’t affect the signal directly — just adds a layer of control.
Backtest
Used to simulate equity tracking from a chosen starting point. All calculations begin from the selected start date. Prior data is ignored for equity tracking, allowing users to isolate specific market cycles or testing periods.
Starting Day / Month / Year: The exact day the strategy starts tracking equity.
Initial Capital $: The amount of simulated starting capital used for performance calculation.
Rotation Assets
Each asset has 3 controls:
Enable: Include or exclude this asset from the rotation engine.
Symbol: The ticker for the asset (e.g., BINANCE:BTCUSDT).
Color: The color for visualization (labels, plots, tables).
Assets supported by default:
BTC, ETH, SOL, XRP, BNB, NEAR, PEPE, ADA, BRETT, SUI
Cash Rotation
Normalization Threshold USDC: If all assets fall below this threshold, the system rotates into cash.
Symbol & Color: Sets the cash color for plots and tables.
Customization
Dynamic Label Colors: Makes labels change color to match the current asset.
Enable Asset Label: Plots asset name labels on the chart.
Asset Table Position: Choose where the key asset usage table appears.
Performance Table Position: Choose where the backtest performance table appears.
Enable Realism: Enables slippage and fee simulation for realistic equity tracking. Adjusted profit is shown in the performance table.
Equity Styling
Show Equity Curve (STYLING): Toggles an extra-thick visual equity curve.
Background Color: Adds a soft background color that matches the current asset.
Features
Dual Visualization Modes
The script offers two powerful modes for real-time visual insights:
Equity Curve Mode: Simulates the growth of a portfolio over time using dynamic asset rotation. It visually tracks capital as it moves between outperforming assets, showing compounded returns and the current allocation through both line plots and background color.
Asset Performance Mode: Displays the normalized performance of all selected assets over the chosen lookback period. This mode is ideal for comparing relative strength and seeing how different coins perform in real-time against one another, regardless of price level.
Multi-Asset Rotation Logic
You can choose up to 10 unique assets, each fully customizable by symbol and color. This allows full flexibility for different strategies — whether you're rotating across majors like BTC, ETH, and SOL, or including meme tokens and stablecoins. You decide the rotation universe. If none of the selected assets meet the strength threshold, the system automatically moves to cash as a protective fallback.
Key Asset Selection Table
This on-screen table displays how frequently each enabled asset was selected as the top performer. It updates in real time and can help traders understand which assets the system has historically favored.
Asset Name: Shortened for readability
Color Box: Visual color representing the asset
% Used: How often the asset was selected (as a percentage of strategy runtime)
This table gives clear insight into historical rotation behavior and asset dominance over time.
Performance Comparison Table
This second table shows a full backtest vs. chart comparison, broken down into key performance metrics:
Backtest Start Date
Chart Asset Return (%) – The performance of the asset you’re currently viewing
System Return (%) – The equity growth of the rotation strategy
Outperformed By – Shows how many times the system beat the chart (e.g., 2.1x)
Slippage – Estimated total slippage costs over the strategy
Fees – Estimated trading fees based on rotation activity
Total Switches – Number of times the system changed assets
Adjusted Profit (%) – Final net return after subtracting fees and slippage
Equity Curve Styling
To enhance visual clarity and aesthetics, the equity curve includes styling options:
Custom Thickness Curve: A second stylized line plots a shadow or highlight of the main equity curve for stronger visual feedback
Dynamic Background Coloring: The chart background changes color to match the currently held asset, giving instant visual context
Realism Mode
By enabling Realism, the system calculates estimated:
Trading Fees (default 0.1%)
Slippage (default 0.05%)
These costs are subtracted from the equity curve in real time, and shown in the table to produce an Adjusted Return metric — giving users a more honest and execution-aware picture of system performance.
Adaptive Labeling System
Each time the asset changes, an on-chart label updates to show:
Current Asset
Live Equity Value
These labels dynamically adjust in color and visibility depending on the asset being held and your styling preferences.
Full Customization
From visual position settings to table placements and custom asset color coding, the entire system is fully modular. You can move tables around the screen, toggle background visuals, and control whether labels are colored dynamically or uniformly.
Key Concepts
Normalized values represent how much an asset has changed relative to its past price over a fixed period, allowing performance comparisons across different assets. Outperforming refers to the asset with the highest normalized value at a given time. Cash fallback means the system moves into a stable asset like USDC when no strong performers are available. The equity curve is a running total of simulated capital over time. Slippage is the small price difference between expected and actual trade execution due to market movement.
Use Case Flexibility
You don’t need to use all 10 assets. The system works just as effectively with only 1 asset — such as rotating between CASH and SOL — for a simple, minimal strategy. This is ideal for more focused portfolios or thematic rotation systems.
How to Use the Indicator
To use the Uptrick: Asset Rotation System, start by selecting which assets to include and entering their symbols (e.g., BINANCE:BTCUSDT). Choose between Equity Curve mode to see simulated portfolio growth, or Asset Performance mode to compare asset strength. Set your lookback period, backtest start date, and optionally enable the moving average filter or realism settings for slippage and fees. The system will then automatically rotate into the strongest asset, or into cash if no asset meets the strength threshold. Use alerts to be notified when a rotation occurs.
Asset Switch Alerts
The script includes built-in alert conditions for when the system rotates into a new asset. You can enable these to be notified when the system reallocates to a different coin or to cash. Each alert message is labeled by target asset and can be used for automation or monitoring purposes.
Conclusion
The Uptrick: Asset Rotation System is a next-generation rotation engine designed to cut through noise and overcomplication. It gives users direct insight into capital strength, without relying on generic indicators. Whether used to track a broad basket or focus on just two assets, it is built for accuracy, adaptability, and transparency — all in real-time.
Disclaimer
This script is for research and educational purposes only. It is not intended as financial advice. Past performance is not a guarantee of future results. Always consult with a financial professional and evaluate risks before trading or investing.
