[Sidders] MACDEMASAR IndicatorCame across a cool idea for a strategy that couldn't find in the indicator database, so decided to code it up myself for your pleasure.
Indicators consists of 3 indicators: EMA(200) to determine the overall trend, and the MACD & Parabolic SAR to determine entries (and exits).
Long entry contains 4 conditions and is generated when price is above the 200EMA (1), the MACD crosses above the signal line (2), while they are both below 0 line (3) and when the parabolic SAR is below the closing price of the bar (4).
Short entry is build up the same but in reverse: price is below the 200EMA(1), signal line crosses below the MACD line (2), while they are both above the 0 line (3) and when the parabolic SAR is above the closing price of the bar (4).
Place the stoploss on the parabolic SAR dot below/above the candle that created the signal. Profit target 1:1 risk:reward ratio, but can ofcourse be changed according to your risk apetite. Might add automatically drawn SL/TPs in a later update.
Concept behind the strategy should work on all timeframes, but will require proper backtesting. I think with additional filters the strategy can also be way more finetuned and profitable, personally haven't had the time yet to dive into that.
Have also added alerts for your convenience.
Enjoy!
Tìm kiếm tập lệnh với "backtesting"

Logging in Pine ScriptI'm building quite a lot of pretty complicated indicators/strategies in Pine Script. Quite often they don't work from the 1 try so I have to debug them heavily.
In Pine Script there are no fancy debuggers so you have to be creative. You can plot values on your screens, check them in the data window, etc.
If you want to display some textual information, you can plot some info as labels on the screen.
It's not the most convenient way, so with the appearance of tables in Pine Script, I decided to implement a custom logger that will allow me to track some useful information about my indicator over time.
Tables work much better for this kind of thing than labels. They're attached to your screen, you can nicely scale them and you can style them much better.
The idea behind it is very simple. I used few arrays to store the message, bar number, timestamp, and type of the message (you can color messages depend on the type for example).
There is a function log_msg that just append new messages to these arrays.
In the end, for the last bar, I create the table and display the last X messages in it.
In parameters, you can show/hide the entire journal, change the number of messages displayed and choose an offset. With offset, you can basically scroll through the history of messages.
Currently, I implemented 3 types of messages, and I color messages according to these types:
Message - gray
Warning - yellow
Error - red
Of course, it's a pretty simple example, you can create a much fancier way of styling your logs.
What do you think about it? Is it useful for you? What do you use to debug code in Pine Script?
Disclaimer
Please remember that past performance may not be indicative of future results.
Due to various factors, including changing market conditions, the strategy may no longer perform as good as in historical backtesting.
This post and the script don’t provide any financial advice.

Custom Multi-Timeframe Screener with AlertsThis is a multi-timeframe screener with alerts. Use this way you can create a screener on indicators using 2 or more timeframes.
In TradingView there is a limit of 40 security function calls. Every timeframe requires another security call so you can screen fewer symbols with any additional timeframe.
In this example, I use 2 timeframes, so the maximum amount of symbols you can scan is 40/2 = 20.
For 3 timeframes - 13, 4tfs - 10, 5tfs - 8 symbols and so on.
In this simplistic example, I require a cross of EMAs on the current timeframe and confirmation that one EMA above/below another from the second timeframe.
Of course, you can create much more complicated functions for this screener.
Params
- higher timeframe
- ema params
- 20 symbol inputs for instruments you want to use in this screener
Alerts
You can create an alert from it easily by selecting the screener name from the list and then selecting "Any alert() function call".
No additional configuration is required, message and alert on close is generated in the code.
You should better change the default name for your alert. Sometimes because of big amount of inputs you might receive an error.
Disclaimer
Please remember that past performance may not be indicative of future results.
Due to various factors, including changing market conditions, the strategy may no longer perform as good as in historical backtesting.
This post and the script don’t provide any financial advice.

Multiple Screeners with AlertsI already published few version of my custom screeners. Unfortunately, because of TradingView's security function call limit you can't use more than 40 stocks in 1 screener.
Fortunately, you can compute multiple values in your function and screen few indicators at once.
In this script I show how you can compute 5 indicators at the same time for 40 instruments. I display then in different labels.
Every label consist of list of instruments satisfying current indicator conditions and a value for it. It can be absolute value as for RSI or -1/1 representing Bullish/Bearish event.
Also you can create 1 alert with result of all screeners inside.
In this example I took 5 indicators with following conditions:
RSI - "RSI < 30" or "RSI > 70"
TSI - "TSI < -30" or "RSI >30"
ADX - "ADX > 40"
MACD - "MACD Bullish Cross" or "MACD Bearish Cross" (1 and -1 in screener)
AO - "AO Crosses 0 UP" or "AO Crosses 0 DOWN" (1 and -1 in screener)
Params
- bars_apart - this parameter define how may bars apart you labels are on your chart. If you see labels overlapping, increase this number.
- Parameters for all used indicators
- 40 symbol inputs for instruments you want to use in this screener
Alerts
You can create an alert from it easily by selecting screener name from the list and then selecting "Any alert() function call".
No additional configuration is required, message and alert on close is generated in the code.
You should better change default name for your alert. Sometimes because of big amount of inputs you might receive an error.
Disclaimer
Please remember that past performance may not be indicative of future results.
Due to various factors, including changing market conditions, the strategy may no longer perform as good as in historical backtesting.
This post and the script don’t provide any financial advice.

Hurst ExponentMy first try to implement Full Hurst Exponent.
The Hurst exponent is used as a measure of long-term memory of time series. It relates to the autocorrelations of the time series and the rate at which these decrease as the lag between pairs of values increases
The Hurst exponent is referred to as the "index of dependence" or "index of long-range dependence". It quantifies the relative tendency of a time series either to regress strongly to the mean or to cluster in a direction.
In short, depending on the value you can spot the trending / reversing market.
Values 0.5 to 1 - market trending
Values 0 to 0.5 - market tend to mean revert
Hurst Exponent is computed using Rescaled range (R/S) analysis.
I split the lookback period (N) in the number of shorter samples (for ex. N/2, N/4, N/8, etc.). Then I calculate rescaled range for each sample size.
The Hurst exponent is estimated by fitting the power law. Basically finding the slope of log(samples_size) to log(RS).
You can choose lookback and sample sizes yourself. Max 8 possible at the moment, if you want to use less use 0 in inputs.
It's pretty computational intensive, so I added an input so you can limit from what date you want it to be calculated. If you hit the time limit in PineScript - limit the history you're using for calculations.
####################
Disclaimer
Please remember that past performance may not be indicative of future results.
Due to various factors, including changing market conditions, the strategy may no longer perform as good as in historical backtesting.
This post and the script don’t provide any financial advice.

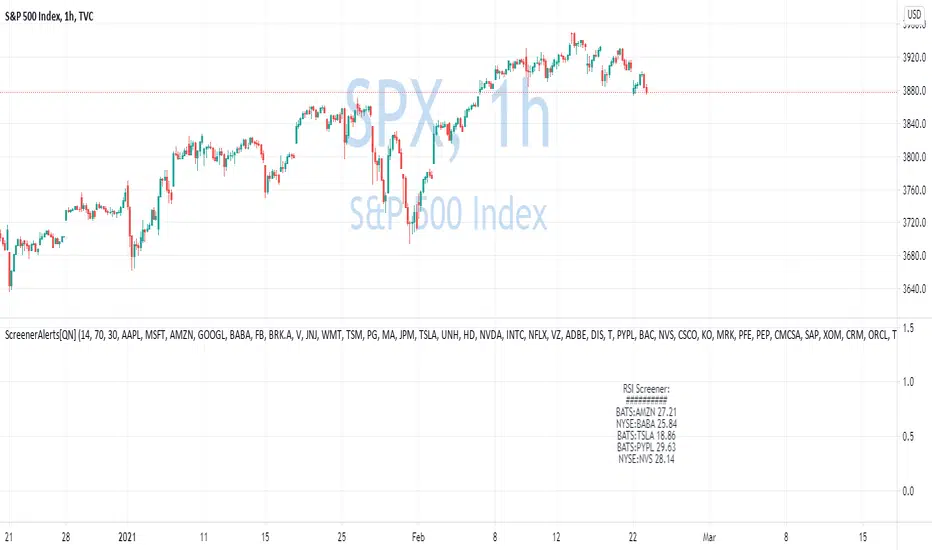
Custom Screener with Alerts V2 [QuantNomad]TradingView just recently announced the alert() function that allows you to create dynamic alerts from both strategies and studies.
So I decided to update custom screener I published before. It was based on alerts from orders in strategies, that was the only way to create dynamic alerts in PineScript at that point.
With the alert() function code become cleaner and more readable.
It works for up to 40 symbols at the same time.
You can create an alert from it easily by selecting screener name from the list and then selecting "Any alert() function call".
No additional configuration is required, message and alert on close I set up in the code.
I created as an example a screener that tracks both overbought (RSI > 70) and oversold stocks (RSI < 30).
To create your own screener you have to change only screenerFunc().
By design it should output 2 values:
cond - True/False Boolean variable. Should this instrument be displayed in the screener?
value - Additional numeric value you can display in your screener. I display RSI level for selected stocks for example.
Link to the old screener:
Disclaimer
Please remember that past performance may not be indicative of future results.
Due to various factors, including changing market conditions, the strategy may no longer perform as good as in historical backtesting.
This post and the script don’t provide any financial advice.
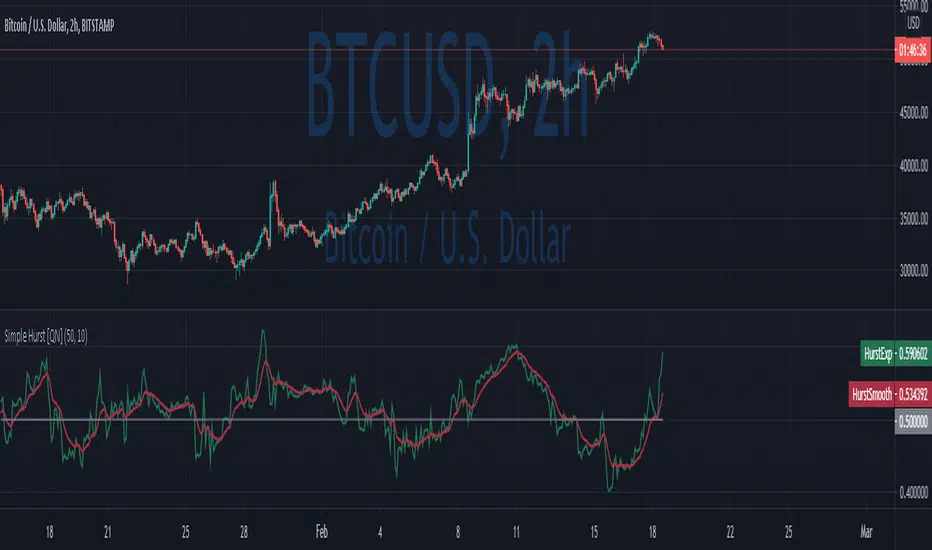
Simple Hurst Exponent [QuantNomad]This is a simplified version of the Hurst Exponent indicator.
In the meantime, I'm working on the full version. It's computationally intensive, so it's a challenge to squeeze it to PineScript limits. It will require some time to optimize it, so I decided to publish a simplified version for now.
The Hurst exponent is used as a measure of long-term memory of time series. It relates to the autocorrelations of the time series, and the rate at which these decrease as the lag between pairs of values increases
The Hurst exponent is referred to as the "index of dependence" or "index of long-range dependence". It quantifies the relative tendency of a time series either to regress strongly to the mean or to cluster in a direction.
In short depend on value you can spot trending / reversing market.
Values 0.5 to 1 - market trending
Values 0 to 0.5 - market tend to mean revert
####################
Disclaimer
Please remember that past performance may not be indicative of future results.
Due to various factors, including changing market conditions, the strategy may no longer perform as good as in historical backtesting.
This post and the script don’t provide any financial advice.
MA Divergences StrategyThis is the Strategy version of the Study I published. It is a Moving Average that can be applied to any plot to plot divergences on any oscillator, as well as perform backtesting. You'll need a REALLY good oscillator to perform live trades using this alone, but I think it is a valuable tool and had the Strategy hanging around and for some reason didn't upload it yet.
So here it is.
Turn Length to 1 to follow the oscillator without lag. Turn Length up if you are getting too many false signals or tweak the original oscillator settings.
CHOP Zone Entry Strategy + DMI/PSAR ExitThis is a Strategy with associated visual indicators and Long/Short and Reverse/Close Position Alerts for the Choppiness Index (CHOP) . It is used to determine if the market is choppy (trading sideways) or not choppy (trading within a trend in either direction). CHOP is not directional, so a DMI script was ported into this strategy to allow for trend confirmation and direction determination; it consists of an Average Directional Index (ADX) , Plus Directional Indicator (+DI) and Minus Directional Indicator (-DI) . In addition, a Parabolic SAR is also included to act as a trailing stop during any strong trends.
Development Notes
---------------------------
This indicator, and most of the descriptions below, were derived largely from the TradingView reference manual. Feedback and suggestions for improvement are more than welcome, as well are recommended Input settings and best practices for use.
www.tradingview.com
www.tradingview.com
www.tradingview.com
Recommend using the below DMI and PSAR indicators in conjunction with this script to fully visualize and understand how entry and exit conditions are chosen. Variable inputs should correlate between the scripts for uniformity and visual compatibility.
THANKS to LazyBear and his Momentum Squeeze script for helping me quickly develop a momentum state model for coloring the Chop line by trend.
Strategy Description
---------------------------
CHOP produces values that determine whether the market is choppy or trending . The closer the value is to 100 , the higher the choppiness levels , while the closer it is to 0 , the stronger the market is trending . Territories for both levels, and their associated upper and lower thresholds, are popularly defined using the Fibonacci Retracements, 61.8 and 38.2.
Basic Use
---------------------------
CHOP is often used to confirm the market condition to help you stay out of sideways markets and only enter when there is movement or imminent explosions. When readings are above the upper threshold, continued sideways movement may be expected, while readings below the lower threshold are typically indicative of a continuing trend. It is also used to anticipate upcoming trendiness changes, with the general belief that extended periods of consolidation (sideways movement) are followed by extended periods of strong, trending, directional movement, and vice versa.
One limitation in this index is that you must be cautious in deciding whether the range or trend will likely continue, or if it will reverse.
Confidence in price action and trend is higher when two or more indicators are in agreement -- while this strategy combines CHOP with both DMI and PSAR, we would still recommend pairing with other indicators to determine entry or exit trade opportunities.
Recommend also choosing 'Once Per Bar Close' when creating alerts.
Inputs
---------------------------
Strategy Direction - an option to only trade Short, Long, Both, or only in the direction of the Trend (Follow Trend is the Default).
Sensitivity - an incremental variable to test whether the past n candles are in the same trend state before triggering a delayed long or short alert (1 is the Default). Can help filter out noise and reduces active alerts.
Show Chop Index - two visual styles are provided for user preference, a visible Chop line with a background overlay, or a compact column and label only view.
Chop Lookback Period - the time period to be used in calculating CHOP (14 is the Default).
Chop Offset - changing this number will move the CHOP either forwards or backwards relative to the current market (0 is the Default).
Smooth Chop Line and Length - if enabled, the entered time period will be used in calculating a smooth average of the index (Enabled and 4 are the Defaults).
Color Line to Trend Direction - toggles whether the index line is colored to visually depict the current trend direction (Enabled is the Default).
Color Background - toggles the visibility of a background color based on the index state (Enabled is the Default).
Enable DMI Option - if enabled, then entry will be confirmed by and dependent on the ADX Key Level, with any close or reversal confirmed by both ADX and +/-DI to determine whether there is a strong trend present or not (Enabled is the Default).
ADX Smoothing - the time period to be used in calculating the ADX which has a smoothing component (14 is the Default).
DI Length - the time period to be used in calculating the DI (14 is the Default).
ADX Key Level - any trade with the ADX above the key level is a strong indicator that it is trending (23 to 25 is the suggested setting).
Enable PSAR Option - enables trailing stop loss orders (Enabled is the Default).
PSAR Start - the starting value for the Acceleration Force (0.015 is our chosen Default, 0.02 is more common).
PSAR Increment - the increment in which the Acceleration Force will move (0.001 is our chosen Default, 0.02 is more common).
PSAR Max Value - the maximum value of the Acceleration Factor (0.2 is the Default).
Color Candles Option - an option to transpose the CHOP condition levels to the main candle bars. Note that the outer red and green border will still be distinguished by whether each individual candle is bearish or bullish during the specified timeframe.
Note too that if both DMI and PSAR are deselected, then close determinations will default to a CHOP reversal strategy (e.g., close long when below 38.2 and close short when above 61.8). Though if either DMI or PSAR are enabled, then the CHOP reversal for close determination will automatically be disabled.
Indicator Visuals
---------------------------
For the candle colors, black indicates tight chop (45 to 55), yellow is loose chop (38.2 to 45 and 55 to 61.8), dark purple is trending down (< 38.2), and dark blue is trending up (> 61.8).
The background color has additional shades to differentiate a wider range of more levels…
• < 30 is dark purple
• 30 to 38.2 is purple
• 38.2 to 45 is light purple
• 45 to 55 is black
• 55 to 61.8 is light blue
• 61.8 to 70 is blue
• > 70 is dark blue
Long, Short, Close, and Reverse labels are plotted on the Chop line, which itself can be colored based on the trend. The chop line can also be hidden for a clean and compact, columnar view, which is my preferred option (see example image below).
Visual cues are intended to improve analysis and decrease interpretation time during trading, as well as to aid in understanding the purpose of this strategy and how its inclusion can benefit a comprehensive trading plan.
DMI and Trend Strength
---------------------------
To analyze trend strength, the focus should be on the ADX line and not the +DI or -DI lines. An ADX reading above 25 indicates a strong trend , while a reading below 20 indicates a weak or non-existent trend . A reading between those two values would be considered indeterminable. Though what is truly a strong trend or a weak trend depends on the financial instrument being examined; historical analysis can assist in determining appropriate values.
DMI exits trade when ADX is below the user selected key level (e.g., default is 25) and when the +/- DI lines cross (e.g., -DI > +DI exits long position and +DI > -DI exits short position).
PSAR and Trailing Stop
---------------------------
PSAR is a time and price based indicator that excels at measuring direction and duration, though not the actual strength of a trend, which is why we use this in conjunction with DMI. It is also included in this script as a trailing stop option to maximize gains during strong trends and to mitigate any false ADX strengthening signals.
This creates a parabola that is located below the candle during a Bullish trend and above during a Bearish trend. A buy or reversal is signaled when the price crosses above or below the Parabolic SAR.
Long/Short Entry
---------------------------
1. CHOP must be over 61.8 (long) or under 38.2 (short).
2. If DMI is enabled, then the ADX signal line must be above the user selected Key Level (default is 25).
3. If Sensitivity is selected, then that past candle must meet the criteria in step 1, as well as all the intermediate candles in between.
4. If "Follow Trend" is selected and PSAR is enabled, then a long position can only open when the momentum and PSAR are in an uptrend, or short when both are in a downtrend, to include all intermediate candles if the Sensitivity option is set on a past candle.
Close/Reverse
---------------------------
1. If DMI is enabled, then a close flag will be raised when the ADX signal drops below the Key Level (of 25), and -DI crosses over +DI (if long), or +DI crosses over -DI (if short).
2. If PSAR is enabled, then a close flag will be raised when the current trend state is opposite the last state.
3. If both DMI and PSAR are disabled, then a close flag will be raised if the Chop line drops under 38.2 (if long) or goes over 61.8 (if short).
4. If a Long or Short Entry is triggered on the same candle as any of the above close flags, then the position will be reversed, else the position will be closed.
Strategy Alerts
---------------------------
1. Long Entry
2. Short Entry
3. Reverse
4. Close
The provided backtest result is based on a position sizing of 10% equity with 100k initial capital. When testing SPX, disabling the DMI performed the best, but EURUSD performed poorly without it enabled, and TSLA had a small reduction in net profit. Timeframe likewise differed between commodities with TSLA performing best at 30M, SPX at 15M, and EURUSD at 4H. I do not plan on using this as a standalone strategy, but I also was expecting better results with the inclusion of EMI and PSAR to compliment the CHOP. Key elements of this script will likely be included in future, more holistic strategies.
Disclaimer
---------------------------
Past performance may not be indicative of future results. Due to various factors, including changing market conditions, the strategy may no longer perform as well as in historical backtesting. This post and the script are not intended to provide any financial advice. Trade at your own risk.
No known repainting, though there may be if an offset is introduced in the Inputs. I did my best not to code any other variables that repaint, but cannot fully attest to this fact.

[blackcat] L2 Ehlers Rocket RSI IndicatorLevel: 2
Background
John F. Ehlers introuced Rocket RSI Indicator in May, 2018.
Function
In “RocketRSI—A Solid Propellant For Your Rocket Science Trading” in May, 2018, John Ehlers introduces a new take on the classic RSI indicator originally developed by J. Welles Wilder. Ehlers begins by introducing a new version of the RSI based on a simple accumulation of up and down closes rather than averages. To this he applies a Fisher transform. He tells us that the resultant output is statistically significant spikes that indicate cyclic turning points with precision.
With this indicator, overbought and oversold conditions are clear:
## Oversold Entry Condition: Indicator crosses value (RocketRSI crosses over -2.00)
## Overbought Exit Condition: Indicator crosses value (RocketRSI crosses under 2.00)
Note the used “crosses under 2.00” for the exit condition, rather than “crosses above 2.00.” This lets the winning positions ride further, and resulted in a better overall return in backtesting.
Key Signal
RocketRSI --> Ehlers Rocket RSI Indicator fast line
Trigger --> Ehlers Rocket RSI Indicator slow line
Pros and Cons
100% John F. Ehlers definition translation, even variable names are the same. This help readers who would like to use pine to read his book.
Remarks
The 90th script for Blackcat1402 John F. Ehlers Week publication.
Readme
In real life, I am a prolific inventor. I have successfully applied for more than 60 international and regional patents in the past 12 years. But in the past two years or so, I have tried to transfer my creativity to the development of trading strategies. Tradingview is the ideal platform for me. I am selecting and contributing some of the hundreds of scripts to publish in Tradingview community. Welcome everyone to interact with me to discuss these interesting pine scripts.
The scripts posted are categorized into 5 levels according to my efforts or manhours put into these works.
Level 1 : interesting script snippets or distinctive improvement from classic indicators or strategy. Level 1 scripts can usually appear in more complex indicators as a function module or element.
Level 2 : composite indicator/strategy. By selecting or combining several independent or dependent functions or sub indicators in proper way, the composite script exhibits a resonance phenomenon which can filter out noise or fake trading signal to enhance trading confidence level.
Level 3 : comprehensive indicator/strategy. They are simple trading systems based on my strategies. They are commonly containing several or all of entry signal, close signal, stop loss, take profit, re-entry, risk management, and position sizing techniques. Even some interesting fundamental and mass psychological aspects are incorporated.
Level 4 : script snippets or functions that do not disclose source code. Interesting element that can reveal market laws and work as raw material for indicators and strategies. If you find Level 1~2 scripts are helpful, Level 4 is a private version that took me far more efforts to develop.
Level 5 : indicator/strategy that do not disclose source code. private version of Level 3 script with my accumulated script processing skills or a large number of custom functions. I had a private function library built in past two years. Level 5 scripts use many of them to achieve private trading strategy.
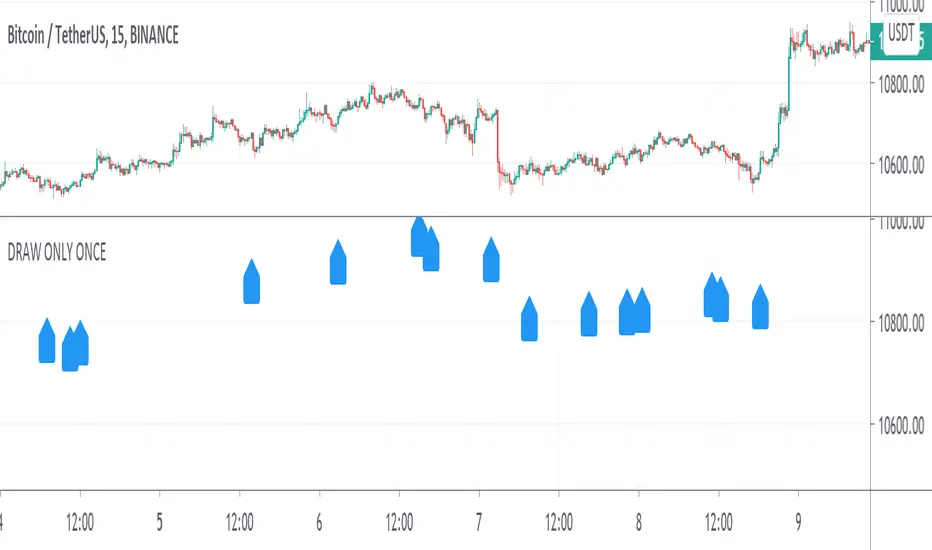
DRAW ONLY ONCE No repetitionPresent a way to solve a problem of repetitive drawing in case you want to visualize and elminate potential signal error before backtesting.
QuantNomad - Heikin-Ashi PSAR AlertsUsing this script you can create alerts for my Heikin-Ashi PSAR Strategy:
When creating alerts use "Once Per Bar Close" in parameters.
####################
Disclaimer
Please remember that past performance may not be indicative of future results.
Due to various factors, including changing market conditions, the strategy may no longer perform as good as in historical backtesting.
This post and the script don’t provide any financial advice.
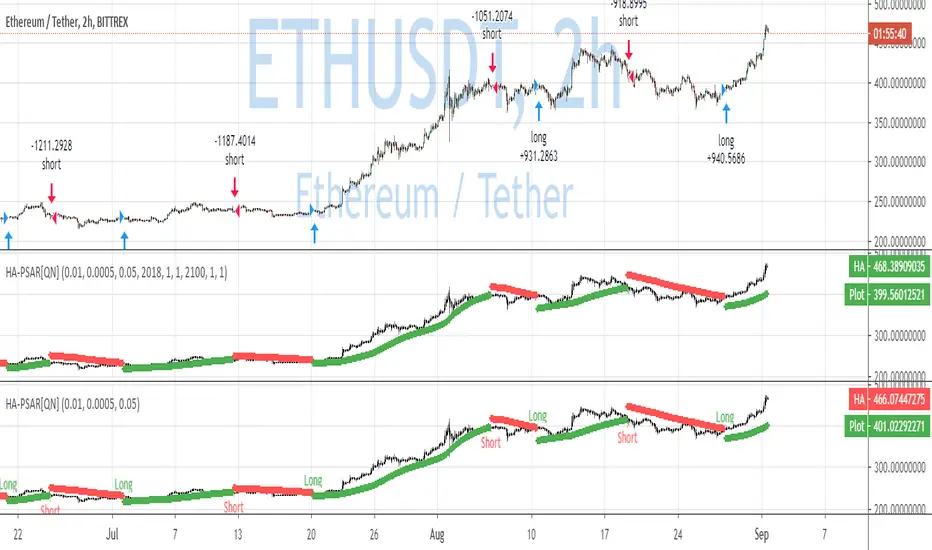
QuantNomad - Heikin-Ashi PSAR StrategyContinue experimenting with different combinations of strategies.
Here is the PSAR Strategy calculated based on HA candles. HA is already calculated inside the script, do not apply it to HA candles.
Strategy is calculated based on 25% equity invested with 0.1% commission.
####################
Disclaimer
Please remember that past performance may not be indicative of future results.
Due to various factors, including changing market conditions, the strategy may no longer perform as good as in historical backtesting.
This post and the script don’t provide any financial advice.

Breakout Trend FollowerThis is a Study mirroring the Breakout Trend Follower Strategy I made. I use this one during live trading and the other for backtesting. It will also give alerts when buy and sell signals are hit.

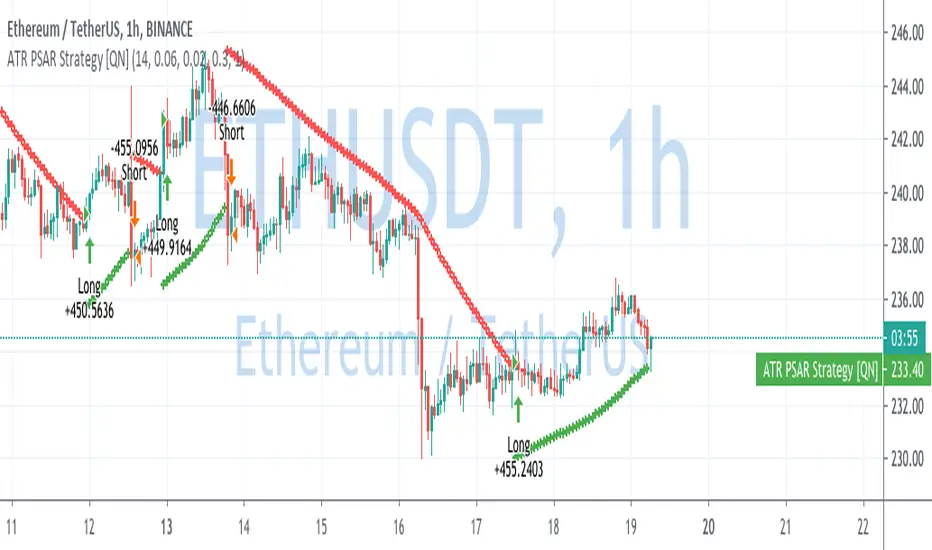
ATR Parabolic SAR Strategy [QuantNomad]I created a version of Parabolic SAR when I accelerate it not based on the difference from the extreme point but based on current ATR. So the idea is that for a more volatile market it should move faster.
Performance is calculated based on 25% equity invested and 0.1% commission.
What do you think about it? Does it make sense to do something like that?
Do you have in mind other ways I can accelerate it when the market starts to be more volatile?
Disclaimer
Please remember that past performance may not be indicative of future results.
Due to various factors, including changing market conditions, the strategy may no longer perform as good as in historical backtesting.
This post and the script don’t provide any financial advice.
Custom Screener with Alerts [QuantNomad]Some time ago I published an example of simple custom screener in PineScript:
The only thing this screener did is created a dynamic label with screener output.
Recently TradingView announced alerts from the strategy with the possibility to add custom messages to alerts.
So using it I was able to create a bit more advanced screener which sends results as alert messages. With tools like Alertatron, you can easily redirect them to Telegram if you want.
It works for 40 symbols (limitation of the number of security calls).
To create your own screener you need to change only screenerFunc. The logic of this function is very simple, it outputs value you want to display in screener and condition based on which your screener should filter your stocks.
To create alerts for this screener create an alert from strategy and use {{strategy.order.alert_message}} as alert message.
Do you know now how to make this screener better? Let me know.
Disclaimer
Please remember that past performance may not be indicative of future results.
Due to various factors, including changing market conditions, the strategy may no longer perform as good as in historical backtesting.
This post and the script don’t provide any financial advice.

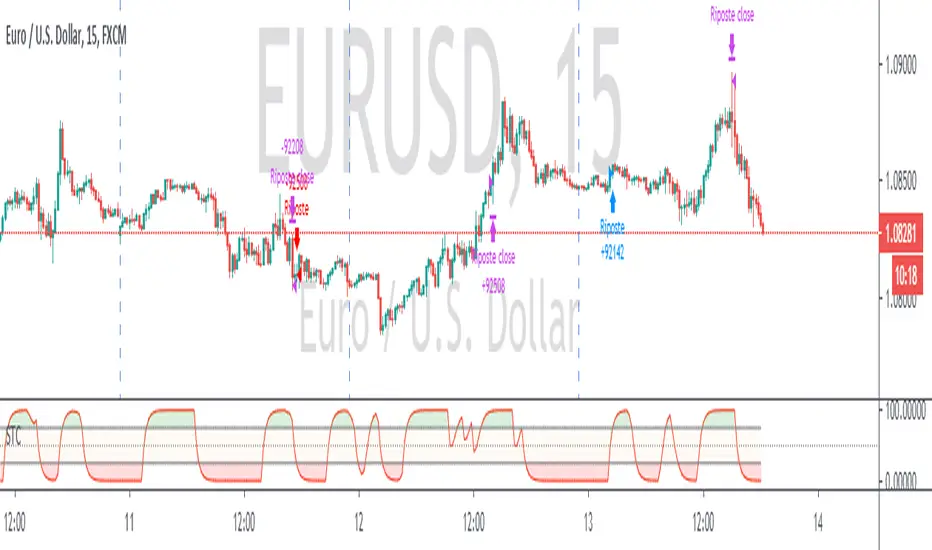
Schaff Trend Cycle + Double MAThis strategy uses two different moving averages to determine a trend. It opens a position on a pullback from a trend.
Conditions for buy signal are:
►Crossover out of Shaff Trend Cycle's extreme levels
►The price is above its short period exponential moving average.
►A short period exponential moving average is above a long period exponential moving average.
*Conditions for sell are the opposite.
All in all, I don't think it needs to be on your chart but it can be optimized and even successful on some timeframes.
Shaff Trend Cycle solution was provided by @everget, I converted his script to Pine v.4, added exponential averages and created an algorithm for backtesting.
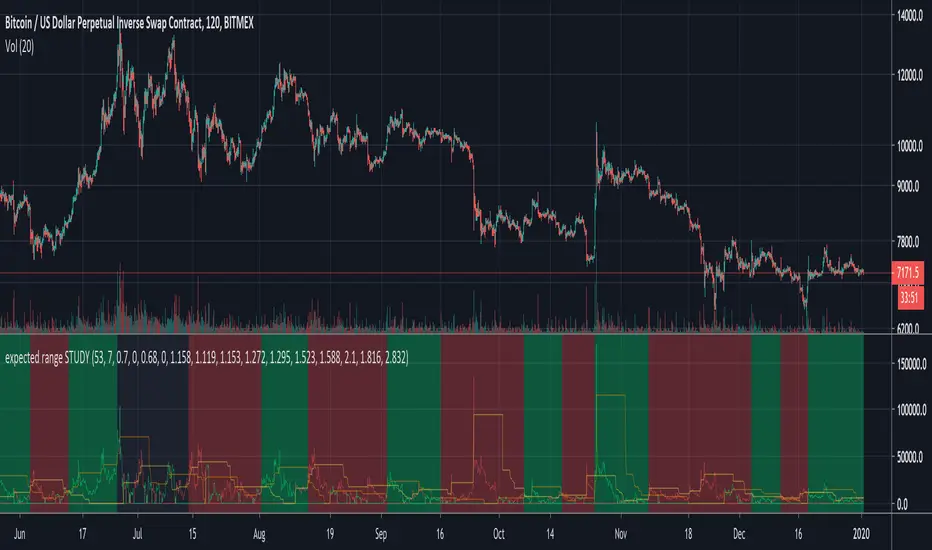
expected range STRATEGYThis is the strategy version of "expected range STUDY". The buy and sell signals are generated with the study version, but what is displayed on the chart is different. Here, the PnL of each trade is shown on the chart, as well as the peak profit point of each trade up till the present. Black areas represent take profit and waiting for the next trade to start. Green = long. Red = short. Set to take profit at 53% and stoploss is set to -7%. Having a stoploss trigger does not put a black area on the chart. For the XBTUSD 2 hour chart, but use it however you like on whatever chart for backtesting.
Enjoy. Don't get rekt. A good backtest doesn't mean a good forward test. Use at your own risk.

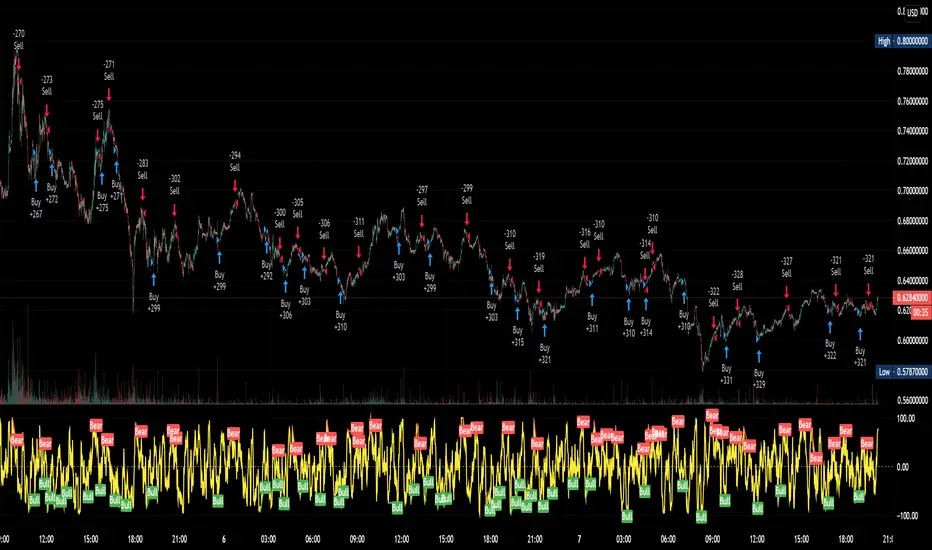
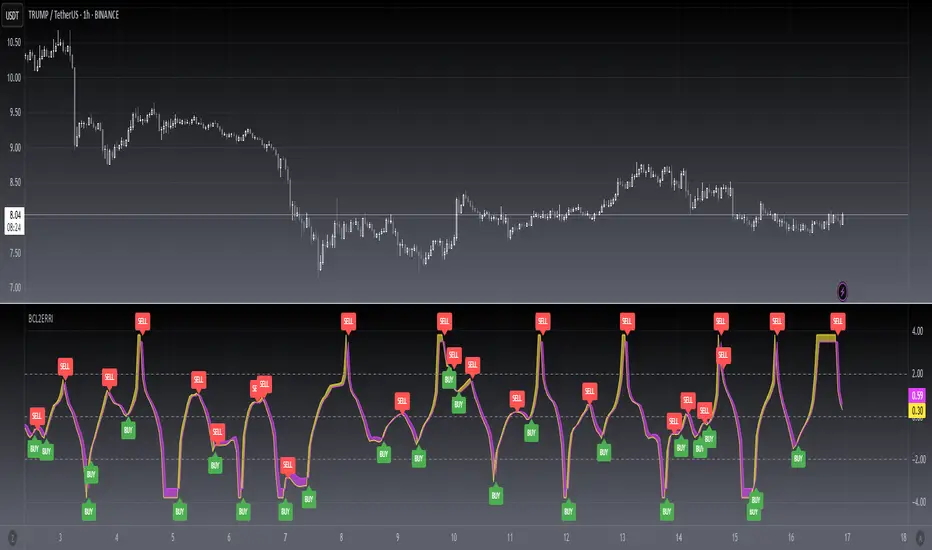
expected range STUDYThis is an indicator that measures how much price movement (low to high) we've seen in a set of 1 bar back, 2 bars back, 3 bars back, 5 bars back, 8 bars back using the Fibonacci sequence up to 89 bars back, and then measures how low or high within each range we are, sort of like giving a rating of 0 for sitting on the lower Bollinger Band and a rating of 100 for sitting on the higher Bollinger band. It combines all the data and weights the data by the historical strength of signal from each length of bands. It's been tuned to a 2 hour XBTUSD chart, but it could be used on other things and other timeframes too. Some tweaking would be needed, though. The final result works more like a trend following indictor than and indicator that tries to pick an exact trend reversal point. However, you're free to use it how you want. Frequently you get a nice red or green spike up showing you when the bottom or top is in, but sometimes those spikes are just the start of an extended down move or up move.
On the chart, a buy (long) signal is generated when the green line crosses up above the orange line. To make it extra clear the background is green when you should be long. A sell (short) signal is generated with the red line crosses up above the yellow line. The background will be red when you should be short. If the background is black, it's indicating a profit of over 53% was taken and it's waiting for another trade to start. Up to you to take profit or keep riding your trade.
For XBTUSD trades, a full take profit on any trade exceeding 53% gains works nice (on 1x leverage) and a stoploss of -7% works quite nicely too. One could use this on up to 2x leverage but I wouldn't recommend going much higher. Have fun. Trade carefully. Don't get rekt.
I will release the "expected range STRATEGY" to go along with this so you can do your own backtesting.
Disclaimer: I haven't tested the alerts, but they should work. Use at your own risk.
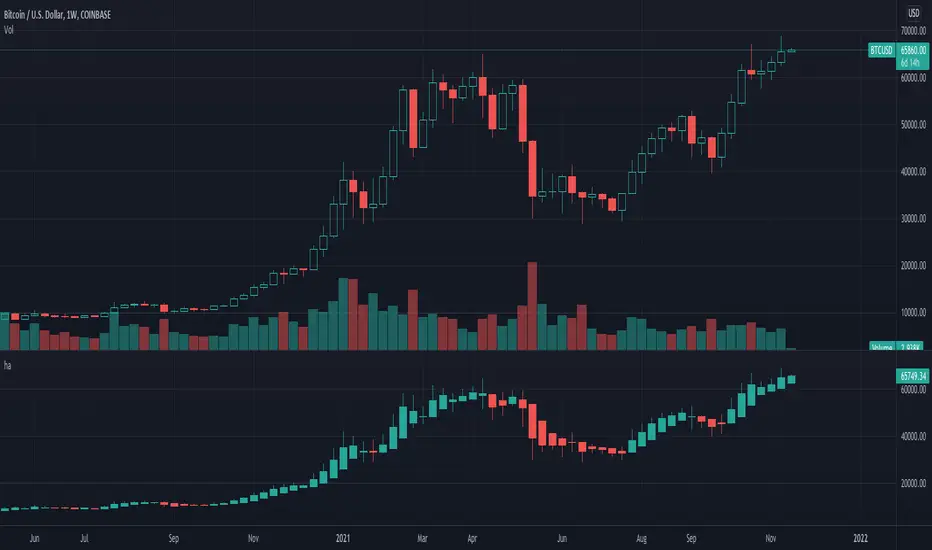
Heiken-Ashi CandlesSimple script to view Heiken-Ashi candles below a normal candles chart.
Could also be useful for using HA calcs in strategy scripts on normal candles chart for proper backtesting.
I adapted this to v4 from original v2 script by @samtsui. If you like please remember to give him a Thumbs Up for his original version! ->
Golden Cross by -Westy-Quick Guide
- Yellow cross and green MA on top = Potential uptrend
- Yellow cross and red MA on top = Potential downtrend
A simple golden cross indicator of the green 50 and red 200 SMA with a yellow cross for ease of visibility and backtesting.
Generally, longer time frames more powerful signals but are less frequent. I typically use it on the 4 hour, daily and weekly.

Complete turtles strategy based on the donchian channelsDear Traders and investor,
I want to demonstrate scrypt of the iconic "trend following strategy" coded by my
The main idea was borrowed from the book "Way of the Turtle: The Secret Methods that Turned Ordinary People into Legendary". The strategy is based on the donchian channels and is one of the oldest and easiest strategy in the using. Also strategy include risk managment and trends filter which prevent false entries and high drawndowns. The results are based on the period from 2006 to present, but you can also change timeframe and period of backtesting.
Best regards,
Vlad

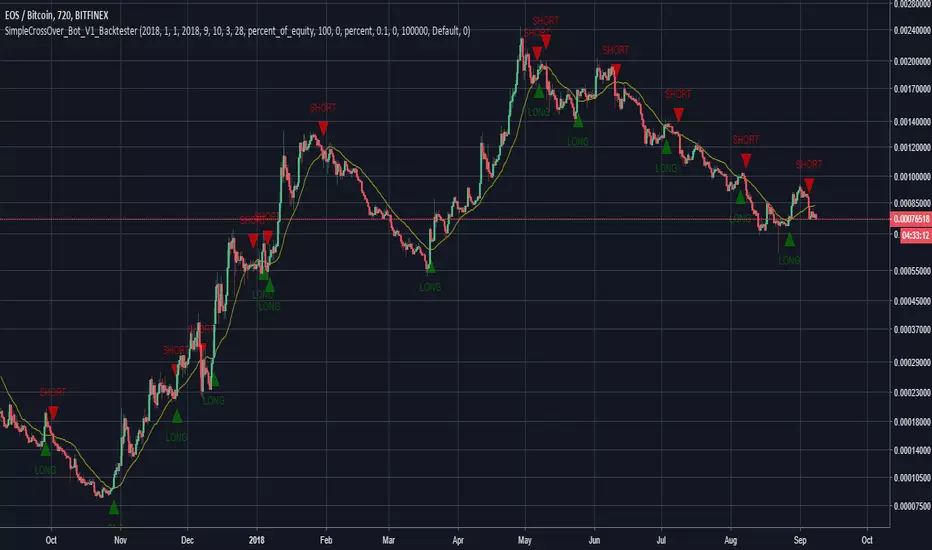
SimpleCrossOver_BotThis is a simple example of how you can compile your own strategy
This script contains the code for alerts and for backtesting.
In order to use the backtester, comment out the sections to be used for signals, and comment in the sections to be used on the back tester, and visa versa for using the script for alerts in order to automate your own bot.