Price Action [BreakOut] InternalKey Features and Functionality
Support & Resistance (S/R): The script automatically identifies and draws support and resistance lines based on a user-defined "swing period." These lines are drawn from recent pivot points, and users can customize their appearance, including color, line style (solid, dashed, dotted), and extension (left, right, or both). The indicator can also display the exact price of each S/R level.
Trendlines: It draws trendlines connecting pivot highs and pivot lows. This feature helps visualize the current trend direction. Users can choose to show only the newest trendlines, customize their length and style, and select the source for the pivot points (e.g., candle close or high/low shadow).
Price Action Pivots: This is a core component that identifies and labels different types of pivots based on price action: Higher Highs (HH), Lower Highs (LH), Higher Lows (HL), and Lower Lows (LL). These pivots are crucial for understanding market structure and identifying potential trend changes. The script marks these pivots with shapes and can display their price values.
Fractal Breakouts: The script identifies and signals "fractal breakouts" and "breakdowns" when the price closes above a recent high pivot or below a recent low pivot, respectively. These signals are visually represented with up (⬆) and down (⬇) arrow symbols on the chart.
Customization and Alerts: The indicator is highly customizable. You can toggle on/off various features (S/R, trendlines, pivots, etc.), adjust colors, line styles, and text sizes. It also includes an extensive list of alert conditions, allowing traders to receive notifications for:
Price Crossovers: When the close price crosses over or under a support or resistance level.
Trendline Breaks: When the price breaks above an upper trendline or below a lower trendline.
Fractal Breaks: When a fractal breakout or breakdown occurs.
Tìm kiếm tập lệnh với "breakout"

GrayZone Sniper [CHE] — Breakout Validation System GrayZone Sniper — Breakout Validation System
Trade only the clean breakouts. Detect the sideways “gray zone,” wait for a confirmed breach, and act only when momentum (TFRSI) and range expansion (Mean Deviation) align. Clear long/short triggers, one-shot exit signals, and persistent levels keep your manual trading disciplined and repeatable.
Why it boosts manual trading
* No guesswork: Grey box marks consolidation; you trade the validated break.
* Fewer fakeouts: Triggers require momentum + volatility—not just a wick through a level.
* Rules > bias: Optional close-only signals stop intrabar noise.
* Built-in exits: One-shot LS/SS (Long/Short Stop) when conditions degrade.
* Actionable visuals: Gray-zone boxes, persistent highs/lows, and a smooth T3 trendline.
What it does (short + precise)
1. Maps consolidation as a gray box (running high/low while state is neutral).
2. Validates breakouts only when:
* Mean Deviation filter says current range expands vs. its own baseline, and
* TFRSI momentum is above 50 + deadzone (long) or below 50 − deadzone (short), and
* Price closes beyond the last gray high/low (optional close-only).
→ You get L (long) or S (short).
3. Manages exits with a smooth T3 trendline plus MD trend: when MD weakens and T3 turns against the prior side, you get a single LS/SS stop signal.
4. Extends structure: Last gray-zone H/L can persist as right-extended levels for retests/targets.
5. Ready for alerts: Prebuilt alert conditions for L, S, LS, SS.
Signals at a glance
* L – Long Trigger (validated breakout up)
* S – Short Trigger (validated breakout down)
* LS – Long Stop (exit hint for open long)
* SS – Short Stop (exit hint for open short)
Why TFRSI + Mean Deviation is a killer combo
They measure different, complementary things—and that reduces correlated errors.
* Mean Deviation (MD) = range expansion filter. It checks whether current absolute deviation of Typical Price from its SMA (|TP − SMA(TP)|) is greater than its own historical mean deviation baseline. In plain English: *is the market actually moving beyond its usual wiggle?* If not, most breakouts are noise.
* TFRSI = directional momentum around a 50 baseline, normalized and smoothed to react fast while avoiding raw RSI twitchiness.
* Synergy:
* MD confirms there’s energy (volatility regime has expanded).
* TFRSI confirms where that energy points (bull or bear).
* Requiring both gives you high-quality, directional expansion—the exact condition that tends to produce follow-through, while filtering the classic “thin break, immediate snap-back.”
Result: Fewer trades, better quality. You skip most range breaks without momentum or momentum pops without real expansion.
Inputs & Functions (clean overview)
Core: TFRSI & MD
* TFRSI Length (`tfrsiLen`, default 6): Longer = smoother, slower.
* TFRSI Smoothing (`tfrsiSignalLen`, default 2): SMA on TFRSI for cleaner signals.
* Mean Deviation Period (`mdLen`, default 20): Baseline for expansion filter.
* Use classical MD (`useTaDev`, default off):
* Off: MD vs current SMA (warning-free internal baseline).
* On: Classical `ta.dev` implementation.
* TFRSI Deadzone ± around 50 (`tfrsiDeadzone`, default 1.0): Wider deadzone = stricter momentum confirmation (less chop).
Triggers & Logic
* Trigger only on bar close (`fireOnCloseOnly`, default on): Confirmed signals only; no intrabar flicker.
* Reset gray bounds after trigger (`resetGrayBoundsAfterTrigger`, default on): Clears last gray H/L once a trade triggers.
* Auto-deactivate on neutral (`autoDeactivateOnNeutral`, default off): Strict disarm when state flips back to neutral.
Gray-Zone Boxes
* Show boxes (`showGrayBoxes`, default on): Draws the neutral consolidation box.
* Max boxes (`maxGrayBoxes`, default 10): How many historic boxes to keep.
* Transparency (`boxFillTransp`/`boxBorderTransp`, defaults 85/30): Visual tuning.
Trendline (T3)
* T3 Length (`t3Length`, default 3): Smoothing depth (higher = smoother).
* T3 Volume Factor (`t3VolumeFactor`, default 0.7): Controls responsiveness of the T3 curve.
Persistent Levels
* Persist gray H/L (`saveGrayLevels`, default on): Extend last gray high/low to the right.
* Max saved level pairs (`maxSavedGrayLvls`, default 1): How many H/L pairs to keep.
* Reset levels on trigger (`resetLevelsOnTrig`, default off): Clean slate after new trigger.
Debug & Visuals
* Show debug markers (`showDebugMarkers`, default on): Display L/S/LS/SS in the pane.
* Show legend (`showLegend`, default on): Compact legend (top-right).
How to trade it (practical)
1. Keep close-only on. Let the market finish the candle.
2. Wait for a clean gray box. Let the range define itself.
3. Take only L/S triggers where MD filter passes and TFRSI confirms.
4. Use persistent levels for retests/partials/targets.
5. Respect LS/SS. When expansion fades and T3 turns, exit without debate.
Tuning tips:
* More chop? Increase `tfrsiDeadzone` or `mdLen`.
* Want faster entries? Slightly reduce `t3Length` or deadzone, but expect more noise.
* Works across assets/timeframes (crypto/FX/indices/equities).
Bottom line
GrayZone Sniper enforces a simple, robust rule: Don’t touch the market until it breaks a defined range with real expansion and aligned momentum. That’s why TFRSI + Mean Deviation is hard to beat—and why your manual breakout trades get cleaner, calmer, and more consistent.
Disclaimer:
The content provided, including all code and materials, is strictly for educational and informational purposes only. It is not intended as, and should not be interpreted as, financial advice, a recommendation to buy or sell any financial instrument, or an offer of any financial product or service. All strategies, tools, and examples discussed are provided for illustrative purposes to demonstrate coding techniques and the functionality of Pine Script within a trading context.
Any results from strategies or tools provided are hypothetical, and past performance is not indicative of future results. Trading and investing involve high risk, including the potential loss of principal, and may not be suitable for all individuals. Before making any trading decisions, please consult with a qualified financial professional to understand the risks involved.
By using this script, you acknowledge and agree that any trading decisions are made solely at your discretion and risk.
Enhance your trading precision and confidence with Triple Power Stop (CHE)! 🚀
Happy trading
Chervolino
SONIC R BREAK FINAL (VER5)
Purpose: Capture breakouts through Support/Resistance (S/R) zones based on Pivot and filter signals using EMA 34 (High/Low/Close), EMA 89, volume, and candle structure. Includes a Higher Timeframe (H4) RSI risk warning (visual only, does not block entries).
How it works
S/R zones from Pivot
Draws Resistance and Support using ta.pivothigh/ta.pivotlow with Left/Right Bars.
S/R lines are locked with offset to reduce repaint.
EMA trend filters
EMA34 High/Low/Close build a “EMA 34 band”.
EMA89 works as the main trend filter.
Trend conditions:
Long: close above all EMA34 High/Low/Close and EMA89.
Short: close below all EMA34 High/Low/Close and EMA89.
Volume filter (optional)
Signal valid only if Volume > SMA(Volume, n).
Wick filter
Each wick (upper/lower) ≤ 50% of candle range to avoid weak breakouts.
Higher TF RSI risk (H4)
Fetches RSI from a higher timeframe (default H4).
If RSI exceeds threshold, breakout labels turn gray (risk warning only).
Anti-repeat mechanism
Each new pivot resets trigger.
Each S/R level triggers only once until the next pivot is formed.
Signals & Alerts
Label “B” (green) below candle: breakout above Resistance, valid EMA/Volume/Wick conditions.
Label “S” (red) above candle: breakout below Support, valid EMA/Volume/Wick conditions.
Gray labels = H4 RSI risk warning.
Unified alert: “S/R Breakout (Unified)” with message B=Buy, S=Sell, Gray=Risk.
Parameters
Show Breaks: toggle breakout detection.
Left/Right Bars: pivot sensitivity.
Require Volume > Average + Volume MA Length: volume filter.
Use H4 RSI Risk Warning: enable higher TF RSI check.
RSI Length, Higher TF (minutes), RSI thresholds for Buy/Sell risk.
Usage tips
Prioritize trades in the same direction as EMA89 and EMA34 trend.
Works on M5 to H4; best combined with RSI H4 when trading M15/M30.
Place SL behind the S/R just broken, TP by fixed RR or EMA trailing.
Increase Left/Right Bars for stronger zones and less noise in sideways markets.
Notes
Pivot still has repaint element (mitigated by offset).
This indicator is not financial advice. Always combine with proper risk management.
Version
Clean v4: added wick ≤50% filter, H4 RSI risk coloring, volume filter, anti-repeat pivot trigger, unified alert, EMA34 H/L/C background shading.
Opening-Range BreakoutNote: Default trading date range looks mediocre. Set date range to "Entire History" to see full effect of the strategy. 50.91% profitable trades, 1.178 profit factor, steady profits and limited drawdown. Total P&L: $154,141.18, Max Drawdown: $18,624.36. High R^2
█ Overview
The Opening-Range Breakout strategy is a mechanical, session‑based day‑trading system designed to capture the initial burst of directional momentum immediately following the market open. It defines a user‑configurable “opening range” window, measures its high and low boundaries, then places breakout stop orders at those levels once the range closes. Built‑in filters on minimum range width, reward‑to‑risk ratios, and optional reversal logic help refine entries and manage risk dynamically.
█ How It Works
Opening‑Range Formation
Between 9:30–10:15 AM ET (configurable), the script tracks the highest high and lowest low to form the day’s opening range box.
On the first bar after the range window closes, the range high (OR_high) and low (OR_low) are “locked in.”
Range‑Width Filter
To avoid false breakouts in low‑volatility mornings, the range must be at least X% of the current price (default 0.35%).
If the measured opening-range width < minimum threshold, no orders are placed that day.
Entry & Order Placement
Long: a stop‑buy order at the opening‑range high.
Short: a stop‑sell order at the opening‑range low.
Only one side can trigger (or both if reverse logic is enabled after a losing trade).
Risk Management
Once triggered, each trade uses an ATR‑style stop-loss defined as a percentage retracement of the range (default 50% of range width).
Profit target is set at a configurable Reward/Risk Ratio (default 1.1×).
Optional: Reverse on Stop‑Loss – if the initial breakout loses, immediately reverse into the opposite side on the same day.
Session Exit
Any open positions are closed at the end of the regular trading day (default 3:45 PM ET window end, with hard flat at session close).
Visual cues are provided via green (range high) and red (range low) step‑line plots directly on the chart, allowing you to see the range box and breakout triggers in real time.
█ Why It Works
Early Momentum Capture: The first 15 – 60 minutes of trading encapsulate overnight news digestion and institutional order flow, creating a well‑defined volatility “range.”
Mechanical Discipline: Clear, rule‑based entries and exits remove emotional guesswork, ensuring consistency.
Volatility Filtering: By requiring a minimum range width, the system avoids choppy, low‑range days where false breakouts are common.
Dynamic Sizing: Stops and targets scale with the opening range, adapting automatically to each day’s volatility environment.
█ How to Use
Set Your Instruments & Timeframe
-Apply to any futures contract on a 1‑ to 5‑minute chart.
-Ensure chart timezone is set to America/New_York.
Configure Inputs
-Opening‑Range Window: e.g. “0930-1015” for a 45‑minute range.
-Min. OR Width (%): e.g. 0.35 for 0.35% of current price.
-Reward/Risk Ratio: e.g. 1.1 for a modest profit target above your stop.
-Max OR Retracement %: e.g. 50 to set stop at 50% of range width.
-One Trade Per Day: toggle to limit to a single breakout.
-Reverse on Stop Loss: toggle to flip direction after a losing breakout.
Monitor the Chart
-Watch the green and red range boundaries form during the session open.
-Orders will automatically submit on the first bar after the range window closes, conditioned on your filters.
Review & Adjust
-Backtest across multiple months to validate performance on your preferred contract.
-Tweak range duration, minimum width, and R/R multiple to fit your risk tolerance and desired win‑rate vs. expectancy balance.
█ Settings Reference
Input Defaults
Opening‑Range Window - Time window to form OR (HHMM-HHMM) - 0930–1015
Regular Trading Day - Full session for EOD flat (HHMM-HHMM) - 0930–1545
Min. OR Width (%) - Minimum OR size as % of close to trigger orders - 0.35
Reward/Risk Ratio - Profit target multiple of stop‑loss distance - 1.1
Max OR Retracement (%) - % of OR width to use as stop‑loss distance - 50
One Trade Per Day - Limit to a single breakout order per day - false
Reverse on Stop Loss - Reverse direction immediately after a losing trade - true
Disclaimer
This strategy description and any accompanying code are provided for educational purposes only and do not constitute financial advice or a solicitation to trade. Futures trading involves substantial risk, including possible loss of capital. Past performance is not indicative of future results. Traders should assess their own risk tolerance and conduct thorough backtesting and forward-testing before committing real capital.

OBR 15min Session Opening Range Breakout + Volume Trend DeltaQuick Overview
This Pine Script plots the opening range for London and New York sessions, highlights breakout levels, draws previous session pivots, and offers a live volume delta table for trend confirmation.
Session Opening Range
- Captures the high/low of the first 15 minutes (configurable) for both London & NY sessions.
- Fills the range area with adjustable semi‑transparent colors.
- Optional alerts fire on breakout above the high or below the low.
Previous Session Levels
- Automatically draws previous day’s High, Low, Open and previous 4‑hour High/Low.
- Helps identify key S/R zones as price approaches ORB breakouts.
Volume Trend Delta
- Uses a CMO‑weighted moving average and ATR bands to detect trend state.
- Accumulates bullish vs. bearish volume during each trend.
- Displays Bull Vol, Bear Vol, and Delta % in a movable table for quick strength checks.
How to Use
1. Let the opening range complete (first 15 min).
2. Look for price closing above/below the ORB—enter long on an upside break, short on a downside break.
3. Check the Volume Delta table: positive delta confirms buying strength; negative delta confirms selling pressure.
4. Use previous day/4h levels as additional support/resistance filters.
Settings & Customization
- ORB Duration & Session Times (London/NY), fill colors, and toggles.
- Enable/disable Previous Day & 4H levels.
- Trend Period, Momentum Window, and Delta table position/size.
- Pre‑built alert conditions for all ORB breakouts.
Developer Notes
- Fully commented for easy adjustments.
- Modular sections: ORB, previous levels, trend delta, and alerts.
- No external libraries—pure Pine Script v6.
Tip
Combine ORB breakouts with Volume Delta and prior session pivots to filter false signals and trade stronger, more reliable moves.

Bollinger Band Breakout With Volatility StoplossDetailed Explanation of the Bollinger Band Breakout With Volatility Stoploss System
Introduction
The "Bollinger Band Breakout With Volatility Stoploss" system is a trading strategy designed to exploit price volatility in financial markets using the Bollinger Bands indicator, a widely recognized tool developed by John Bollinger. This system adapts the traditional Bollinger Bands framework into a Volatility Breakout strategy, focusing on capturing significant price movements by leveraging customized parameters and precise trading rules. The system operates exclusively on long positions, employs a daily timeframe, and incorporates dynamic risk management techniques to optimize trade outcomes while preserving capital.
System Parameters
The system modifies the standard Bollinger Bands configuration to suit its breakout methodology:
Standard Deviation (SD): Set to 1x, determining the width of the bands relative to the central moving average. This tighter setting enhances sensitivity to price movements, making the system responsive to smaller volatility shifts compared to the conventional 2x SD.
Period: A 30-day (1-month) lookback period is used to calculate the bands, providing a balance between capturing medium-term price trends and avoiding excessive noise from shorter timeframes.
Moving Average Type: The system uses an Exponential Moving Average (EMA) instead of the Simple Moving Average (SMA). The EMA places greater weight on recent price data, making it more responsive to current market conditions and better suited for detecting breakout opportunities in dynamic markets.
Core Concept
The Bollinger Band Breakout system is built on the principle of Volatility Breakout, which seeks to capitalize on significant price movements when the price breaks out of a defined volatility range. The Bollinger Bands, consisting of an EMA as the central line and two bands (Upper and Lower) calculated as the EMA plus or minus 1x SD, define this range. The system operates on a Daily Chart (D) timeframe, making it suitable for traders who prefer analyzing and executing trades based on daily price action. By focusing solely on Long Positions (buying low and selling high), the system avoids short-selling, aligning with strategies that capitalize on upward price momentum.
The core idea is to use the 1x SD multiplier over a 30-day period to establish a dynamic price range that reflects recent market volatility. Breakouts above the Upper Band signal potential buying opportunities, while penetrations below the Lower Band indicate exits, ensuring trades are aligned with significant price movements.
Trading Signals
The system generates clear entry and exit signals based on price interactions with the Bollinger Bands:
Buy Signal: A buy signal is triggered when the closing price of a daily candle exceeds the Upper Bollinger Band (EMA + 1x SD over 30 days). The trade is entered at the opening price of the subsequent candle, ensuring the breakout is confirmed by the close of the prior day. This approach minimizes false signals by waiting for a definitive breach of the volatility threshold.
Sell Signal: A sell signal occurs when the closing price falls below the Lower Bollinger Band (EMA - 1x SD over 30 days). The position is exited at the opening price of the next candle, allowing the trader to lock in profits or limit losses when the price reverses or loses momentum.
Risk Management
Risk management is a cornerstone of the system, ensuring capital preservation and disciplined trade execution:
Initial Stoploss: The stoploss is set at the Lower Bollinger Band of the candle that triggered the buy signal. This level acts as a volatility-based threshold, below which the trade is deemed invalid, prompting an immediate exit to protect capital. Traders have two options for implementing the stoploss:
Pending Stoploss: A predefined stoploss order placed at the Lower Band level.
Conditional Exit: Using the sell signal condition (price closing below the Lower Band) as the exit trigger, effectively aligning the stoploss with the system’s exit rules.
Position Sizing: The system employs Fixed Fractional Position Sizing with a risk per trade capped at 3% of the account balance. The position size is calculated based on the distance between the entry price and the Initial Stoploss, incorporating Volatility Position Sizing. This method adjusts the trade size according to the market’s volatility, ensuring that risk remains consistent across varying market conditions. Two options are available for managing capital:
Gear Up Option: Profits from previous trades are reinvested into the account’s capital, increasing the base for calculating the next position size. This compounding approach can amplify returns but also increases risk exposure.
Fixed Equity Option: Profits from previous trades are withdrawn, and only the remaining capital is used for calculating the next position size. This conservative approach prioritizes capital preservation by not compounding gains.
Trailing Stop: The system uses the Lower Bollinger Band as a dynamic trailing stop, which adjusts with price movements and volatility. This ensures that profits are protected during favorable trends while allowing the trade to remain open as long as the price stays above the Lower Band. The trailing stop aligns with the sell signal condition, maintaining consistency in the system’s exit strategy.
Supporting Indicators
The system incorporates two additional indicators to enhance market analysis and decision-making:
Bollinger Band Width (BBW): BBW measures the distance between the Upper and Lower Bollinger Bands relative to the EMA, serving as a proxy for market volatility.
A high BBW indicates significant price volatility, often associated with strong trends or large price movements, which may confirm the strength of a breakout.
A low BBW suggests low volatility, potentially signaling a period of consolidation or "squeeze" that could precede a breakout. This can help traders anticipate potential trade setups.
The BBW calculation uses the EMA to maintain consistency with the system’s core parameters.
Bollinger Band Ratio (BBR) or %B: BBR measures the price’s position relative to the Bollinger Bands, providing insight into market conditions.
BBR > 1: The price is above the Upper Band, indicating potential overbought conditions or strong upward momentum, which aligns with the system’s buy signal.
BBR < 0: The price is below the Lower Band, suggesting oversold conditions or downward momentum, corresponding to the sell signal or stoploss trigger.
BBR between 0 and 1: The price is within the bands, indicating a neutral state where no immediate action is required.
Like BBW, BBR is calculated using the EMA for consistency.
Backtesting and Implementation
To evaluate the system’s performance, traders can utilize the Backtest Parameter function, which allows for testing the strategy across user-defined time periods. This feature enables traders to assess the system’s effectiveness under various market conditions, optimize parameters, and refine their approach based on historical data.
Conclusion
The Bollinger Band Breakout With Volatility Stoploss system is a robust, volatility-driven trading strategy that combines the predictive power of Bollinger Bands with disciplined risk management. By focusing on long positions, using a 1x SD multiplier, and incorporating EMA-based calculations, the system is designed to capture significant price breakouts while minimizing risk through dynamic stoplosses and volatility-adjusted position sizing. The inclusion of BBW and BBR indicators provides additional context for assessing market conditions, enhancing the trader’s ability to make informed decisions. With its structured approach and backtesting capabilities, this system is well-suited for traders seeking a systematic, data-driven method to trade in volatile markets.

Disparity Index with Volatility ZonesDisparity Index with Volatility Zones
is a momentum oscillator that measures the percentage difference between the current price and its simple moving average (SMA). This allows traders to identify overbought/oversold conditions, assess momentum strength, and detect potential trend reversals or continuations.
🔍 Core Concept:
The Disparity Index (DI) is calculated as:
DI = 100 × (Price − SMA) / SMA
A positive DI indicates the price is trading above its moving average (potential bullish sentiment), while a negative DI suggests the price is below the average (potential bearish sentiment).
This version of the Disparity Index introduces a dual-zone volatility framework, offering deeper insight into the market's current state.
🧠 What Makes This Version Unique?
1. High Volatility Zones
When DI crosses above +1.0% or below –1.0%, it often indicates the start or continuation of a strong trend.
Sustained readings beyond these thresholds typically align with trending phases, offering opportunities for momentum-based entries.
A reversal back within ±1.0% after exceeding these levels can suggest a shift in momentum — similar to how RSI exits the overbought/oversold zones before reversals.
These thresholds act as dynamic markers for breakout confirmation and potential trend exhaustion.
2. Low Volatility Zones
DI values between –0.5% and +0.5% define the low-volatility zone, shaded for visual clarity.
This area typically indicates market indecision, sideways price action, or consolidation.
Trading within this range may favor range-bound or mean-reversion strategies, as trend momentum is likely limited.
The logic is similar to interpreting a flat ADX, tight Bollinger Bands, or contracting Keltner Channels — all suggesting consolidation.
⚙️ Features:
Customizable moving average length and input source
Adjustable thresholds for overbought/oversold and low-volatility zones
Optional visual fill between low-volatility bounds
Clean and minimal chart footprint (non-essential plots hidden by default)
📈 How to Use:
1. Trend Confirmation:
A break above +1.0% can be used as a bullish continuation signal.
A break below –1.0% may confirm bearish strength.
Long periods above/below these thresholds support trend-following entries.
2. Reversal Detection:
If DI returns below +1.0% after exceeding it, bullish momentum may be fading.
If DI rises above –1.0% after falling below, bearish pressure may be weakening.
These shifts resemble overbought/oversold transitions in oscillators like RSI or Stochastic, and can be paired with divergence, volume, or price structure analysis for higher reliability.
3. Sideways Market Detection:
DI values within ±0.5% indicate low volatility or a non-trending environment.
Traders may avoid breakout entries during these periods or apply range-trading tactics instead.
Observing transitions out of the low-volatility zone can help anticipate breakouts.
4. Combine with Other Indicators:
DI signals can be enhanced using tools like MACD, Volume Oscillators, or Moving Averages.
For example, a DI breakout beyond ±1.0% supported by a MACD crossover or volume spike can help validate trend initiation.
This indicator is especially powerful when paired with Bollinger Bands:
A simultaneous price breakout from the Bollinger Band and DI moving beyond ±1.0% can help identify early trend inflection points.
This combination supports entering positions early in a developing trend, improving the efficiency of trend-following strategies and enhancing decision-making precision.
It also helps filter false breakouts when DI fails to confirm the move outside the band.
This indicator is designed for educational and analytical purposes and works across all timeframes and asset classes.
It is particularly useful for traders seeking a clear framework to identify momentum strength, filter sideways markets, and improve entry timing within a larger trading system.

Pre-London High-Low Breakout IndicatorOverview
The Pre-London High-Low Breakout Indicator helps traders identify breakout opportunities at the London session open. It marks the high and low one hour before London opens (5 PM - 6 PM AEST) and incorporates a 200 SMA filter to confirm trade direction. The indicator also provides real-time breakout markers for precise entries.
How the Indicator Works
1. Pre-London High & Low Identification (5 PM - 6 PM AEST)
The indicator tracks the highest and lowest price levels within this period.
These levels act as key breakout zones once London opens.
The high and low remain visible until 12 AM AEST for reference.
2. 200 SMA as a Trend Filter
A 200 SMA (yellow, thick line) is plotted to filter breakout trades.
Only long (buy) trades are valid if price is above the 200 SMA.
Only short (sell) trades are valid if price is below the 200 SMA.
3. Real-Time Breakout Confirmation
Buy Signal (Green Diamond):
Price breaks above the pre-London high.
Price is above the 200 SMA.
Sell Signal (Red Diamond):
Price breaks below the pre-London low.
Price is below the 200 SMA.
No signal appears if the breakout is against the SMA trend, reducing false trades.
How to Use the Indicator Properly
Step 1: Identify the Pre-London Range (5 PM - 6 PM AEST)
Observe price movements and note the session high & low.
Do not take trades within this period—wait for a clear breakout.
Step 2: Wait for a Breakout After 6 PM AEST
A breakout must occur beyond the session high or low.
The breakout should be clear and decisive, not hovering around the range.
Step 3: Confirm with the 200 SMA
If price is above the 200 SMA, only buy signals are valid.
If price is below the 200 SMA, only sell signals are valid.
If a breakout occurs against the SMA, ignore it.
Step 4: Enter the Trade and Manage Risk
Enter the trade after the breakout candle closes.
Set stop-loss just inside the pre-London range to minimize risk.
Take profit using a 1:2 or 1:3 risk-reward ratio, or trail the stop.
Why This Strategy Works
Pre-London Liquidity Grab: Institutional traders set positions before the London open, making this range significant.
Trend Confirmation with SMA: Reduces false breakouts by filtering trades in the direction of the trend.
Real-Time Breakout Detection: Green and red diamond markers highlight valid breakouts that meet all conditions.
Final Notes
If price breaks out but quickly reverses, it may be a false breakout—avoid impulsive trades.
The indicator works best when combined with other confluences such as volume analysis or key support/resistance levels.
Alerts can be added to notify traders when a valid breakout occurs.
This setup is ideal for traders looking for a structured, rule-based approach to trading London session breakouts with a strong trend confirmation mechanism.

Line Break Chart StrategyHello All!
We should not pass this year without a gift!
My last publication in 2024 is Complete Line Break Chart Strategy with many features!
What is Line Break Chart?
" Line Break is a Japanese chart style that disregards time intervals and only focuses on price movements, similar to the Kagi and Renko chart styles. Line Break charts form a series of up and down bars (referred to as lines). Up lines represent rising prices, and down lines represent falling prices. New confirmed lines only form on the chart when closing prices break the range covered by previous lines. Users can control the number of past lines used in the calculation via the "Number of Lines" input in the chart settings. The typical "Number of Lines" setting is 3, meaning the chart forms a new up line when the closing price is above the high prices of the last three lines, and it forms a new down line when the closing price is below the past three lines' low prices. If the current price is higher, it is an up line and if it is lower, it is a down line. If the current closing price is the same or the move in the opposite direction is not large enough to warrant a reversal, l then no new line is draw n" by Tradingview. You can find it here
Now let's start examining the features of the indicator:
By using Line break reversals it shows trend on the main chart. You can create alert .
Moreover, you can decide which trade should be taken by using Risk Management in the indicator. You can set the " Maximum Risk " and then if the risk is more than you set then the trade is not taken. When trend changed it checks the distance between reversal level and open price and compare it with the Maximum Risk
Breakout:
It can find breakouts and shows on the chart. You can create alert for breakouts
It can show breakouts on the main chart:
Flip-Flops:
Upon looking at set of price break charts, the trader will notice that there are instances when uptrend blocks is followed by one reversal block, and then by a reversal to a series of uptrend blocks. The opposite is also possible: a series of downtrend blocks is followed by one reversal box and then by an immediate reversal to downtrend. This price action is called a " Flip-Flop ". This structure usually produces trend continuation signal. when we see this then we better use Buy/Sell stop order. lets see this on the chart:
Temporal Sequence Table:
Sequence frequency shows the frequency distribution of the number of sequential highs and the number of sequential lows that have been generated. This is quite important to the trader who is seeking to join a trend or put on a trade when the price break reverses into a new trend direction. For example, if the pattern over the past year has been that there never were more than nine consecutive high closes, it would make sense not to enter a position late into the sequence of new high closes.
also you can see market structure. I have tried to formalize it and show it under the table. so you can understand if it's choppy market.
"Number of Lines" has very important role. While using low time frames such seconds/minutes time frame you may want to choose higher number of lines such 5,6. ( this may minimize the risk of a whipsaw )
Gaps feature:
You can set Gaps on/off. if Gaps on then you can see how long it takes for each box
Reversal and Continuation Probability:
The script calculated Reversal level and Continuation probability of the trend by using Sequence frequency.
It also shows unconfirmed box and current closing price level:
Last but not least it has Overlay option for all items, and can show all items in the main chart!
P.S. I added alerts :)
Wish you all a happy new year!
Enjoy!

Salman Indicator: Multi-Purpose Price ActionSalman Indicator: Multi-Purpose Price Action Tool for Pin Bars, Breakouts, and VWAP Anchoring
This indicator provides a comprehensive suite of price action insights, designed for active traders looking to identify key market structures and potential reversals. The script incorporates a Quarterly VWAP for trend bias, marks pin bars for possible reversal points, highlights outside bars for volatility signals, and indicates simple breakouts and pivot-level breaks. Customizable settings allow for flexibility in various trading styles, with default settings optimized for daily charts.
Outside Bars : Represented by an ⤬ symbol on the chart, these indicate bars where the current high is greater than the previous bar’s high, and the low is lower than the previous bar’s low, signaling high volatility and potential market reversals.
Pin Bars : Denoted by a small dot at the top or bottom of a candle’s wick, these are crucial signals of potential reversal areas. Pin bars are identified based on the percentage length of their shadows, with adjustable strictness in settings.
Quarterly VWAP : The light blue line on the chart represents the VWAP (Volume-Weighted Average Price), which is anchored to the Quarterly period by default. The VWAP acts as a directional bias filter, helping you to determine underlying market trends. This period, source, and offset are fully adjustable in the script’s settings.
Simple Breaks : Hollow candles on the chart indicate "simple breaks," defined when the current bar closes above the previous high or below the previous low. This is an effective way to highlight directional momentum in the market.
Bonus Pivot Breaks : The tilde symbol ~ appears when the price closes above or below prior pivot high/low levels, helping traders spot significant breakout or breakdown points relative to recent pivots.
Alerts
Simple Breaks : Alerts you when a breakout occurs beyond the previous bar’s high or low. Pin Bars : Notifies you of potential reversal points as indicated by bullish or bearish pin bars. Outside Bars : Triggers an alert whenever an outside bar is detected, indicating possible volatility changes.
How to Use
VWAP for Trend Bias : Use the Quarterly VWAP line to gauge overall market trend, with settings that allow adjustment to daily, weekly, monthly, or even larger time frames.
Pin Bars for Reversal Potential : Look for the dot markers on candle wicks, where the strictness of the pin bar detection can be adjusted via settings to match your trading preference.
Simple and Pivot Breaks for Momentum : Watch for hollow candles and the tilde symbol ~ as indicators of potential breakout momentum and pivot break levels, respectively.
This script can serve traders on multiple timeframes, from daily to weekly and beyond. The flexible configuration allows for adjustments in VWAP anchoring and pin bar criteria, providing a tailored fit for individual trading strategies.

Gann Breakout LevelsThe Complete Guide to Gann Breakout Levels Indicator
Introduction
Welcome to the comprehensive guide for the Gann Breakout Levels indicator. This powerful technical analysis tool combines traditional Gann mathematics with modern breakout detection, providing traders with a sophisticated approach to identifying market opportunities. Whether you're trading stocks, forex, cryptocurrencies, or commodities, this indicator offers valuable insights into price action and market structure.
Understanding the Core Functionality
The Gann Breakout Level indicator operates on two fundamental principles: Gann's mathematical framework and dynamic breakout detection. Here's a detailed breakdown of how it works:
Price Threshold System
The indicator utilizes 46 carefully calibrated threshold levels, ranging from 0.110 to 2.04. These thresholds serve as reference points for potential price movements and market structure analysis. Each level is designed to capture significant price action while filtering out market noise.
Signal Generation
- Upward Breakouts: When price action exceeds a threshold level, the indicator generates a green upward triangle above the candle.
- Downward Breaks: Following a breakout, if price retraces below the specified percentage (default 2.78%), a red downward triangle appears below the candle.
Configuration and Setup
Essential Settings
1. Show Gann Square Lines
- Purpose: Displays key price levels based on Gann mathematics
- Recommended: Enabled for most trading styles
2. Enable Line Extension
- Purpose: Projects price levels into the future
- Application: Useful for identifying potential support/resistance zones
3. Breakout Percentage Level
- Default: 2.78%
- Adjustable Range: 0.1% to custom value
- Impact: Determines sensitivity of breakdown signals
Trading Applications
Market Analysis Framework
The indicator provides three critical reference levels:
1. Upper Bound (Red Line)
- Primary resistance level
- Breakout confirmation zone
- Potential profit-taking area
2. Lower Bound (Red Line)
- Key support level
- Stop-loss reference point
- Breakdown confirmation zone
3. Mid Point (Blue Line)
- Equilibrium price level
- Partial profit-taking reference
- Trend direction confirmation
Trading Strategies
#### Swing Trading Approach
1. Entry Criteria
- Wait for green triangle signal
- Confirm with volume increase
- Verify overall trend alignment
- Check for supporting price action
2. Risk Management
- Place stops below nearest Gann level
- Use scaling techniques for position building
- Implement trailing stops based on Gann levels
#### Position Trading Method
1. Signal Identification
- Look for red triangle after established uptrend
- Confirm with price action patterns
- Verify volume characteristics
2. Position Management
- Set precise entry points at Gann levels
- Define clear stop-loss parameters
- Establish multiple profit targets
Timeframe Optimization
### Swing Trading
- Timeframes: 4-hour to daily charts
- Breakout Percentage: 2.78% to 3.5%
- Focus: Trend following and major support/resistance breaks
### Position Trading
- Timeframes: Daily and weekly charts
- Breakout Percentage: 3.5% to 4%
- Focus: Long-term trend identification and major market shifts
### Market Condition Adaptation
The indicator's threshold matrix automatically adjusts to:
- Trending markets
- Ranging conditions
- High volatility periods
- Low volatility environments
Best Practices
### Risk Management Guidelines
1. Position Sizing
- Limit risk to 1-2% per trade
- Scale positions based on conviction
- Adjust size based on volatility
2. Stop Loss Implementation
- Always use protective stops
- Base stops on Gann levels
- Consider volatility when setting stops
### Signal Validation
1. Primary Confirmation Factors
- Volume analysis
- Price action patterns
- Market structure
- Trend alignment
2. Secondary Confirmation Elements
- Multiple timeframe analysis
- Support/resistance levels
- Market sentiment
- Technical indicators
## Market Selection
- Most effective in liquid markets
- Optimal for major currency pairs
- Reliable for large-cap stocks
- Applicable to major cryptocurrency pairs
Recommended Trading Approach
### Swing Trading Setup
1. Use 4-hour and daily charts for primary analysis
2. Focus on major market moves
3. Hold positions for several days to weeks
4. Use wider stops to accommodate market volatility
### Position Trading Setup
1. Utilize daily and weekly charts
2. Focus on major trend changes
3. Hold positions for weeks to months
4. Base exits on trend reversal signals
## Performance Optimization
1. Regular Review
- Monitor win rate
- Track average profit per trade
- Analyze maximum drawdown
- Review position sizing effectiveness
2. Strategy Refinement
- Adjust parameters based on market conditions
- Fine-tune entry and exit rules
- Optimize position management
- Update risk parameters as needed
Conclusion
The Gann Breakout Levels indicator represents a sophisticated approach to market analysis, combining historical wisdom with modern technical analysis. It's particularly effective for swing and position trading, where its mathematical principles can best capture significant market moves. Success with this tool requires understanding its principles, proper configuration, and integration with a comprehensive trading strategy.
Remember that while this indicator provides valuable insights, it should be part of a broader trading strategy that includes proper risk management, market analysis, and disciplined execution. Consistent success comes from proper application of the tool's signals within a well-defined trading plan.
This indicator serves as a powerful addition to any trader's toolkit, providing objective entry and exit signals based on time-tested principles. With proper understanding and application, it can significantly enhance your trading decision-making process for longer-term trading approaches.

Master Candle Breakout V1 Master Candle Breakout V1 - Indicator Description
The Master Candle Breakout V1 indicator is a powerful price action-based tool designed to help traders identify and capitalize on breakout opportunities from consolidation phases. This indicator is particularly useful for identifying master candles, which are large candles that encompass the range of subsequent candles, creating a key level of support or resistance. Once the price breaks above or below the range of the master candle, the indicator provides clear buy or sell signals, allowing traders to ride the momentum of the breakout.
Key Features:
Master Candle Detection: The indicator identifies master candles based on a user-defined period, marking them on the chart as critical breakout points.
Buy and Sell Signals: When the price breaks above the master candle's high, a buy signal is plotted. Similarly, when the price breaks below the master candle's low, a sell signal is generated. These signals are displayed on the chart with customizable shapes (diamonds, arrows, circles, crosses) and colors for easy visualization.
Stop-Loss Level Display: For risk management, the indicator calculates and plots a stop-loss level based on user-defined ticks above or below the master candle's high or low. The stop-loss value is shown as a label next to the signal, helping traders manage risk effectively.
Customizable Colors and Shapes: Users can fully customize the appearance of the signals, including the color of the buy/sell diamonds, the stop-loss label text color, and the type of shape used for the signals.
Versatile Application: The Master Candle Breakout V1 can be applied to any timeframe and market, from forex and stocks to commodities and cryptocurrencies, making it a highly versatile tool for traders of all types.
How to Use:
Master Candle Period: Define how many candles should follow the master candle for confirmation.
Stop Loss Ticks: Set the number of ticks above or below the master candle to define your stop-loss level.
Entry Signals: Once the price closes outside the high or low of the master candle, enter the trade accordingly (buy on breakouts above the high, sell on breakouts below the low).
Risk Management: Use the stop-loss level provided by the indicator to minimize losses and protect your capital.
This indicator is perfect for traders who prefer a simple, price-action-based strategy and want to avoid the clutter of traditional indicators. By focusing on the core principle of breakouts, Master Candle Breakout V1 helps traders quickly identify consolidation zones and potential breakout trades.

Wedge BreakoutThe Wedge Breakout indicator is designed to identify and signal potential breakouts from a wedge pattern, a common technical analysis formation. A wedge pattern typically forms when the price moves within converging trendlines, indicating a potential upcoming breakout either upwards (bullish) or downwards (bearish).
Identifying Pivot Points:
The indicator first calculates pivot points, which are significant highs and lows that define the wedge's upper and lower boundaries.
Pivot Lows: It identifies the lowest price points over a specified length (input_len), which serves as the lower boundary of the wedge.
Pivot Highs: Similarly, it identifies the highest price points over the same length, forming the upper boundary of the wedge.
Drawing Trendlines:
The pivot points are connected to form dashed trendlines that represent the upper and lower boundaries of the wedge.
The indicator uses the SimpleTrendlines library to manage and draw these trendlines dynamically:
Green Trendline: Indicates an upward slope (bullish).
Red Trendline: Indicates a downward slope (bearish).
Calculating the Breakout Conditions:
A breakout is confirmed when the price action fulfills two conditions:
The candle's high exceeds the upper trendline's highest point.
The candle's low drops below the lower trendline's lowest point.
This condition suggests that the price is squeezing within the wedge pattern and is about to break out.
Determining Breakout Direction:
The direction of the breakout is determined by the candle's closing position relative to its opening:
Bullish Breakout (Upward): When the candle closes above its opening price (close > open) after breaching both trendlines, it suggests a bullish breakout. This condition is marked with a green upward triangle .
Bearish Breakout (Downward): When the candle closes below its opening price (close < open) after breaching both trendlines, it suggests a bearish breakout. This condition is marked with a red downward triangle.
Visual Representation:
Green Triangle Up: Plotted below the bar to indicate a potential bullish breakout.
Red Triangle Down: Plotted above the bar to indicate a potential bearish breakout.
Used library:
www.tradingview.com

JL Swing Signal - {UT}Hello all, This signal is created based on Jesse Livermore's formula, I have tried to enhance it by including other elements to make the experience better and rewarding.
1. Swing Highs and Swing Lows:
>Identifies a swing high when the current high is higher than the highs of the specified number of bars to its left and right.
>Identifies a swing low when the current low is lower than the lows of the specified number of bars to its left and right.
>Also marks the confirmed swing highs (SH) and swing lows (SL) on the chart for visual reference.
2. Breakout Confirmation:
> Finds out when the closing price crosses above the last confirmed swing high.
> Ensures that the breakout is sustained for the defined number of confirmation bars to filter out false breakouts.
>BuySignal: A buy signal is generated only when both the breakout and hold conditions are met.
3. Trend Filter:
>EMA Calculation: A 50-period EMA is used to filter trades in the direction of the existing trend. Trades are only taken in the direction of the trend.
>Ensures buy signals are only triggered if the price is above the EMA, indicating an uptrend.
4. Volume Confirmation:
Volume Moving Average: A 20-period Simple Moving Average (SMA) of volume is calculated to compare current volume levels.
5. Profit Target:
ATR-Based Profit Target: A dynamic profit target is set based on a multiple of the ATR. This helps capture profits when the market moves in the trade's favor.
6. Exit Strategy:
Stop Loss and Profit Target: The script exits the trade if the price hits the stop loss or the profit target.
Interpretaion:
Buy Signals: Displayed with a green "BUY" label.
Stop Loss and Profit Target: Plotted as orange and green lines, respectively.
Exit Signals: Displayed with a red "EXIT" label when the exit conditions are met.

ACD Indicator [TradingFinder] M Fisher Pivots Methodology Signal🔵 Introduction
The book "The Logical Trader" begins with a comprehensive review of the ACD Methodology principles, which include identifying specific price points related to the opening range.
This method allows you to set reference points for trading and use points "A" and "C" for trade entry. You will also learn about the "Pivot Range" and how to combine them with the ACD method to maximize position size and minimize risk.
In this indicator, the strategy is implemented to make it easier to use.
🔵 How to Use
The "ACD" strategy can be applied to various markets such as stocks, commodities, or forex, providing buy and sell signals that allow you to set your price targets and stop losses.
This strategy is based on the assumption that the opening range of trades is statistically significant each day, meaning the initial market fluctuations influence the market until the end of the day.
The ACD trading strategy is known as a breakout strategy and performs best in volatile or strongly trending markets, such as crude oil and stocks.
Some of the rules for using the ACD strategy include the following :
Consider points A and C as reference points and continuously pay attention to these points during trades. These points serve as entry and exit points for trades.
Examine daily and multi-day pivot ranges to analyze market trends. If the price is above the pivots, the trend is upward, and if below the pivots, the trend is downward.
Trading with the ACD strategy in forex is possible using the ACD indicator. This indicator is a technical tool used to measure the balance between supply and demand in the market. By analyzing trading volume and price, this indicator helps traders identify trend strength and suitable entry and exit points.
To use the ACD indicator, consider the following :
Identifying strong trends: The ACD indicator can help you identify strong and stable trends in the market.
Determining entry and exit points: ACD provides buy and sell signals to enter or exit trades at the best possible time.
Bullish Setup :
When the "A up" line is broken, it is advisable to wait for some time to ensure that this is not a "Fake Breakout" and that the price stabilizes above this line.
After entering the trade, the best stop loss you can choose is below the "A down" line. However, it is recommended to test this in backtests to achieve the best results. The suitable reward-to-risk ratio for this strategy is 1, which should also be backtested.
Bearish Setup :
When the "A down" line is broken, it is advisable to wait for some time to ensure that this is not a "Fake Breakout" and that the price stabilizes below this line.
After entering the trade, the best stop loss you can choose is above the "A up" line. However, it is recommended to test this in backtests to achieve the best results. The suitable reward-to-risk ratio for this strategy is 1, which should also be backtested.
🔵 Setting
NDay Pivot Range Period : Using this entry you can specify the number of days to calculate NDay Pivot Range.
Show Daily Pivot Range : Set the Daily Pivot color and displayed or not.
Show NDay Pivot Range : Set the NDay Pivot color and displayed or not.
ATR Period Levels : Determining the period of the ATR indicator, which is used to determine the A and C levels.
Show Tokyo ACD Setup : Set the Tokyo ACD Setup color and displayed or not.
Tokyo Opening Range Time : The amount of time taken to determine the opening range. You can set this number between 5 and 60 minutes.
Tokyo Session : Market start and end time.
A Level Multiplier : The coefficient that is multiplied by ATR to determine the distance of line A up and A down.
C Level Multiplier : The coefficient that is multiplied by ATR to determine the distance of line C up and C down.
The same settings exist for the London and New York sessions.

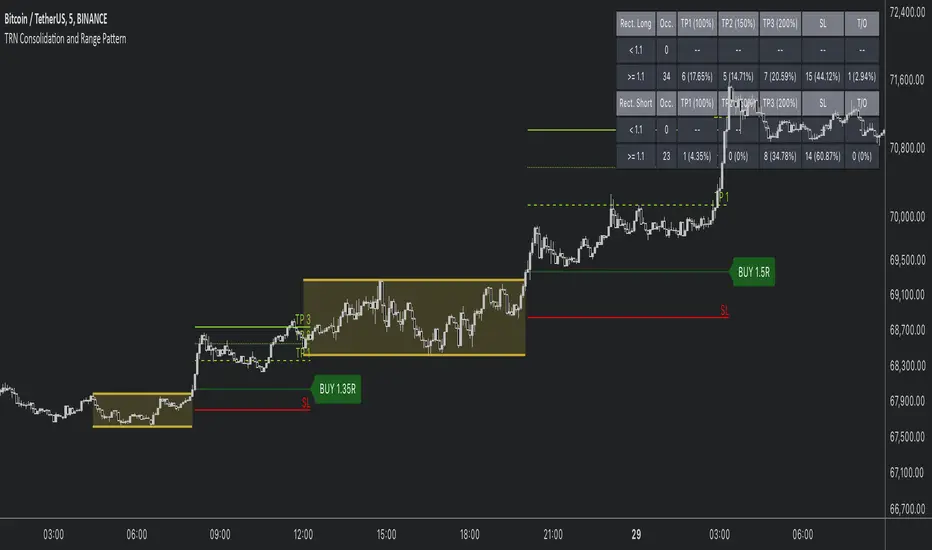
Consolidation and Range PatternHello Traders!
The TRN Consolidation and Range Pattern indicator utilizes a unique swing-based pattern recognition to pinpoint consolidation zones in real-time with unparalleled precision. The rectangle pattern, also known as a trading range or a consolidation pattern, is characterized by horizontal lines that act as support and resistance levels, creating a rectangular shape.
The value of this indicator is to support traders to easily identify consolidations and ranges. The special swing-based pattern recognition and the numerous built-in premium features make this indicator unique. Below, you'll find a list of these features.
Feature List
Real-time consolidation/range detection
Visualization of entry, stop-loss and take-profit levels
Pattern performance statistics
Calculation of risk rewards ratio
Risk Management
Breakout alerts
Customizable pattern size and accuracy
Customizable look and feel
The trader saves a lot of time scanning the markets for consolidation patterns, since everything is done automatically for the trader: Finding the consolidation, looking and alerting for a breakout, computing the entry, stop loss and take profit levels as well as handling the risk management and computing the optimal order quantity. Now, we describe how a combination of these features enhances the trading performance of confirmed consolidation patterns.
How to Trade with the TRN Consolidation and Range Pattern
Identify the Pattern
Add the TRN Consolidation and Range Pattern to your chart and look for the pattern on the asset and timeframe of your choice. The pattern is detected in real-time. If the pattern develops further in the next bars, then the indicator updates the consolidation zone until a breakout is confirmed.
You can also use the built-in alerts to easily get notified when a pattern occurs. In the indicator settings in the "Alerts" section you can choose whether you want to get notified when a pattern is in the making (Pattern active), confirms a breakout to the upside (B/O Up Confirmed) or confirms a breakout to the downside (B/O Down Confirmed). By selecting the "Unconfirmed" option, you will receive notifications when a pattern breakout occurs, even if it is not yet confirmed. This allows you to stay informed about potential breakout opportunities that are still awaiting confirmation.
Check Pattern Statistics
The pattern statistics make it easy for you to see how successful a pattern is on the asset and timeframe you are watching. You should always check them out before entering a trade. The chart displays the statistics in the upper right corner. These statistics are categorized into two sections: "long" for patterns with an upward breakout and "short" for patterns with a downward breakout.
In the initial columns, labeled as "short" and "long", the identified breakouts are further divided based on whether the risk-reward ratio (R) is below a specified value (< x) or equal to/greater than the specified value (>= x). The following columns represent the count of the events:
1. Occ. (Occurrence) categorized according to the values of R from the first column
2. TP1, TP2, TP3 (Take Profit) - targets 1, 2 and 3
3. SL (Stop Loss)
4. T/O (Time Out) - neither stop loss or targets where hit in a certain amount of time
Breakout – Entry, Stop Loss and Targets
The indicator automatically displays the entry price line (EP) in grey et the point where the price breaks through the resistance or support levels, indicating that the consolidation period is over. Once a breakout has been confirmed, place a buy order near the EP level for a long position, or a sell order for a short position. Set your stop-loss at the price level of the red stop-loss line (SL) and set your take-profits at the price level of the green take-profit-lines (TP1, TP2, TP3). Note that your risk-reward ratio (R) was calculated based on TP1.
Risk Management
The TRN Consolidation and Range Pattern comes with a built-in risk management feature. Just go to the settings and scroll down to the section "Risk Management".
Here you can enter your Account Size and the percentage you want to Risk when you enter a position after a pattern breakout.
In the "Trade Management" section, you have the option to define the minimum accepted risk-reward ratio for confirmed rectangles. This means that breakouts of patterns failing to meet the minimum risk-reward ratio will not be considered as confirmed signals.
If a breakout gets confirmed, the indicator automatically calculates the position size (Quantity). You can read the quantity from the gray entry point line (EP), which is located to the right of the risk-reward ratio (R).
Customization and Settings
The indicator can scan for smaller and larger patterns at the same time. Adjust the consolidation sizes in the indicator settings to align them with your preferences. A larger size results in larger consolidations. Depending on the asset class, the market or the market phase, different sizes can be used for the consolidation detection.
To detect more patterns, increase the tolerance level, even though it may result in lower accuracy. However, be mindful that a higher tolerance level may result in more patterns hitting their stop-loss. Look for a tolerance level that leads to favorable statistics and focus on trading patterns with a proven performance history.
Finally, you have the flexibility to customize various visual elements, such as the color of the pattern and whether to display values like price, target, or risk-reward ratio on your chart. You can also choose where these values appear.
Computation Details
The real-time detection of the consolidations and ranges utilizes a unique swing-based pattern recognition. The difference to other swing-based computations is that the pivot points are identified without a look-ahead value. The result is a faster and better real-time detection. Furthermore, the detection of equal lows or highs which form a support or resistance level is based on a dynamic volatility measurement similar to the ATR. The tolerance level unites several internal parameters into one and results in a user-friendly setting.
Risk Disclaimer
The content, tools, scripts, articles, and educational resources offered by TRN Trading are intended solely for informational and educational purposes. Remember, past performance does not ensure future outcomes.
NIFTY Money Flow - Scalping/SwingBrief Description About Script
It considers the change of price in the direction
change of price is +Ve then considered as +Ve money flow
-Ve then considered as -Ve money flow
and it multplied by Volume change
This Strategy works best with NIFTY
For Scalping:-
Settings:- 1 Min Candle Time Frame, Length 20
For Swing:-
Setting:- 30 Min Candle Time Frame, Length 11
How to use it?
Common usage:-
Buy - When turns Red to Green Buy by keeping 1.5 * ATR as SL or Trailing SL(Optional) at the same time frame
Sell - When turns Green to Red SL by keeping 1.5 * ATR as SL or Trailing SL(Optional) at the same time frame
Trend reversal:-
Draw Divergence between indicator and price
Buy - Indicator forms Higher Highs(Red Side), Price Lower Lows
Sell - Indicator forms Lower Lows(Green Side), Price Higher Highs
Breakouts:-(Less Accurate compared to other scenarios)
End of Triangel/Box Indicator Turns Red to Green - Bullish Breakout, Green to Red Bearish Breakout
can use for breakouts chart patterns and guess which side it's going to break
can use for reversal as well by observing divergence between price & indicator
Note:-
In the future, an updated version is coming with it auto-generated buy/sell signal on the chart & gives backtesting results as a strategy

Macro-Filtered Volatility Breakout (MVB)策略簡介:
這是一套專門針對高 Beta 值資產(如 ETH, SOL 等山寨幣)設計的趨勢跟隨系統。我們解決了傳統突破策略在山寨幣市場中「假突破(False Breakout)」過多的痛點。
核心邏輯:
市場體制過濾(Regime Filtering): 加密貨幣市場具有高度的相關性。本策略引入比特幣(BTC)作為**「宏觀市場指標」**,只有當 BTC 處於確立的多頭趨勢時,才允許執行山寨幣的做多信號。這有效規避了「大盤崩盤時,小幣假突破」的系統性風險。
動態波動率通道: 我們不使用固定價格止損,而是採用肯特納通道(Keltner Channels)。這利用 ATR(平均真實波幅)動態調整進出場區間:在市場平靜時通道收窄以敏銳捕捉啟動點,在劇烈波動時通道放寬以避免被雜訊洗出場。
風控特徵:
系統性避險: 透過 BTC 趨勢濾網,在熊市或大盤回調期間自動空手,降低回撤。
獲利奔跑(Let Profits Run): 採用基於波動率的移動止損(Volatility Trailing Stop),在大趨勢中能吃到完整的魚身。
免責聲明:
以上策略分享僅供學術研究、回測實驗與邏輯參考,並不代表對未來獲利的保證。 過往的回測績效不代表未來的行情表現。本文內容不構成任何投資建議。加密貨幣交易具有高度風險,使用者應自行評估風險承受能力並自負盈虧,本人不承擔任何因使用此策略而產生的資金損失。
Strategy Overview
This is a trend-following system specifically designed for high-beta assets, such as altcoins like ETH, SOL, and similar cryptocurrencies. The strategy addresses a key weakness of traditional breakout systems in altcoin markets—the high frequency of false breakouts.
Core Logic
Market Regime Filtering
The cryptocurrency market exhibits strong cross-asset correlation. This strategy uses Bitcoin (BTC) as a macro market indicator. Long signals on altcoins are only allowed when BTC is in a confirmed bullish trend, effectively avoiding the systemic risk of altcoin false breakouts during broader market downturns.
Dynamic Volatility Channels
Instead of fixed-price stop losses, the strategy employs Keltner Channels, which adapt dynamically using ATR (Average True Range).
During low-volatility conditions, the channel narrows to sensitively capture early trend initiation.
During high-volatility environments, the channel widens to prevent premature exits caused by market noise.
Risk Management Features
Systematic Risk Avoidance
By applying BTC trend filtering, the strategy automatically stays in cash during bear markets or major market pullbacks, significantly reducing drawdowns.
Let Profits Run
A volatility-based trailing stop is used to maximize profit capture during strong directional trends, allowing positions to benefit from the full trend structure.
Disclaimer
The strategy presented above is for academic research, backtesting experiments, and logical reference only. It does not constitute a guarantee of future performance. Past backtest results are not indicative of future outcomes. This content does not represent any investment advice. Cryptocurrency trading involves substantial risk, and users should assess their own risk tolerance and assume full responsibility for any gains or losses. The author bears no liability for any financial losses incurred from the use of this strategy.

Ultimate Squeeze & BreakoutTitle: Ultimate Squeeze & Breakout
Description: This indicator is a volatility analysis tool designed to identify periods of market compression ("The Squeeze") and validate subsequent breakouts using momentum logic. It builds upon the classic relation between Bollinger Bands and Keltner Channels but adds a directional filter to reduce false signals.
The Problem It Solves: Standard squeeze indicators often signal a breakout the moment price exits the bands, even if the underlying trend is weak or flat. This can lead to entering "wicks" or fakeouts. This script solves this by requiring the Basis Line Slope to align with the breakout direction before generating a signal.
How It Works:
1. Compression (The Setup) The script monitors the relationship between Bollinger Bands (Standard Deviation) and Keltner Channels (ATR).
Red Cloud: When the Bollinger Bands contract completely inside the Keltner Channels, it indicates a critical drop in volatility. The market is coiling and storing energy.
2. The Momentum Filter (The Validation) Unlike basic squeeze indicators, a breakout is not signaled solely by price closing outside the bands.
Logic: The script calculates the slope of the 20-period Basis Line (Simple Moving Average).
Bullish Validation: Price > Upper Band AND Basis Line is sloping UP.
Bearish Validation: Price < Lower Band AND Basis Line is sloping DOWN.
Visual Guide:
🟥 Red Cloud: Squeeze ON. Volatility is compressed. Do not trade; wait for expansion.
🟣 Fuchsia Cloud: Bullish Breakout (Price released upward + Positive Momentum).
🔵 Blue Cloud: Bearish Breakout (Price released downward + Negative Momentum).
⬜ Gray/Green Cloud: Standard Trending phase (Volatility is normal).
Features:
Precision Inputs: Multipliers for Standard Deviation and ATR can be adjusted in 0.01 increments for fine-tuning sensitivity.
Visual Toggles: Option to color the neutral trending cloud Green or Gray based on preference.
Alerts: Built-in alerts for "Squeeze Started" and validated "Bullish/Bearish Breakouts."
Credits: Core mechanics based on the TTM Squeeze concept popularized by John Carter. Momentum filtering logic added for enhanced signal reliability.

Sen Channel LiteSen Channel Lite
Sen Channel Lite calculates a robust, median-based regression channel using the Theil–Sen slope method. This visual tool helps traders identify trend direction and potential breakout zones in real time.
Key Features
Dynamic Trend Line: The median-based regression line adapts to price movement, providing a central reference for trend direction.
Upper and Lower Bands: Automatically updated bands highlight potential breakout or reversal areas.
Breakout Markers: Optional triangles indicate when price crosses above the upper band or below the lower band.
Midline (EMA/SMA): Toggleable trend line for additional context on price direction.
VWAP Anchor: Optional VWAP plot to visualize volume-weighted average price levels.
Customizable Inputs:
Lookback Period for slope calculation
Band Multiplier to adjust sensitivity
Option to use Standard Deviation or ATR for band width
Midline type, length, and color
VWAP visibility and color
Channel cloud transparency
How to Read Signals (Educational Use Only):
Trend Context: The midline provides a reference for general trend direction. Price above the midline suggests bullish bias; below indicates bearish bias.
Breakouts:
Triangle up → price crossed above the upper band; potential strong move upward.
Triangle down → price crossed below the lower band; potential strong move downward.
Channel Interpretation:
Price near the upper band → market may be overextended.
Price near the lower band → market may be oversold.
Price moving within the channel → trend is balanced; use additional analysis for direction.
VWAP Context: Compare price to VWAP for intraday support/resistance insights.
Usage Notes:
Fully visual tool; no trading or financial advice.
All calculations are protected to preserve intellectual property.
Results reflect real-time calculations; no repainting.
Suitable for intraday to daily timeframes.
Important: This script is published as protected/closed-source to safeguard GammaBulldog intellectual property.
Quantum Trend MatrixThe Quantum Trend Matrix (QTM) is a comprehensive technical analysis suite designed to solve the problem of market noise by combining Statistical Volatility Structure with Momentum Trend Filtration.
Many traders struggle because they trade momentum signals (like crossovers) without considering the daily structural limits of the market. This script integrates these two concepts into a single "Roadmap" to help traders align their entries with institutional price structure.
🎯 Concept & Methodology (How it Works)
This script is not merely a collection of indicators; it is a logic-based system where components effectively filter one another:
1. Structural Volatility Levels (The "Map")
Unlike standard Support/Resistance which is subjective, QTM calculates objective levels based on the internal logic.
Methodology: The script applies specific percentage-based volatility coefficients (tailored to the asset class, e.g., Indices ,Commodities,etc) to the Price.
* The Green Line (Breakout Level) : Represents the statistical upper volatility limit above which a "Bullish Expansion" is expected to occur.
* The Red Line (Breakdown Level): Represents the statistical lower volatility limit Below which a "Bearish Expansion" is expected to occur.
* Why this is useful: It prevents traders from chasing trends in the "chop zone" (between the lines) and highlights high-probability breakout areas.
2. The Value Zone (Trend Validation)
* Methodology: This utilizes a High-Timeframe moving average ribbon logic (calculated using Daily data).
* Function: It acts as a dynamic trend filter. A breakout signal (Green Line cross) is statistically significant if the Price is also supported by the Value Zone (Blue Ribbon). If the Ribbon is Orange, a bullish breakout is likely a "False Trap".
3. Momentum & Exhaustion Logic
* Crossovers (Circles): Validates short-term trend shifts using smoothed exponential average crossovers.
* Mean Reversion (Diamonds): Uses an integrated Oscillator Momentum logic to detect over-extended price action. A Diamond signal warns that the price has deviated too far from the mean (VWAP) and trend continuation is risky.
🛠️ Practical Application
This script is designed for a top-down decision process:
1. Wait for Structure: For Trending Moves do not trade inside the Pivot (Blue) to Breakout (Green/Red) range. This is the "Noise" zone.
2. Confirm the Breakout: Wait for a candle to CLOSE outside the Green or Red volatility levels or to take Support/Resistance from Red/Green Levels respectively.
3. Check the "Value Zone": Ensure the background ribbon color matches the breakout direction (Blue for Long, Orange for Short).
4. Monitor Health: Use the bottom-right panel (displaying RSI, ADX, and DI metrics) to ensure trend strength is sufficient to sustain the move.
⚠️ Disclaimer & Risk Disclosure
* Logic Disclosure: While the specific volatility coefficients and smoothing lengths are proprietary, this script relies on standard technical analysis concepts including Moving Averages, RSI, ADX, and Percentage-based levels relative to the Price.
* No Guarantee: Technical analysis is probabilistic, not predictive. Past performance does not guarantee future results.
* Risk Management: Always use Stop Losses. This tool is an aid for analysis, not a replacement for risk management.
🔒 Access Information
This is a proprietary Invite-Only script.
*(Note: Do not ask for access in the comments below. Please refer to the author's signature or profile for more information).*

Trend Breakout & Ratchet Stop System [Market Filter]Description:
This strategy implements a robust trend-following system designed to capture momentum moves while strictly managing downside risk through a multi-stage "Ratchet" exit mechanism and broad market filters.
It is designed for swing traders who want to align individual stock entries with the overall market direction.
How it works:
1. Market Regime Filters (The "Safety Check") Before taking any position, the strategy checks the health of the broader market to avoid "catching falling knives."
Broad Market Filter: By default, it checks NASDAQ:QQQ (adjustable). If the benchmark is trading below its SMA 200, the strategy assumes a Bear Market and suppresses all new long entries.
Volatility Filter (VIX): Uses CBOE:VIX to gauge fear. If the VIX is above a specific threshold (Default: 32), entries are paused, and existing positions can optionally be closed to preserve capital.
2. Entry Logic Entries are based on Momentum and Trend confirmation. A position is opened if filters are clear AND one of the following occurs:
Golden Cross: SMA 25 crosses over SMA 50.
SMA Breakouts: A "Three-Bar-Break" logic confirms a breakout above the SMA 50, 100, or 200 (price must establish itself above the moving average).
3. The "Ratchet" Exit System The exit logic evolves as the trade progresses, tightening risk like a ratchet:
Stage 0 (Initial Risk): Starts with a standard percentage Stop Loss from the entry price.
Stage 1 (Breakeven/Lock): Once the price rises by Profit Step 1 (e.g., +10%), the Stop Loss jumps to a tighter level and locks there. This secures the initial move.
Stage 2 (Trailing Mode): If the price continues to rise to Profit Step 2 (e.g., +15%), the Stop Loss converts into a dynamic Trailing Stop relative to the Highest High. This allows the trade to run as long as the trend persists.
Additional Exits:
Dead Cross: Closes position if SMA 25 crosses under SMA 50.
VIX Panic: Emergency exit if volatility spikes above the threshold.
Settings & Customization:
SMAs: Adjustable lengths for all Moving Averages.
Filters: Toggle Market/VIX filters on/off and choose your benchmark ticker (e.g., SPY or QQQ).
Risk Management: Fully customizable percentages for the Ratchet steps (Initial SL, Stage 1 Trigger, Trailing distance).

Support & Resistance Zone Hunter [BOSWaves]Support & Resistance Zone Hunter - Dynamic Structural Zones with Real-Time Breakout Intelligence
Overview
The Support & Resistance Zone Hunter is a professional-grade structural mapping framework designed to automatically detect high-probability support and resistance areas in real time. Unlike traditional static levels or manually drawn zones, this system leverages pivot detection, range thresholds, and optional volume validation to create dynamic zones that reflect the true structural architecture of the market.
Zones evolve as price interacts with their boundaries. The first touch of a zone determines its bias - bullish, bearish, or neutral - and the system tracks the full lifecycle of each zone from formation, testing, and bias establishment to potential breakout events. Diamond-shaped breakout signals highlight structurally significant price expansions while filtering noise using a configurable cooldown period.
By visualizing market structure in this way, traders gain a deeper understanding of price behavior, trend momentum, and areas where liquidity and reactive forces are concentrated.
Theoretical Foundation
The Support & Resistance Zone Hunter is built on the premise that meaningful structural zones arise from two core principles:
Pivot-Based Turning Points : Only significant highs and lows that represent actual swings in price are considered.
Contextual Validation : Zones must pass minimum range criteria and optional volume thresholds to ensure their relevance.
Markets naturally generate numerous micro-pivots that do not carry predictive significance. By filtering out minor swings and validating zones against volume and range, the system isolates levels that are more likely to attract future price interaction or act as catalysts for breakout moves.
This framework captures not only where price is likely to react but also the direction of potential pressure, providing a statistically grounded, visually intuitive representation of market structure.
How It Works
The Support & Resistance Zone Hunter constructs zones through a multi-layered process that blends pivot logic, range validation, and real-time bias determination:
1. Pivot Detection Core
The indicator identifies pivot highs and pivot lows using a configurable lookback period. Zones are only considered valid when both a top and bottom pivot are present.
2. Zone Qualification Engine
Prospective zones must satisfy two conditions:
Range Threshold : The distance between pivot high and low must exceed the minimum percentage set by the user.
Volume Requirement : If enabled, the current volume must exceed the 50-period moving average.
Only zones meeting these criteria are drawn, reducing noise and emphasizing high-probability structural levels.
3. Zone Lifecycle
Once a valid top and bottom pivot exist:
The zone is created starting from the pivot formation bar.
Zones remain active until both boundaries have been touched by price.
The first boundary touched establishes bias: resistance first → bullish bias ,support first → bearish bias, neither → neutral.
Inactive zones stop expanding but remain visible historically to maintain a clear structural context.
4. Visual Rendering
Active zones are displayed as filled boxes with color corresponding to their bias. Top, bottom, and midpoint lines are drawn for reference. Once a zone becomes inactive, its lines are removed while the filled box remains as a historical footprint.
5. Breakout Detection
Breakout signals occur when price closes above the top boundary or below the bottom boundary of an active zone. The system applies a cooldown period and requires price to return to the zone since the previous breakout to prevent signal spam. Bullish and bearish breakouts are visually represented by diamond-shaped markers with configurable colors.
Interpretation
The Support & Resistance Zone Hunter provides a structural view of market balance:
Bullish Zones : Form when resistance is tested first, indicating upward pressure and potential continuation.
Bearish Zones : Form when support is tested first, reflecting downward pressure and continuation risk.
Neutral Zones : Fresh zones that have not yet been interacted with, representing undiscovered liquidity.
Breakout Diamonds : Highlight significant structural price expansions, helping traders identify confirmed continuation moves while filtering noise.
Zones do not simply indicate past levels; they dynamically reflect the evolving battle between buyers and sellers, providing actionable context for both trend continuation and reversion strategies.
Strategy Integration
The Support & Resistance Zone Hunter is versatile and can be applied across multiple trading approaches:
Trend Continuation : Use bullish and bearish zones to confirm directional bias. Breakout diamonds indicate structural continuation opportunities.
Reversion Entries : Neutral zones often act as magnets in ranging markets, allowing for high-probability mean-reversion setups.
Breakout Trading : Diamonds mark true structural expansions, reducing false breakout risk and guiding stop placement or momentum entries.
Liquidity Zone Alignment : Combining the indicator with order block, breaker, or volume-based tools helps validate zones against broader market participation.
Technical Implementation Details
Pivot Engine : Two-sided pivot detection based on configurable lookback.
Zone Qualification : Minimum range requirement and optional volume filter.
Bias Logic : Determined by the first boundary touched.
Zone Lifecycle : Active until both boundaries are touched, historical visibility retained.
Breakout Signals : Diamond markers with cooldown filtering and price-return validation.
Visuals : Transparent filled zones with live top, bottom, and midpoint lines.
Suggested Optimal Parameters
Pivot Lookback : 10 - 30 for intraday, 20 - 50 for swing trading.
Minimum Range % : 0.5 - 2% for crypto or indices, 1 - 3% for metals or forex.
Volume Filter : Enable for assets with inconsistent liquidity; disable for consistently liquid markets.
Breakout Cooldown : 5 - 20 bars depending on volatility.
These suggested parameters should be used as a baseline; their effectiveness depends on the asset and timeframe, so fine-tuning is expected for optimal performance.
Performance Characteristics
High Effectiveness:
Markets with clear pivot structure and reliable volume.
Trending symbols with consistent retests.
Assets where zones attract repeated price interaction.
Reduced Effectiveness:
Random walk markets lacking structural pivots.
Low-volatility periods with minimal price reaction.
Assets with irregular volume distribution or erratic price action.
Integration Guidelines
Use zone color as contextual bias rather than a standalone signal.
Combine with structural tools, order blocks, or volume-based indicators for confluence.
Validate zones on higher timeframes to refine lower timeframe entries.
Treat breakout diamonds as confirmation of continuation rather than independent triggers.
Disclaimer
The Support & Resistance Zone Hunter provides structural zone mapping and breakout analytics. It does not predict price movement or guarantee profitability. Success requires disciplined risk management, proper parameter calibration, and integration into a comprehensive trading strategy.
