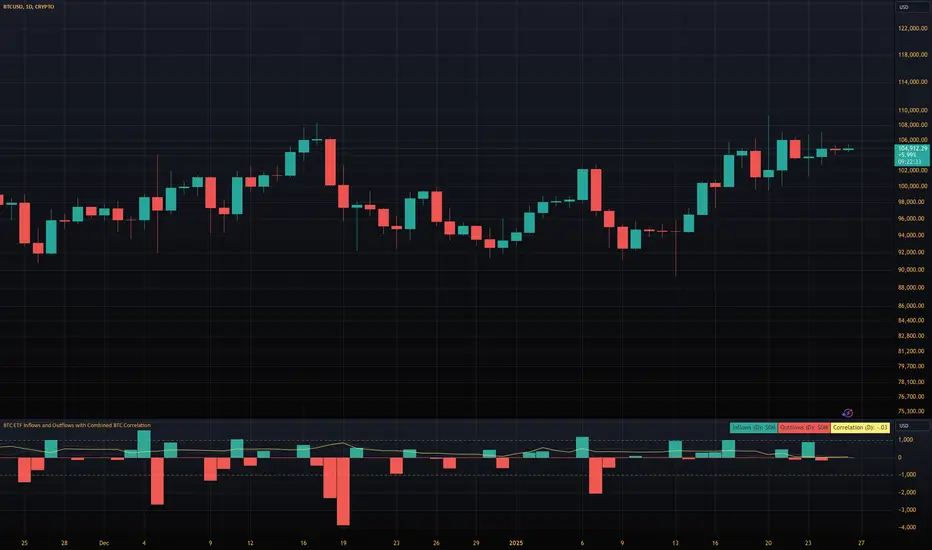
BTC ETF Inflows and Outflows with Combined BTC CorrelationThis script tracks Bitcoin Spot ETF inflows and outflows, calculating their correlation with Bitcoin's price to identify market trends and sentiment. It provides visual insights into ETF flows and the relationship with BTC price movements.
NOTE: The script relies on volume and opens / closes for calculating inflows and outflows. An ETF might issue more shares, which would skew the numbers.
Tìm kiếm tập lệnh với "btc股市下跌"
BTC vs Altcoin CorrelationThis Pine Script indicator calculates and visualizes the rolling correlation between Bitcoin (BTC) and a selected altcoin, while providing insights into the percentage of time the correlation remains above a user-defined threshold. Users can independently configure the correlation calculation period and the lookback period for measuring the percentage of time above the threshold. The correlation is displayed as a color-coded line: green when above the threshold and red otherwise, with a dashed horizontal line marking the threshold level. A dynamic table displays the current correlation value and the percentage of time spent above the threshold within the specified period, enabling quick evaluation of correlation dynamics between BTC and the chosen altcoin.

BTC - Power Law OscillatorDescription:
The BTC - Power Law Oscillator is a technical analysis tool designed to help traders and investors identify potential overbought and oversold conditions in the Bitcoin market. This oscillator is based on a power law model that approximates Bitcoin's historical price trajectory, providing a framework for understanding deviations from this trajectory over time.
Key Features:
Exponential Model: The oscillator uses an exponential model that represents Bitcoin's price growth over time since its inception on January 3, 2009. This model is mathematically expressed as:
price=exp(5.71×ln(days since inception)−38.16)
This captures the long-term growth trend of Bitcoin, allowing for the analysis of deviations from this model.
Deviation Analysis: The Power Law Oscillator measures the percentage deviation of Bitcoin's closing price from the model price. This deviation is expressed as a percentage to illustrate how far the current price is from the expected model trajectory.
Normalization: The oscillator values are normalized to a 0-100 range. A quadratic transformation is applied to enhance sensitivity to higher values, allowing for better visualization and interpretation of extreme conditions.
Bands and Zones:
Upper Band (50): Indicates the 20% threshold. Values above this band suggest overbought conditions, where Bitcoin's price may be significantly above the expected trajectory.
Lower Band (15): Indicates the 5% threshold. Values below this band suggest oversold conditions, where Bitcoin's price may be significantly below the expected trajectory.
Top Zone: The area above the upper band is shaded red, highlighting potential sell or caution areas.
Bottom Zone: The area below the lower band is shaded green, highlighting potential buy or accumulation areas.
Benefits:
Trend Analysis: Helps identify long-term trends and potential reversals by analyzing price deviations from a theoretical model based on historical growth.
Market Timing: Assists in market timing decisions by indicating overbought and oversold conditions with visual bands and zones.
Enhanced Sensitivity: The quadratic normalization enhances sensitivity to changes in the oscillator, providing clearer signals for traders.
Usage Tips:
Complementary Tool: Use this oscillator in conjunction with other technical indicators and fundamental analysis for more comprehensive market insights.
Risk Management: Always employ sound risk management strategies when trading, as no single indicator can guarantee accurate predictions.
Market Context: Consider the broader market context, as Bitcoin's volatility can lead to significant short-term fluctuations.
The BTC - Power Law Oscillator provides a unique perspective on Bitcoin's price movements by leveraging a mathematical model to understand historical growth trends and deviations. Use this tool to gain deeper insights into market dynamics and enhance your trading strategy.

BTC Hash Rate to Price RatioDescription:
The BTC Hash Rate to Price Ratio indicator is a sophisticated tool designed to assist traders in identifying potential market turning points for Bitcoin by combining network health, market sentiment, and valuation metrics. This indicator integrates three key components—Hash Rate, RSI (Relative Strength Index), and MVRV (Market Value to Realized Value)—to provide a comprehensive analysis of Bitcoin's market dynamics.
Key Features:
Hash Rate Analysis: Assesses the computational power of the Bitcoin network, reflecting network health and miner confidence. Changes in the hash rate can signal shifts in market sentiment.
RSI (Relative Strength Index): A momentum oscillator that measures the speed and change of price movements, identifying overbought or oversold conditions. Smoothed RSI provides clearer insights into market momentum.
MVRV (Market Value to Realized Value): A valuation metric comparing Bitcoin's market value to its realized value, offering insights into whether Bitcoin is overvalued or undervalued. Smoothed MVRV enhances signal accuracy.
How It Works:
Red Zones (Sell Signals): Highlighted when both the MVRV and RSI are above the hash rate, indicating potential market tops.
Green Zones (Buy Signals): Highlighted when both the MVRV and RSI are below the hash rate and MVRV is under 15, suggesting potential market bottoms.
Customizable Parameters: Allows traders to adjust smoothing periods and signal thresholds, tailoring the indicator to different trading strategies and market conditions.
Visual Aids: Includes dotted lines at key RSI levels (15 and 75) for quick reference to potential overbought and oversold conditions.
Benefits:
Comprehensive Analysis: Combines technical, fundamental, and network metrics to offer a well-rounded perspective on market conditions.
Early Warning Signals: Aims to provide early indications of potential market reversals, helping traders make informed decisions.
Flexibility: Suitable for both short-term and long-term trading strategies, allowing for adaptation to various market environments.
Usage Tips:
Use this indicator in conjunction with other technical analysis tools and fundamental insights for best results.
Consider the broader market context and macroeconomic factors when interpreting signals.
Practice sound risk management techniques to optimize trading performance.
Unlock the potential of your Bitcoin trading strategy with the BTC Hash Rate to Price Ratio indicator, and gain deeper insights into market dynamics to make more informed trading decisions.

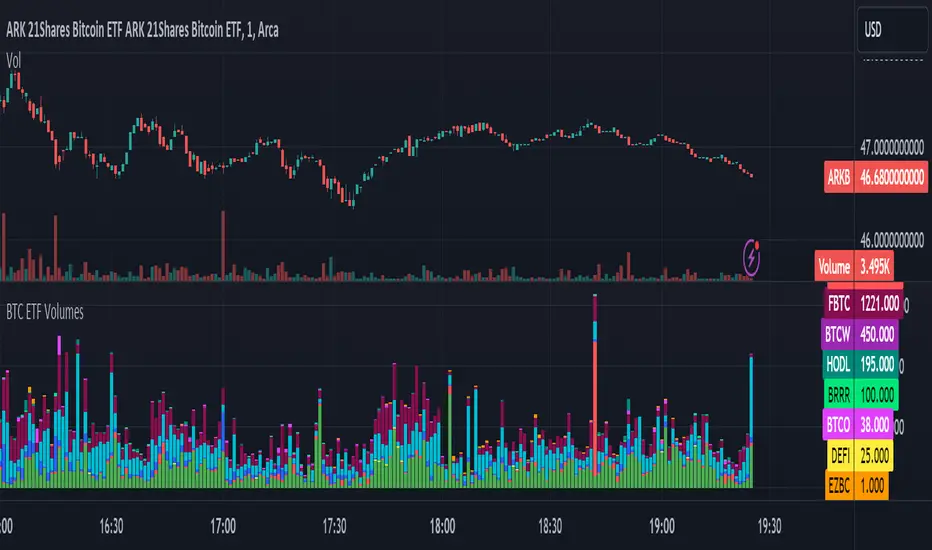
BTC ETF VolumesVolume
This script plots the trading volume of all BTC spot ETFs as well as the aggregate volume. Works on any chart and any timeframe.
Indicators
The volume of every ETF is plotted in a different color, with the total column adding up to the aggregate volume.
If you have price and indicator labels enabled you will also see individual ETF volume on your price scale on the right hand side.
If more BTC ETFs get launched I will add them.
BTC - Hotness Index### Script Description
#### BTC - Hotness Index
This Pine Script, version 4, aims to generate a "Hotness Index" for Bitcoin (BTC) trading by utilizing a Pi Cycle Top Indicator. The script operates in a daily (`1D`) time frame and involves calculating two Simple Moving Averages (SMA) based on `close` prices:
- 111-day SMA (`D_111SMA`)
- 350-day SMA (`D_350SMA`) multiplied by 2
The primary indicator (`pi_indicator`) is derived by dividing `D_111SMA` by `D_350SMA`.
##### Sell Signal
A sell signal is plotted as a histogram if `pi_indicator` crosses above 1 (`pi_plot` variable).
##### Buy Signal
A buy signal is plotted as a histogram if `pi_indicator` crosses below 0.35 (`pi_plot_buy` variable).
##### Horizontal Lines
Two horizontal lines are included to denote the "Buy Zone" and "Sell Zone":
- "Sell Zone" at `pi_indicator` level of 1
- "Buy Zone" at `pi_indicator` level of 0.35
##### Plotting
Histogram plots are used for visualizing the signals:
- Sell signals are colored red (`RGB: 255, 59, 59`)
- Buy signals are colored green (`RGB: 82, 255, 59`)
This script provides traders a visual guide for potential buy/sell opportunities based on the Pi Cycle Top Indicator and the Hotness Index for Bitcoin. It operates under the terms of the Mozilla Public License 2.0.

BTC Performance Table / BTC Seasonality Visualization
This script visualizes Bitcoins "seasonality", in form of a colored table (based on the idea from "BigBangTheory")
The history table shows you which months do statistically perform better/worse in comparison to other months.
How to use this script:
Choose ticker "BLX" ("BraveNewCoin Liquid Index for Bitcoin").
Set the charts time frame to weekly or daily. Tables position on the screen and its colors are configurable.
Table explanation:
Cells show whether a gain or a loss occured from month to month, since BTC came out in 2010.
The price difference, between monthly open and monthly close, determines the cell color (negative -> red, positive -> green).
The year column shows total gain (green) or loss (red) for that particular year.
Each value is presented as a rounded percentage number.
How this script works:
The script calculates the price difference between each monthly and yearly open and close, storing those numbers inside arrays.
Then it populates the table, by using those numbers and doing the cell coloring (there will be a yellow cell, in case no change should occur).
German Short-Description
Prozentuale Übersicht in Tabellenform, der monatlichen, sowie jährlichen, Performance des Bitcoin (basierend auf der Idee von "BigBangTheory").
Hierdurch wird die "Saisonalität" des Bitcoin sichtbar. D.h. welche Monate des Jahres, im Vergleich zu anderen Monaten, statistisch gesehen öfter positiv/negativ schließen.
Zwecks vollständiger Darstellung muss der Ticker "BLX" ("BraveNewCoin Liquid Index for Bitcoin") im weekly oder daily time frame aktiv sein.

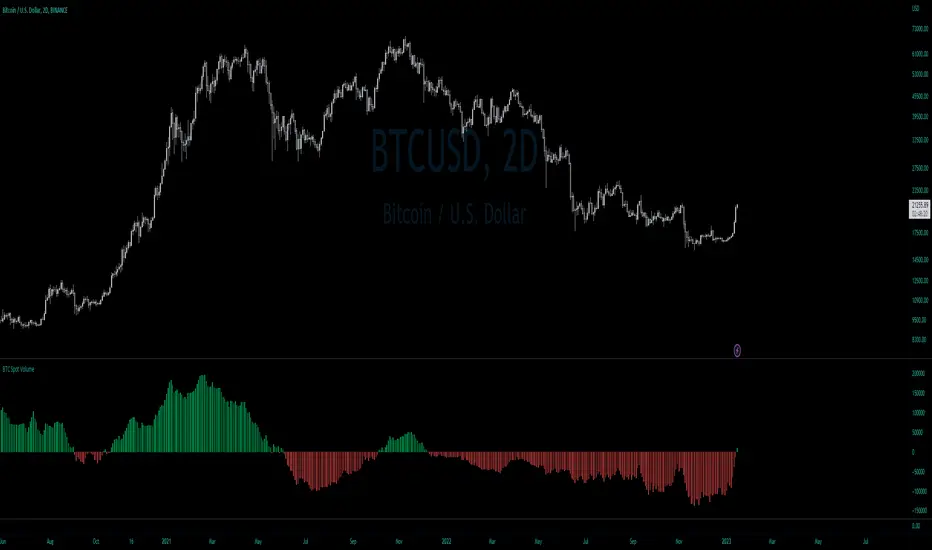
BTC Net Volume (Spot) (by JaggedSoft, fixed by SLN)• WHAT:
This indicator plots the aggregated net volume delta of BTC spot pairs from 8 exchanges over the last 60 periods (default settings).
Tracks the following pairs:
"BINANCE:BTCUSDT"
"BITFINEX:BTCUSD"
"POLONIEX:BTCUSDT"
"BITTREX:BTCUSDT"
"COINBASE:BTCUSD"
"BITSTAMP:BTCUSD"
"KRAKEN:XBTUSD"
"BITGET:BTCUSDT"
"GEMINI:BTCUSD"
• HOW TO USE:
Used for confirmation when watching futures that can experience quick movements in the form of liquidation-events. If the oscillator is green or trending upward, it's confirming a positive bias. The inverse is true for a negative bias. This is especially true on higher timeframes.
Can also be used to find correlations between different tech-assets.
• NOTES:
I forked JaggedSofts indicator to fix the data-source error it was having. Let me know if you want to customize exchanges or add more pairs, maybe I can add that in the future!
This indicator replaces the outdated alternative linked here : Please only use this one
• LIMITATIONS:
Only tested with normal japanese candlesticks .
• THANKS:
to the creator of this script, JaggedSoft. It's a great indicator!
• DISCLAIMER:
Not financial Advice, use at your own risk.
BTC Profitable Wallets StrategyBTC Profitable Wallets Strategy - plots the percentage of profitable BTC wallets and places long orders when the profitable wallet share crosses above 50%, historically a very accurate point to catch the next Bull Run early.
The only setting is a smoothing option using the Moving Average method and length of your choice.
On Chain Data is queried from IntoTheBlock.
This is a 'HODL' strategy, with no exit given. If you'd like to see the historical performance check the Open Profit or place a sell order at the current date.

BTC - Novel RPPI IndicatorHey Everyone,
This is a collab effort between me (a statistician) and @Stein3d (A coder). So if you like this indicator, be sure to also give him the credit!
This a novel indicator theorized by me and applied by Stein3d. We are calling it the RPPI indicator, standing for Regression based Price Prediction Indicator.
This is specifically coded for BTC and cannot be used for alt coins or ETH.
This is pretty beta so your feedback and comments are encouraged!
I will keep it brief, but here is the run down:
What does it do:
The indicator does 3 main things:
1. Predicts bullish targets;
2. Predicts bearish targets;
3. Predicts close price
Who is it applicable for:
This is generally targeted to day trades, but it can have swing trade applications as well. Feel free to get creative with combining it with other indicators that you feel complement it well.
How does it work:
It uses statistical based regressive analysis of BTC to compare current price action to previous price action and determine where the natural high and lows will fall intra-day based on the current price action of the day.
How to use it:
This does not omit the need for technical analysis and chart interpretation; however, it sets realistic expectations of intra-day bullish and bearish price targets as well as its best guess of where the current day close is most likely to fall. Take a look at some of the images below:
The image is pretty self explanatory but you see that there are 2 bull and bear targets. The bull targets, of course, are listed in Green and the bear targets are listed in Red.
There is a dummy neutral support and resistance target which is listed in yellow and the close price is in the purple dotted line.
Of course these are all customizable.
I think that pretty much covers it in a nut shell but let us know if you have any other questions and also please provide feedback!
Thanks for checking it out!

BTC closing price divided by HashrateThis indicator uses the following formula:
BTC Price / BTC Hash Rate
Onchain data has in the past been used successfully to correlate with future price action and sentiment. This indicator can be used to see when the price is oversold / overbought in relation to the Hash rate.

BTC Rapid fire strategy 1M ScalpingRapid Fire strategy is known for scalping strategy for 1 min EURUSD
I change 15 pip stop loss for eurusd and 1.5% for BTC
for Take profit 10 pip foreurusd and 1% for BTC

BTC Fibonacci DMA350 TrendlinesAdapted from Tim Graham's Code.
See Original Inspiring Article from Phillip Swift at: @positivecrypto
When looking into BITSTAMP:BTCUSD 1D data in spreadsheet. Historically, BTC Highs Hit (Simple Daily Moving Average 350 Days) DMA350 in reverse Fibonacci Sequence Order
2013 Hit DMA350*8 before All Time High (ATH)
2017 Hit DMA350*5 before ATH
I expect 2021 to hit DMA350*3 ATH. When BTC hits DMA350*3 ATH, I suggest selling!

BTC Cycle High IndicatorWith high probability show BTC price cycle highs. When price touches the white line, and when yellow and red moving averages cross, we will most likely have our next BTC cycle price high.
Based on Philip Swift's analysis (@positivecrypto)

What is ProfitableBTC, BNB or your favorite Alt Coin? This indicator shows what is profitable at the moment. Red bars are alt days, green bars are BTC days. Otherwise, it is a BNB day.
Hmm, most of the time it is a BNB day!

BTC Futures Settlement Dates - Life Zoltar InvestingThis is a TradingView script to map out the BTC Futures Settlement Dates. There was one floating around the internet but it was old and wasn’t updated. I took that, changed up the code and created this. Orange is CBOE and Blue is CME. You’ll notice shortly after the highlighted closed date, BTC starts to trend upwards.
Data from the below:
CBOE: cfe.cboe.com
CME: www.cmegroup.com

BTC 1H Momentum + Near-Setup Alerts bigbeeukthis alert, sets up on 1h chart of BTC only. it alerts you to price action and when its close to a setup. it will then trigger again once the setup is ready

BTC Flow Dashboard (Spot Premium + OI + Funding)It builds a single flows dashboard that shows whether real spot demand (fiat buyers) or leveraged perps (futures traders) are driving BTC, and then cross-checks that with Open Interest (OI) and funding pressure—all normalized so you can spot regime shifts and squeeze risk fast.
How to read it (practical playbook)
Continuation (healthier trend)
Price ↑, premium > 0 and rising, oiZ ≥ 0 → spot sponsoring the move; perps chase → add on pullbacks.
Leverage-led & vulnerable
Price ↑, premium < 0, fundZ > 0 (expensive longs) → crowding → fade extensions / expect sharp pullbacks.
Buyable dip / absorption
Price ↓, premium ≥ 0 (spot supporting), oiZ flat/down, fundZ ≤ 0 → selling looks weak → scale into reversals.
Exhaustion / mean reversion
premZ ≥ +2 after a run → flows unusually hot → take profits / tighten risk.
premZ ≤ −2 into key support → capitulation risk but also bounce setups if OI/funding aren’t pressuring.

BTC 5-MA Multi Cross Strategy By Hardik Prajapati Ai TradelabThis strategy is built around the five most powerful and commonly used moving averages in crypto trading — 5, 20, 50, 100, and 200-period SMAs (Simple Moving Averages) — applied on a 1-hour Bitcoin chart.
Core Idea:
The strategy aims to identify strong bullish trends by confirming when the price action crosses above all key moving averages. This alignment of multiple MAs indicates momentum shift and helps filter out false breakouts.
⸻
⚙️ How It Works:
1. Calculates 5 Moving Averages:
• 5 MA → Short-term momentum (fastest signal)
• 20 MA → Near-term trend confirmation
• 50 MA → Mid-term trend filter
• 100 MA → Long-term trend foundation
• 200 MA → Macro-trend direction (strongest support/resistance)
2. Buy Condition (Entry):
• A Buy is triggered when:
• The price crosses above the 5 MA, and
• The closing price remains above all other MAs (20, 50, 100, 200)
This signals that momentum is aligned across all time horizons — a strong uptrend confirmation.
3. Sell Condition (Exit):
• The position is closed when price crosses below the 20 MA, showing weakness in short-term momentum.
4. Visual Signals:
• 🟢 BUY triangle below candles → Entry signal
• 🔴 SELL triangle above candles → Exit signal
• Colored MAs plotted for trend clarity.
⸻
📈 Recommended Usage:
• Chart: BTC/USDT
• Timeframe: 1 Hour
• Type: Trend-following crossover strategy
• Ideal for: Identifying major breakout moves and confirming trend reversals.
⸻
⚠️ Notes:
• This script is meant for educational and backtesting purposes only.
• Always apply additional confirmation tools (like RSI, Volume, or VIX-style filters) before live trading.
• Works best during trending markets; may produce whipsaws in sideways zones.

BTC TOPperThe BTC TOPper indicator is a sophisticated technical analysis tool designed to identify critical price levels where Bitcoin's weekly Simple Moving Average (SMA) intersects with historically significant All-Time High (ATH) levels. This indicator is particularly valuable for long-term trend analysis and identifying potential reversal zones in Bitcoin's price action.
Key Features:
🔹 Weekly SMA Analysis: Uses a 200-period Simple Moving Average on weekly timeframe to smooth out short-term volatility and focus on long-term trends
🔹 Persistent Historical ATH Tracking: Automatically detects and "freezes" ATH levels that have been held for more than one year, creating persistent reference levels
🔹 Multi-Level Cross Detection: Tracks up to 10 different frozen ATH levels simultaneously, providing comprehensive historical context
🔹 Visual Cross Alerts: Highlights entire weeks with red background when the weekly SMA crosses any frozen ATH level, making signals impossible to miss
🔹 Advanced Smoothing Options: Includes optional secondary moving averages (SMA, EMA, SMMA, WMA, VWMA) with Bollinger Bands for enhanced analysis
🔹 Customizable Parameters: Adjustable SMA length, offset, and smoothing settings to fit different trading strategies
How It Works:
ATH Detection: Continuously monitors for new all-time highs
Level Freezing: After an ATH is held for 1+ year, it becomes a "frozen" historical level
Cross Monitoring: Watches for intersections between the 200-week SMA and any frozen ATH level
Signal Generation: Highlights the entire week when a cross occurs, providing clear visual alerts
Trading Applications:
Long-term Trend Analysis: Identify when Bitcoin approaches historically significant resistance levels
Reversal Zone Detection: Spot potential areas where price might reverse based on historical context
Support/Resistance Confirmation: Use frozen ATH levels as dynamic support and resistance zones
Market Structure Analysis: Understand how current price relates to historical market cycles
Best Practices:
Use on weekly timeframe for optimal results
Combine with other technical indicators for confirmation
Pay attention to multiple frozen levels clustering in the same price range
Consider market context and fundamentals alongside technical signals
Settings:
Length: 200 (default) - SMA period
Source: Close price
Smoothing: Optional secondary MA with multiple types available
Bollinger Bands: Optional volatility bands around secondary MA
This indicator is ideal for Bitcoin traders and analysts who want to understand the relationship between current price action and historical market structure, particularly useful for identifying potential major reversal zones based on historical ATH levels.

BTC 1D — Trend START/END Signals (clean, no repaint)
This strategy is designed primarily for BTC on the daily (1D) timeframe in TradingView.
BUY (start of uptrend)
Fast EMA is above Slow EMA.
Price breaks above the previous Donchian high.
Optional filters (if enabled): volume surge and strong momentum/RSI.
Only one BUY per uptrend—no additional buys until a SELL occurs.
SELL (end of uptrend)
Price falls below the previous Donchian low, or
Price drops below the Slow EMA, or
Momentum flips bearish (DI− > DI+ or RSI ≤ threshold).
One SELL marks the end of the uptrend.

BTC Power-Law Decay Channel Oscillator (0–100)🟠 BTC Power-Law Decay Channel Oscillator (0–100)
This indicator calculates Bitcoin’s position inside its long-term power-law decay channel and normalizes it into an easy-to-read 0–100 oscillator.
🔎 Concept
Bitcoin’s long-term price trajectory can be modeled by a log-log power-law channel.
A baseline is fitted, then an upper band (excess/euphoria) and a lower band (capitulation/fear).
The oscillator shows where the current price sits between those bands:
0 = near the lower band (historical bottoms)
100 = near the upper band (historical tops)
📊 How to Read
Oscillator > 80 → euphoric excess, often cycle tops
Oscillator < 20 → capitulation, often cycle bottoms
Works best on weekly or bi-weekly timeframes.
⚙️ Adjustable Parameters
Anchor date: starting point for the power-law fit (default: 2011).
Smoothing days: moving average applied to log-price (default: 365 days).
Upper / Lower multipliers: scale the bands to align with historical highs and lows.
✅ Best Use
Combine with other cycle signals (dominance ratios, macro indicators, sentiment).
Designed for long-term cycle analysis, not intraday trading.

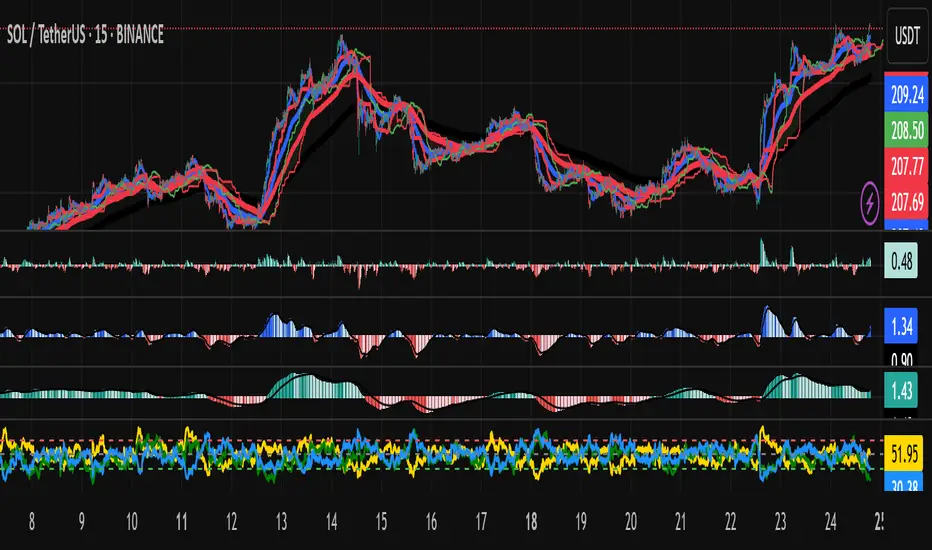
BTC Dominance & Price RSI Analyzer by Sajad BagheriThis indicator analyzes the Relative Strength Index (RSI) for three key cryptocurrency metrics:
Bitcoin Price (BTC/USDT)
Bitcoin Dominance (BTC.D)
Tether Dominance (USDT.D)
It provides a comprehensive view of market momentum by displaying three RSI lines in a single pane, allowing traders to identify overbought and oversold conditions across these important metrics simultaneously.